ISSN: 2372-4978 (Print), 2372-4986 (Online) Copyright © The Author(s). All Rights Reserved. Published by American Research Institute for Policy Development DOI: 10.15640/ijat.v3n1a7 URL: http://dx.doi.org/10.15640/ijat.v3n1a7
The Effect of Dividend Tax on Earnings and Contributed Capital in Firm Valuation
Chia-Chun Hsieh1 & Ling-Yi Chou2
Abstract
Earlier research applies theoretical valuation models in studying tax capitalization, an effect that results in different pricing on contributed capital, retained earnings, and net income due to dividend taxes. There are also debates regarding whether it is appropriate to apply the price-level model in empirical research, because the coefficients may be sensitive to model specifications. To further explore this issue, this paper investigates tax capitalization in different tax regimes, where individual dividend tax rates vary across countries and over time. First, we compare U.S. with Canada, which are similar in environment but different in the level of double taxation on dividends. We find differential pricing on retained earnings and contributed capital, but the magnitudes are inconsistent with the theory. Second, we examine a statutory tax rate change in Taiwan in 1998 when an “integrated” income tax system was implemented to alleviate double taxation on dividends. We find that changes in the pricing on retained earnings coincide with changes on dividend tax, but the results on the relationship between contributed capital and retained earnings are mixed. The results are more consistent with the argument that caution should be exerted when applying the model in studying tax capitalization effect.
Keywords: Tax capitalization; equity valuation; dividend taxes; integrated income tax system
1. Introduction
The degree to which explicit corporate and personal taxes on net income, dividends, and capital gains affects the price of publicly traded companies has been the subject of much prior research (e.g., Harris and Kemsley 1999).
1
Assistant Professor, Department of Accounting, Hong Kong University of Science and Technology, Clear Water Bay, Kowloon, Hong Kong. Email: achsieh@ust.hk, Phone: +852-2358-7573
2
At one extreme, assuming that every investor in the stock market pays the same tax rate on dividends, it is possible that the stock price of two otherwise equivalent firms could differ due to the extent to which dividends are taxed or are not taxed. Take stock repurchase and common dividends for example. In both cases, shareholders receive cash from firms. However, the former are not always taxed, while the latter are taxed. If one firm made use of stock repurchases and the other paid common dividends, the stock price of the firm that paid dividends would be lower. In this situation, dividend taxes are “capitalized” into the stock price. On the other hand, it is also possible that the existence of differentially-taxed individuals can reduce the degree to which the form of dividend payment affects the price of the firm. The existence of marginal stockholders who are not taxed (e.g., charities) tends to equilibrate the returns on these two hypothetical firms.
This paper investigates the magnitude of tax capitalization effects in the United States, Canada, and Taiwan where individual dividend tax rates vary across countries and over time. Motivated by the debate regarding the use of modified Ohlson’s (1995) model for studying tax capitalization effect, we analyze tax capitalization effects by linking firms’ price levels to retained earnings, contributed capital and net income. Harris and Kemsley (1999) document different pricing on equity components, and they attribute the result to tax capitalization effect. On the other hand, Hanlon, Myers, and Shevlin (2003) and Dhaliwal, Erickson, Frank, and Banyi (2003) disagree and argue that the empirical models are mis-specified. Therefore, this paper replicates the approach taken by Harris and Kemsley (1999) and an alternative approach taken by Hanlon et al. (2003). Nevertheless, this paper differs from those prior studies by focusing on firms subject to different levels of shareholder taxes in different tax regimes. For example, firms in the United States and Canada probably share very similar economic environment, but the shareholders of the U.S. firms bear more tax on their dividend income. The cross-country study thus allows for a direct examination of the tax capitalization effect.
On the other hand, Harris and Kemsley (1999), Hanlon et al. (2003), and Dhaliwal et al. (2003) all study the changes after the Tax Reform Act of 1986 (TRA 86). All of them find a less negative coefficient on retained earnings during the post-reform period. Harris and Kemsley (1999) interpret this as reflecting the tax cut during the post-reform period, while Hanlon et al. (2003) and Dhaliwal et al. (2003) have different interpretations. We therefore use a statutory change in dividend tax in Taiwan for investigating this issue. In 1998, there is a major law change in Taiwan that moved dividend tax from separate taxation (i.e., at both corporate and individual levels) to a fully “integrated” tax system. That is, the income tax paid by companies can serve as tax credits for personal income tax when dividends are paid to shareholders. This alleviates individual tax burden and removes double taxation. Based on prior research, we expect that the pricing of retained earnings will be higher after the adoption of the integrated income tax system.
The study of Taiwanese firms therefore focuses on comparing valuation coefficients before and after the tax law change that took place in 1998. We find that the weight on retained earnings for this sample increases following the implementation of the integrated tax system. Moreover, to encourage distribution of earnings, an additional 10% tax was charged on undistributed retained earnings starting from the next year of the implementation. Consistent with this requirement, we find that the weight on retained earnings declines in 1999, coinciding with the implementation of the 10% tax on undistributed retained earnings. The changes in the coefficient are consistent with the interpretation of tax capitalization effect (e.g., Harris and Kemsley 1999). On the other hand, the results regarding contributed capital are inconclusive. We find the coefficient on contributed capital in 1999 is higher than in 1997 in one specification, while in another specification we do not find such effect.
In summary, we examine the use of residual income valuation model in the study of tax capitalization, and our results are more consistent with Dhaliwal et al. (2003) and Hanlon et al. (2003) that the empirical models based on Ohlson (1995) may be mis-specified in studying tax capitalization effect. Our approach provides direct evidence that helps clarify certain arguments in the debate in prior research. The remainder of the paper is organized as follows. Section 2 reviews the related literature and the debates. Section 3 discusses hypotheses and research methodology. Section 4 describes the sample and discusses the empirical results. Section 5 concludes.
2. Prior Research
There is a large literature that examines whether investors’ taxes affect share prices. Theoretically, if the marginal investor is tax exempt, Miller and Scholes (1978) show that taxes can be irrelevant to price setting. Consistent with other valuation approaches, Ohlson (1995) also implicitly assumes that the marginal investor is tax exempt. Alternatively, if marginal investors pay taxes then stock prices will reflect this as investors seek to maximize after-tax returns. In a world of taxes, the introduction of tax clienteles to theoretical frameworks provides for a range of tax capitalization in prices, from zero to one hundred percent, depending on the importance of clienteles. (See Shackelford and Shevlin 2001 for a detailed discussion.)
Harris, Hubbard, and Kemsley (2001) extend the prior study to an international setting. They further investigate dividend taxation across different tax regimes in the U.S. as well as in different countries. Their results support their earlier conclusions that retained earnings are valued less per unit than contributed capital depending on the level of double taxation of dividends.3 Dhaliwal et al. (2003) and Hanlon et al. (2003) critique the research design in the aforementioned studies, and suggest that the results in the earlier studies are spuriously induced through the use of an inappropriate model. Based on their interpretation of Ohlson (1995), Hanlon et al. (2003) find evidence that rejects full tax capitalization on retained earnings as a result of paying future dividend from current stock of retained earnings. Shackelford and Shevlin (2001) discuss this literature in detail, and point out theoretical reasons against full tax capitalization of dividends. They note that most companies have very low dividend yields and many do not pay dividends at all. Given the long horizon until the terminal dividend for the average firm, they argue that the price implications of dividend taxes should therefore be small.
In response, Kemsley (2001ab) makes some comments and replies for justifying their approach. He argues that the assumption that firms finally distribute their earnings as dividends does not alter his primary predictions, but would serve only to reduce the empirical estimates of capitalization effects. While Hanlon et al. (2003) and Dhaliwal et al. (2003) provide evidence against the findings in Harris and Kemsley (1999), they do find results consistent with Harris and Kemsley (1999) that the coefficient on retained earnings increases after a tax-cut reform in 1986. Hanlon et al. (2003) view this result as “the most convincing” among Harris and Kemsley’s (1999) sensitivity analysis (page 126), although they point out that the relationship between the weights on contributed capital and retained earnings casts doubt on the model specification. The use of tax regime changes thus warrants further investigation. This paper draws heavily on Hanlon et al. (2003) and Harris and Kemsley (1999) to investigate the magnitude of tax capitalization of dividends in the United States, Canada, and Taiwan. In this study, we provide evidence from Taiwan and Canada where double taxation is less severe than in the United States.
If tax capitalization is important in the U.S., then an equally risky firm in Canada should have higher equilibrium prices, and higher valuation coefficients on retained earnings and net income.
3. Research Questions and Methodology
3.1 Research Questions
This paper studies two research questions. The first asks whether retained earnings, contributed capital and net income take on higher valuation coefficients in Canada versus the United States. Similar to Harris et al. (2001), we take advantage of differential tax regimes to provide evidence on tax capitalization effects. In the United States, individuals generally face full double-taxation of dividends. In Canada, on the other hand, investors are subject to partial double taxation. For example, based on 2001 rates in British Columbia, the effective entity level tax rate is 44.62%, the effective personal tax rate is 32.1%, and the effective combined tax rate is 62.41%.4
Assuming then that there is no full integration of stock markets across these two countries, we hypothesize that the coefficients on retained earnings, net income and contributed capital will be higher in Canada than in the U.S. This hypothesis is parallel to that made in Harris et al. (2001) using different countries (i.e., the United Kingdom, Japan, France, Germany, and Australia). An advantage of this comparison is that the financial reporting environment in the U.S. and Canada and the trading environment are more similar than in the countries included in the prior study, which should help to control for omitted variables related to these factors. On the other hand, a disadvantage to this setting is that the magnitude of tax differences across the U.S. and Canada may not be as extreme as those among the countries studied by Harris et al. (2001).
The second research question of this paper concerns whether retained earnings takes on a higher valuation coefficient following the integration of dividend taxation in Taiwan in 1998. Harris et al. (2001) also test cross-period variation using data from United Kingdom. In the periods used for their analysis the top personal tax rate dropped from 60% to 40%, while the imputation tax credit rate remained stable.
Similarly, we use data from Taiwan with a sample period in which the tax system was dramatically changed from separate to a fully integrated system in 1998. This distinctive change in tax system provides a good opportunity to re-examine dividend tax capitalization. In 1998, the Ministry of Finance in Taiwan adopted an integrated income tax system called imputation system. Before the implementation, corporate earnings and investors’ dividends were subject to double taxation. The taxes at the two levels were integrated by granting investors imputation credits for personal income tax deduction when they obtain dividends. In other words, dividends distributed by companies are only subject to personal income tax. (See Appendix.) Because there is no longer double taxation of dividends, investors’ tax burden is much less than before. If tax clienteles are not prevalent in Taiwan, investors will be willing to pay higher stock price for the same dollar of retained earnings, after the tax law change. We hypothesize therefore that the share prices capitalize less dividend tax and the valuation coefficient on retained earnings is higher in the after-implementation period.
In Taiwan, the corporate tax rate is 17% while the highest marginal tax rate for individual shareholder is 40%.5 Although the integrated tax system effectively eliminates double taxation, firms still have an incentive to deter the dividend payment to help their block holders avoid the tax at individual level since the difference between corporate and personal tax rate is still large. To combat this tendency, the Ministry of Finance in Taiwan called on an extra 10% tax on firm’s undistributed earnings. This means that starting from 1999, which is the first year of retained earnings generated after the law change, undistributed earnings are taxed for an extra 10%. This is a controversial policy because it again subjects corporate earnings to double taxation. Intuitively, the integrated system should make retained earnings “less tax-capitalized,” which implies that the coefficient on retained earnings in the regression should go up after the enforcement of the law. However, the additional 10% charge on companies’ retained earnings might have a reverse effect on the coefficient. More specifically, with the additional tax on undistributed earnings, investors who receive dividends in the following years are actually taxed on a higher rate and obtain lower after-tax return than if there is no such tax on retained earnings. This implies that the firms with a high amount of retained earnings are “less welcomed” by investors.
Although the valuation coefficients on retained earnings may increase in the after-implementation period, the additional 10% tax can work oppositely and partially cancel the increase. Therefore, we further investigate whether the weight on retained earnings in this sample is reduced following the implementation of the 10% tax on undistributed earnings.
3.2 Valuation Model
We first estimate two basic regression models developed by Hanlon et al. (2003). Their models are used because the models have stronger theoretical support than that used by Harris and Kemsley (1999). Hanlon et al. (2003) derive a theoretical model based on Ohlson (1995). The authors start with the traditional measure of residual income and the Ohlson (1995) linear information dynamics and assume that future dividend taxes are fully capitalized in stock prices. (See Hanlon et al. 2003, Appendix B.) The model is thus derived for discussion of coefficient weights on contributed capital, retained earnings, and net income:
Pit= β0+ β1 CCit+ β2REit+ β3NIit+ εit, (1)
where Pit is the price per share at the end of a fiscal year, CCit is the end-of-year
contributed capital, REit is the end-of-year retained earnings, and NIit is the bottom
line net income for the year. Theoretically, = (1− ) 1− +
( ) , = (1− ) 1− ,and = (1− ) , where td is the
tax rate on dividend, R is one plus cost of capital (1+r), and is the time series persistence of residual income. Based on this theoretical framework, Hanlon et al. (2003) use equation (1) for empirical tests, which is also the first model that we estimate. According to the theoretical values, the coefficient on contributed capital should be higher than retained earnings, and the difference comes from the discounted deferred tax benefit of contributed capital not being taxed as dividends. If equation (1) is correctly estimated, the coefficient on contributed capital will be higher than that on retained earnings. For empirical tests, we allow coefficients on contributed capital, retained earnings, and net income to vary based on a dummy variable intending to capture cross-sectional variation in tax rates.6 All the variables are adjusted on a per-share basis.
In addition, we can rearrange and collect terms from equation (1) under the assumption of full tax capitalization (see Hanlon et al. 2003, Appendix B):
Pit = α0 + α1WCCit + α2WREit + α3WNIit+ εit. (2)
In the above equation, = 1− ∙ , = 1− ∙ ,
= ∙ , and the other variables are defined as in the previous model.
Equation (2) implies equal coefficients on the “weighted” contributed capital (WCC), retained earnings (WRE), and net income (WNI) (i.e., α1= α2= α3 = 1-td, see
Hanlon et al. 2003 for detailed discussion). Therefore, this regression model provides a more direct way for us to test whether there are tax effects. The model has some implicit assumptions. First, it is based on residual income valuation with AR(1) process. Second, all future dividends are going to be taxed. Third, the going-concern principle holds so that number of periods goes to infinity. For the empirical tests we also assume a constant cost of capital, r, which is equal to 12%. We estimate the persistence of residual income (ω) by industries using 2-digit SIC codes.7 For comparison purposes, we also test the model of Harris and Kemsley (1999), which replaces contributed capital with book value of equity and includes an additional interaction term of net income and the ratio of retained earnings to book value:
Pit= β0+ β1BVit+ β2REit+ β3NIit+ β4(REit/BVit*NIit) + εit, (3)
where BVit is book value of equity, and the other variables are defined as in the
previous models. Harris and Kemsley (1999) argue that although dividend tax reduces the valuation of retained earnings, it also reduces the required return and increases the firm value, which they refer to as economic profit effect. Therefore they include the interaction term to separate the two effects and expect the coefficient on the interaction term to be positive because of the economic profit effect. Hanlon et al. (2003) question the inclusion of the interaction term by showing that this term plays no role in theoretical models unless it proxies for some other information.
4. Empirical Results
4.1 Tests of Predictions for Canadian and the U.S samples
The U.S. and Canadian samples come from the 2002 COMPUSTAT files with available data from 1982 to 2001. Following Harris and Kemsley (1999), Harris et al. (2001), and Hanlon et al. (2003), we eliminate observations if they: (1) have at least one of the variables of Pit, BVit, REit, and NIit with missing values; (2) have negative
book value of equity, retained earnings, or net income; (3) are in the top 1% of the distribution of price, book value of equity, retained earnings, or net income; (4) have market-to-book ratios that exceed ten.8 We also eliminate firms with missing assets as in Hanlon et al. (2003). Furthermore, foreign incorporations (i.e., the companies incorporated in other countries) are excluded. The selection results in 27,984 observations for the U.S. sample, and 5,097 observations for the Canadian sample.
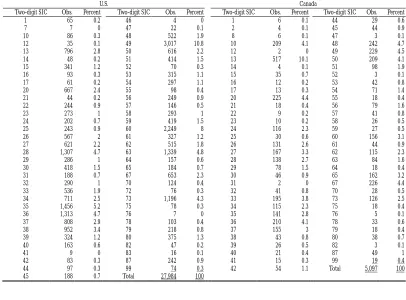
Table 1: Industry Distribution of the U.S. and Canadian Samples
U.S. Canada
Two-digit SIC Obs. Percent Two-digit SIC Obs. Percent Two-digit SIC Obs. Percent Two-digit SIC Obs. Percent
1 65 0.2 46 4 0 1 6 0.1 44 29 0.6
7 7 0 47 22 0.1 2 4 0.1 45 44 0.9
10 86 0.3 48 522 1.9 8 6 0.1 47 3 0.1
12 35 0.1 49 3,017 10.8 10 209 4.1 48 242 4.7 13 796 2.8 50 616 2.2 12 2 0 49 229 4.5 14 48 0.2 51 414 1.5 13 517 10.1 50 209 4.1 15 341 1.2 52 70 0.3 14 4 0.1 51 98 1.9 16 93 0.3 53 315 1.1 15 35 0.7 52 3 0.1 17 61 0.2 54 297 1.1 16 12 0.2 53 42 0.8 20 667 2.4 55 98 0.4 17 13 0.3 54 71 1.4 21 44 0.2 56 249 0.9 20 225 4.4 55 18 0.4 22 244 0.9 57 146 0.5 21 18 0.4 56 79 1.6
23 273 1 58 293 1 22 9 0.2 57 41 0.8
24 202 0.7 59 419 1.5 23 10 0.2 58 26 0.5 25 243 0.9 60 2,249 8 24 116 2.3 59 27 0.5 26 567 2 61 327 1.2 25 30 0.6 60 156 3.1 27 621 2.2 62 515 1.8 26 131 2.6 61 44 0.9 28 1,307 4.7 63 1,339 4.8 27 167 3.3 62 115 2.3 29 286 1 64 157 0.6 28 138 2.7 63 84 1.6 30 418 1.5 65 184 0.7 29 78 1.5 64 18 0.4 31 188 0.7 67 653 2.3 30 46 0.9 65 162 3.2
32 290 1 70 124 0.4 31 2 0 67 226 4.4
33 536 1.9 72 76 0.3 32 41 0.8 70 28 0.5 34 711 2.5 73 1,196 4.3 33 195 3.8 73 126 2.5 35 1,456 5.2 75 78 0.3 34 115 2.3 75 18 0.4 36 1,313 4.7 76 7 0 35 141 2.8 76 5 0.1 37 808 2.9 78 103 0.4 36 210 4.1 78 33 0.6 38 952 3.4 79 218 0.8 37 155 3 79 18 0.4 39 324 1.2 80 375 1.3 38 43 0.8 80 38 0.7 40 163 0.6 82 47 0.2 39 26 0.5 82 3 0.1
41 9 0 83 16 0.1 40 21 0.4 87 49 1
42 83 0.3 87 242 0.9 41 15 0.3 99 19 0.4 44 97 0.3 99 74 0.3 42 54 1.1 Total 5,097 100
45 188 0.7 Total 27,984 100
Table 1 shows the variation of industries in the two countries that we examine. The observations are variably distributed in different industries in the two samples. The only industries that account for over 10% of the observations in each country are (in 2-digit SIC code): industry 49 (electric, gas, and sanitary services, 10.8%) for the U.S. sample, and industry 13 (oil and gas extraction or services, 10.1%) for the Canadian sample. Table 2 shows the descriptive statistics of variables. The distributions of the variables in the U.S. and Canadian samples are quite close.
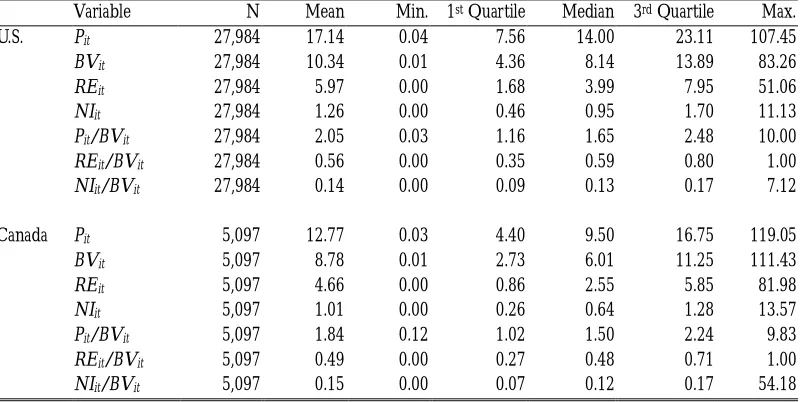
Table 2: Descriptive Statistics for the U.S. and Canadian Samples
Variable N Mean Min. 1st Quartile Median 3rd Quartile Max.
U.S. Pit 27,984 17.14 0.04 7.56 14.00 23.11 107.45 BVit 27,984 10.34 0.01 4.36 8.14 13.89 83.26 REit 27,984 5.97 0.00 1.68 3.99 7.95 51.06 NIit 27,984 1.26 0.00 0.46 0.95 1.70 11.13 Pit/BVit 27,984 2.05 0.03 1.16 1.65 2.48 10.00 REit/BVit 27,984 0.56 0.00 0.35 0.59 0.80 1.00 NIit/BVit 27,984 0.14 0.00 0.09 0.13 0.17 7.12
Canada Pit 5,097 12.77 0.03 4.40 9.50 16.75 119.05 BVit 5,097 8.78 0.01 2.73 6.01 11.25 111.43 REit 5,097 4.66 0.00 0.86 2.55 5.85 81.98 NIit 5,097 1.01 0.00 0.26 0.64 1.28 13.57 Pit/BVit 5,097 1.84 0.12 1.02 1.50 2.24 9.83 REit/BVit 5,097 0.49 0.00 0.27 0.48 0.71 1.00 NIit/BVit 5,097 0.15 0.00 0.07 0.12 0.17 54.18
Note: Pit, BVit, REit, and NIit represent respectively the fiscal year-end price per share, book value of shareholders’
equity per share, book value of retained earnings per share, and net income per share, for firm i at period t. All values are defined in original currencies.
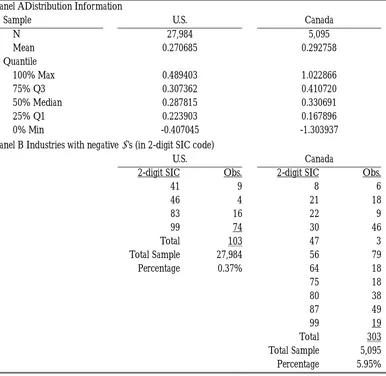
In Table 3, Panel A presents the distribution information of the estimated ’s and Panel B lists the industries with negative estimated ’s. The variable (i.e., the time series persistence of residual income) is used in equation (2) and is calculated based on residual income valuation with AR(1) process. The ’s are estimated on industry levels. As shown in Table 3, about 0.4% observations of the U.S. sample and 6% observations of the Canadian sample have negative ’s. We delete these observations when estimating the valuation coefficients of equation (2).9
Table 3: Descriptive Information of Estimated ’s
Panel ADistribution Information
Sample U.S. Canada
N 27,984 5,095
Mean 0.270685 0.292758
Quantile
100% Max 0.489403 1.022866
75% Q3 0.307362 0.410720
50% Median 0.287815 0.330691
25% Q1 0.223903 0.167896
0% Min -0.407045 -1.303937
Panel B Industries with negative ’s (in 2-digit SIC code)
U.S. Canada
2-digit SIC Obs. 2-digit SIC Obs.
41 9 8 6
46 4 21 18
83 16 22 9
99 74 30 46
Total 103 47 3
Total Sample 27,984 56 79
Percentage 0.37% 64 18
75 18
80 38
87 49
99 19
Total 303
Total Sample 5,095
Percentage 5.95%
Note: The ’s are estimated by regressing residual income on prior period residual income by industries. For the Canadian sample, observations of industry with 2-digit SIC code 12 are deleted because there are only two observations from different companies, and thus unable to estimate with lag residual income.
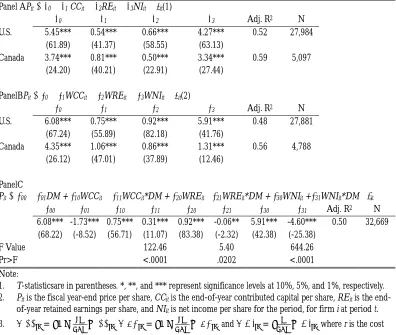
Consistent with Hanlon et al. (2003), the coefficient on retained earnings (coeff. = 0.66, t = 58.55) is higher than that of contributed capital (coeff. = 0.54, t = 41.37), which contradicts the conjecture that retained earnings is valued lower than contributed capital for future dividend tax. Contrary to the U.S., the Canadian sample has lower coefficient on retained earnings (coeff. = 0.50, t = 22.91) than that of contributed capital (coeff. = 0.81, t = 40.21). Panel B shows similar results by using equation (2). Consistent with Hanlon et al. (2003), these results might imply that there exists misspecification problem for the empirical model based on Ohlson (1995).
Comparing the U.S. and Canadian samples, the results are not consistent with the hypothesis that the valuation coefficients for the Canadian sample will be higher than the United States. For Panel A, only the coefficient on contributed capital in the Canadian sample takes on higher value than in the U.S. sample. Similarly, in Panel B the coefficient on weighted contributed capital (WCC) is higher in Canada than in the U.S., but the coefficient on weighted retained earnings (WRE) and weighted net income (WNI) are lower. Both panels suggest no support for the hypothesis that the valuation coefficients take on higher values in Canada than in the U.S. because Canada adopts integrated system that lessens the degree of double taxation.
One thing to be mentioned in Panel B is that the coefficient on WNI is obviously higher than those of WCC and WRE. As mentioned previously, the three valuation coefficients are expected to be the same as their theoretical value, 1td. The
difference may come from the fact that the variable WNI is obtained by multiplying net income with a scalar different from that for WCC and WRE. Furthermore, we restrict the cost of capital r to be equal to 12% and estimate the persistence by 2-digit SIC code, which may lead to improper scaling of those variables.
Table 4 Regression of Price on (Nominal and Weighted) Contributed Capital, Retained Earnings, and Net Income
Panel APit= β0+ β1 CCit+ β2REit+ β3NIit+ εit(1)
β0 β1 β2 β3 Adj. R2 N
U.S. 5.45*** 0.54*** 0.66*** 4.27*** 0.52 27,984 (61.89) (41.37) (58.55) (63.13)
Canada 3.74*** 0.81*** 0.50*** 3.34*** 0.59 5,097 (24.20) (40.21) (22.91) (27.44) PanelBPit= α0+ α1WCCit+ α2WREit+ α3WNIit+ εit(2)
α0 α1 α2 α3 Adj. R2 N
U.S. 6.08*** 0.75*** 0.92*** 5.91*** 0.48 27,881 (67.24) (55.89) (82.18) (41.76)
Canada 4.35*** 1.06*** 0.86*** 1.31*** 0.56 4,788 (26.12) (47.01) (37.89) (12.46)
PanelC
Pit= α00+ α01DM + α10WCCit+ α11WCCit*DM + α20WREit+α21WREit*DM + α30WNIit +α31WNIit*DM+ εit
α00 α01 α10 α11 α20 α21 α30 α31 Adj. R2 N
6.08*** -1.73*** 0.75*** 0.31*** 0.92*** -0.06** 5.91*** -4.60*** 0.50 32,669 (68.22) (-8.52) (56.71) (11.07) (83.38) (-2.32) (42.38) (-25.38)
F Value 122.46 5.40 644.26
Pr>F <.0001 .0202 <.0001 Note:
1. T-statisticsare in parentheses. *, **, and *** represent significance levels at 10%, 5%, and 1%, respectively.
2. Pit is the fiscal year-end price per share, CCit is the end-of-year contributed capital per share, REit is the
end-of-year retained earnings per share, and NIit is net income per share for the period, for firm i at period t.
3. = 1− ∙ , = 1− ∙ , and = ∙ , where r is the cost of capital (set at 12%), R = 1+r, and is the time series persistence of residual income.
4. DM = 0 for the U.S. companies; DM = 1 for Canadian companies.
Using the explanation by Harris and Kemsley (1999), the results suggest dividend capitalization since the coefficient on retained earnings in U.S. is more negative than that in Canada (U.S.: coeff. = -0.23, t = -7.69; Canada: coeff. = -0.20, t = -4.21). On the other hand, Panel B reports an alternative specification as in Hanlon et al. (2003):
Pit = β0 + β1CCit + β2REit + β3NIit + β4(REit/BVit*NIit) + it. (4)
Table 5 Regression of Price on Book Value of Equity (Contributed Capital), Retained Earnings, and Net Income, with Interaction Term (Harris &
Kemsley Model)
Panel A Pit= β0+ β1BVit+ β2REit+ β3NIit+ β4(REit/BVit*NIit) + εit (3)
β0 β1 β2 β3 β4 Adj. R2 N
U.S. 5.42*** 0.75*** -0.23*** 2.27*** 3.31*** 0.52 27,984
(61.73) (37.32) (-7.69) (14.29) (13.84)
Canada 3.72*** 0.75*** -0.20*** 4.05*** -1.26*** 0.59 5,097
(24.07) (26.87) (-4.21) (14.61) (-2.86)
PanelBPit= β0+ β1CCit+ β2REit+ β3NIit+ β4(REit/BVit*NIit) + εit (4)
β0 β1 β2 β3 β4 Adj. R2 N
U.S. 5.42*** 0.75*** 0.52*** 2.27*** 3.31*** 0.52 27,984
(61.73) (37.32) (33.97) (14.29) (13.84)
Canada 3.72*** 0.75*** 0.55*** 4.05*** -1.26*** 0.59 5,097
(24.07) (26.87) (19.29) (14.61) (-2.86)
Note:
1. T-statistics are in parentheses. *, **, and *** represent significance levels at 10%, 5%, and 1%, respectively.
2. Pit is the fiscal year-end price per share, CCit is the end-of-year contributed capital per share, REit is the end-of-year retained earnings per share, and NIit is net income per share for the period, for firm i at period t.
3. WCC = 1− ∙CC , WRE = 1− ∙RE , and WNI = ∙NI , where r is
the cost of capital (set at 12%), R = 1+r, and is the time series persistence of residual income.
In summary, we find no evidence supporting that in Canada the valuation coefficients are consistently higher using the valuation model. One possible explanation is that under the Canadian tax system the actual tax rate is not largely different from that of the U.S., and thus the tax effect is not observable. On the other hand, an alternative explanation is that the empirical model derived from Ohlson (1995) to examine tax effect is too simplified and not well-specified. To explore further, we proceed to the next research question regarding a change in tax laws.
4.2 Tests for the Change in Taiwanese Tax Law
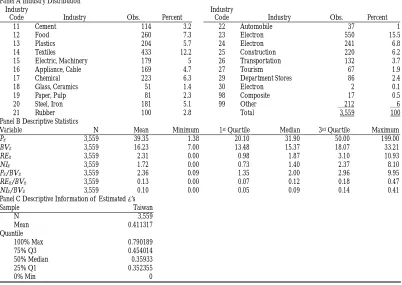
There are 3,559 observations for the Taiwanese sample. Panel A of Table 6 shows the industry distribution. Two industries accounts for slightly more observations in the sample. Industry 23 (Electron) and 14 (Textiles) account for 15.5% and 12.2% of the sample firms, respectively. Panel B reports the descriptive statistics. The ratios of retained earnings to book value are smaller than those in the U.S. and Canadian samples reported in Table 2. This is because in Taiwan, earnings tend to be used first to cover loss, to pay corporate taxes, and to appropriate a 10% legal contributed capital before distribution (Company Act, Article 112). Panel C shows the estimated ω’s for the Taiwanese sample.
Table 6: Description of Taiwanese Sample
Panel A Industry Distribution Industry
Code Industry Obs. Percent
Industry
Code Industry Obs. Percent
11 Cement 114 3.2 22 Automobile 37 1
12 Food 260 7.3 23 Electron 550 15.5
13 Plastics 204 5.7 24 Electron 241 6.8
14 Textiles 433 12.2 25 Construction 220 6.2
15 Electric, Machinery 179 5 26 Transportation 132 3.7
16 Appliance, Cable 169 4.7 27 Tourism 67 1.9
17 Chemical 223 6.3 29 Department Stores 86 2.4
18 Glass, Ceramics 51 1.4 30 Electron 2 0.1
19 Paper, Pulp 81 2.3 98 Composite 17 0.5
20 Steel, Iron 181 5.1 99 Other 212 6
21 Rubber 100 2.8 Total 3,559 100
Panel B Descriptive Statistics
Variable N Mean Minimum 1st Quartile Median 3rd Quartile Maximum
Pit 3,559 39.35 1.38 20.10 31.90 50.00 199.00
BVit 3,559 16.23 7.00 13.48 15.37 18.07 33.21
REit 3,559 2.31 0.00 0.98 1.87 3.10 10.93
NIit 3,559 1.72 0.00 0.73 1.40 2.37 8.10
Pit/BVit 3,559 2.36 0.09 1.35 2.00 2.96 9.95
REit/BVit 3,559 0.13 0.00 0.07 0.12 0.18 0.47
NIit/BVit 3,559 0.10 0.00 0.05 0.09 0.14 0.41
Panel C Descriptive Information of Estimated ω’s
Sample Taiwan
N 3,559
Mean 0.411317
Quantile
100% Max 0.790189
75% Q3 0.454014
50% Median 0.35933
25% Q1 0.352355
0% Min 0
Note: Pit, BVit, REit, and NIit represent respectively the fiscal year-end price per share, book value of shareholders’
equity per share, book value of retained earnings per share, and net income per share, for firm i at period t. All values are defined in original currencies.
After the implementation of integrated system in Taiwan in 1998, the income tax at corporate level can be deducted from individual income tax and investors’ tax burden decreases. Table 7 shows the results using equations (1) and (2). Panel A demonstrates the year-specific regression results, where year 98 is the enforcement year of the law. Before the implementation (year 97), the coefficient on retained earnings (coeff. = 0.48, t = 0.48) is much lower than that of contributed capital (coeff. = 1.10, t = 3.98). The coefficient on retained earnings increases substantially from 0.48 to 2.35 (t = 2.85) in 1998, which is the implementation year of the integrated system. The coefficient is still higher in 1999 (coeff. = 1.60, t = 1.21) than in 1997, although not significant and lower than that in 1998. The changes in the coefficient (i.e., an increase followed by a decrease) corresponds to the adoption of the integrated income tax system in 1998 and the subsequent 10% charge on undistributed earnings in 1999.
Table 7: Regression of Price on (Nominal and Weighted) Contributed Capital, Retained Earnings, and Net Income for Taiwanese Sample
Panel A Regression by year
Pit= β0+ β1CCit+ β2REit+ β3NIit+ εit(1)
Year β0 β1 β2 β3 Adj. R2 N
97 0.95 1.10*** 0.48 15.20*** 0.66 319
(0.23) (3.98) (0.48) (11.71)
98 -2.73 0.85*** 2.35*** 14.47*** 0.71 297
(-0.73) (3.28) (2.85) (12.24)
99 -21.39*** 1.91*** 1.60 18.31*** 0.55 343
(-3.51) (4.24) (1.21) (9.54) Panel B Regression by tax regimes
Pit= α0+ α1WCCit+ α2WREit+ α3WNIit +εit(2)
Year α0 α1 α2 α3 Adj. R2 N
82-97 2.19 1.88*** 5.82*** 4.27*** 0.31 2,266
(0.96) (11.13) (17.17) (11.20)
98 -6.39 1.46*** 10.19*** 3.85*** 0.60 297
(-1.49) (4.58) (15.11) (4.26)
99-01 -15.73*** 1.85*** 9.28*** 2.47*** 0.46 996
(-5.54) (8.33) (18.64) (3.70) Note:
1. T-statistics are in parentheses. *, **, and *** represent significance levels at 10%, 5%, and
1%, respectively.
2. Pit is the fiscal year-end price per share, CCit is the end-of-year contributed capital per share, REit is the end-of-year retained earnings per share, and NIit is net income per share for the period, for firm i at period t.
3. = 1− ∙ , = 1− ∙ , and = ∙ ,
where r is the cost of capital (set at 12%), R = 1+r, and is the time series persistence of residual income.
4. Year 98 is the enforcement year of the integrated income tax system, and year 99 is the first year of the additional 10% charge onundistributed retained earnings.
4.3 The Relationship between the Coefficients on Contributed Capital and Retained Earnings
However, they also find that the coefficients on retained earnings are higher than those of contributed capital in both periods. We observe the same pattern in Panel B of Table 7 using the Taiwanese data, although in Panel A we do find that the coefficients on retained earnings are lower than that of contributed capital in 1997 and 1999. Compared with Harris and Kemsley (1999), Dhaliwal et al. (2003), and Hanlon et al. (2003), which examine TRA 86, the result in Table 7 is consistent in the aspect that the coefficient on retained earnings moves in the direction that corresponds to tax rate changes. However, in the aspect of contributed capital, the results are mixed and subject to model specifications. Over all, the result in Table 7 supports the argument in Hanlon et al. (2003) that the empirical model based on Ohlson (1995) should be carefully used when examining such an effect.
5. Conclusion
This paper re-examines the tax capitalization effect by constructing hypotheses about integrated tax system to further study how dividend tax affects the weights on contributed capital and retained earnings in firm valuation. The full dividend capitalization literature started by Harris and Kemsley (1999) takes on the view that retained earnings are valued less than contributed capital because tax-paying investors fully capitalize future dividend tax on retained earnings into share prices. Hanlon et al. (2003) question the findings of this series of studies by demonstrating how the conclusions made by Harris and Kemsley (1999) can be spuriously induced. Because of stronger theoretical support, in this paper we use two models from Hanlon et al. (2003) for empirical test.
However, the coefficient on contributed capital and its relationship with the coefficient on retained earnings are not consistent with the tax effect hypothesis, a finding similar to Hanlon et al. (2003). Overall, our results provide more support to the argument that caution should be exerted when applying the residual income valuation model to study dividend tax capitalization as the coefficients are sensitive to model specification.
Some limitations by research method may affect the results of this paper. For example, in this paper we use models derived from Hanlon et al. (2003). This model implies that under going-concern, all coefficients would be equal to the theoretical value of one minus future dividend tax rate. Yet in this paper it is often the case that the coefficients do not take on the theoretical value, probably due to the fact that we assume a fixed cost of capital (12%) and estimate the residual income persistence by 2-digit SIC code. Future research with better estimation methods may reduce potential measurement errors so that tax capitalization effect can be captured more effectively. In addition, as reported in this paper and prior studies, it appears that the models are more responsive to changes in tax rate, although the mechanism is still unclear and the relationship among coefficients are subject to different interpretations. As suggested by Hanlon et al. (2003), it may be more fruitful to adopt event study designs surrounding tax rate changes. Future research may be able to obtain more convincing results on tax capitalization using such designs.
Acknowledgements
We appreciate helpful comments from Sandra Chamberlain, Joy Begley, Tsing-Zai Wu, workshop participants at the University of British Columbia and participants at the 2004 Accounting Theory and Practice Conference on earlier drafts of this paper.
References
Collins, J., & Kemsley, D. (2000). Capital gains and dividend taxes in firm valuation: evidence of triple taxation. The Accounting Review, 75, 405-427.
Laws & Regulations Database of The Republic of China. (2013). Company Act. Available at: http://law.moj.gov.tw/Eng/LawClass/LawAll.aspx?PCode=J0080001.
Dhaliwal, D., Erickson, M., Frank, M., & Banyi, M. (2003). Are shareholder dividend taxes on corporate retained earnings impounded in equity prices? Additional evidence and analysis. Journal of Accounting and Economics, 35, 179-200.
Harris, T., & Kemsley, D. (1999). Dividend taxation in firm valuation: new evidence. Journal of Accounting Research, 37, 275-291.
Harris, T., Hubbard, R., & Kemsley, D. (2001). The share price effects of dividend taxes and tax imputation credits. Journal of Public Economics, 79, 569-596.
Ministry of Finance, Taiwan. (1998). Introduction of Integrated Income Tax System.
Kemsley, D. (2001a). Dividend tax capitalization: clarifications and responses to recent challenges. Yale SOM Working Paper No. AC-10, Available at SSRN:
http://ssrn.com/abstract=279199 or http://dx.doi.org/10.2139/ssrn.279199. Kemsley, D. (2001b). Dividend tax capitalization: Further thoughts, comments, and response
to Michelle Hanlon, James Myers, and Terry Shevlin. Yale SOM Working Paper No. AC-11. Available at SSRN:
http://ssrn.com/abstract=283997 or http://dx.doi.org/10.2139/ssrn.283997. Lasfer, M. (1995). Ex-day behavior: tax or short-term trading effects. The Journal of Finance,
50, 875-897.
Miller, M., & Scholes, M. (1978). Dividends and taxes. Journal of Financial Economics, 6, 333–364.
Ohlson, J. (1995). Earnings, book values, and dividends in equity valuation. Contemporary Accounting Research, 11, 661-687.
Poterba, J., & Summers, L. (1984). New evidence that taxes affect the valuation of dividends. The Journal of Finance, 39, 1397-1415.
Appendix
Integrated Income Tax System
The Integrated Income Tax System (ITS thereafter) combines corporate and personal income taxes. There are eight ways to combine the two taxes according to different levels of combination:
Table A-1: Approaches of Integrated Income Tax System
Level Approach Content
Firm Level Partnership approach Treat stockholders as partners. Earnings are taxed according to each stockholder’s share and personal tax rate, no matter earnings are distributed or not. No corporate income tax.
Dividend-paid deduction system
Total or part of distributed dividend can be deducted as
expense when computing corporate taxable income.
(Corporate income tax is similar to the tax on
undistributed earnings.) Dividends that stockholders get are taxable personal income.
Dividend-paid credit system
Certain portion of distributed dividend can be deducted
from the firm’s tax payable.
Split-rate system Different tax rates for undistributed and distributed earnings. (Low for distributed earnings, high for undistributed ones.)
Stockholders Level
Dividend-exemption system
Dividends that stockholders get are totally or partly
tax-exempt.
Dividend-credit system Certain portion of dividends obtained is deductible from
stockholders’ tax payable.
Imputation system Total or part of income tax at corporate level is deductible from personal income tax at shareholders level. A shareholder should
pay additional tax if his personal tax rate is higher than the deduction rate, and vise versa.
Both Levels Hybrid system A combination of any of the above methods at corporate and stockholders level.
Source: Introduction of Integrated Income Tax System, January 1998, Ministry of Finance, Taiwan.
When calculating A’s total tax payable, the dividend amount applied is $100,000, which includes $75,000 cash and a $25,000 tax credit. Assuming the $100,000 pre-tax dividend is subject to A’s marginal tax rate, A has to pay an additional amount of $15,000 if his tax rate is 40%, or he can get a refund of $19,000 if his tax rate is 6% (assuming the imputation system is adopted).
Marginal Tax Rate 40% 6%
Total dividends (pre-tax) $100,000 $100,000
Total tax payable $40,000 $6,000
Deduct: Corporate tax credit (25,000) (25,000)
Net tax payable (refundable) $15,000 $(19,000)
The following tables compare the results under the separate and imputation system. In both the high and low marginal personal tax rate cases (40% and 6%), the imputation system obviously lessens the stockholder’s tax burden. In the separate system, the 40% rate stockholder has to pay $55,000 for the $100,000 earnings that his firm earns (and thus he is subject to an actual tax rate of 55%), while in the integrated system the shareholder’s tax payable are $40,000 and $6,000 respectively, which is exactly the amount of $100,000 times the personal income tax rate ($100,000*40% = $40,000; $100,000*6% = $6,000).
Case 1: Marginal tax rate for the stockholder = 40%
Imputation System Separate System
Firm Level:
Income before income tax $100 $100
Corporate income tax $25 $25
Stockholders Level:
Dividend distributed10 $100 $75
Total tax payable (40%) 40 30
Deduct: Corporate tax credit 25 ___
Tax payable (refundable) 15 30
Total tax $40 $55
Case 2: Marginal tax rate for the stockholder = 6%
Imputation System Separate System
Firm Level:
Income before income tax $100 $100
Corporate income tax $25 $25
Stockholders Level:
Dividend distributed $100 $75
Total tax payable (6%) 6 4.5
Deduct: Corporate tax credit 25 ___
Tax payable (refundable) (19) 4.5
Total tax $6 $29.5
According to the above discussion, we can find that integrated income tax system is actually a tax cut in nature: it improves fairness in tax and decreases tax liability for shareholders of different tax rates.