IJPAR |Vol.8 | Issue 2 | Apr - Jun - 2019 Journal Home page: www.ijpar.com
Research article Open Access
Stability indicating validated HPLC method for determination of RP-HPLC
method development for Etofylline, Bromhexine hydrochloride and
salbutamol sulphate in bulk and pharmaceutical dosage form
Pilli.Iswarya
*, T.Pavani Priyanka, M. Surya Prabha, Dr. Ch. Babu Rao
Priyadarshini Institute of Pharmaceutical Education and Research Guntur, Andhra Pradesh
*Corresponding Author:Pilli.Iswarya Email: iswaryalaxman@gmail.com
ABSTRACT
A simple, rapid, precise and accurate stability indicating Reverse phase high performance liquid chromatography method was developed and validated for the quantitative determination of ET, BH and SS in bulk drug and Pharmaceutical dosage form. Separation was achieved on a ZORBAX CN 250X 4.6MM, 0.5µm, particle size column at a detection wavelength of 225 nm for all compounds, using a mobile phase consists of 0.1%OPA: METHANOL 800:500 in a Isocratic elution mode at a flow rate of 1.0ml per min. The ET peak was observed at 3.9min with peak area 93286, tailing factor 1.482 and resolution 3.647. BH peak was observed at 8.023min, with peak area 1453626, tailing factor 2.189 and resolution 5.943. SS peak was observed at 2.129 min with peak area 1875999, tailing factor 2.436. Because of the satisfactory results, less retention time, this trial was optimized. An attempt has been made to develop a new stability indicating validated RP-HPLC method for the simultaneous estimation of ET, BH and SS & methods for estimation of ET, BH and SS in bulk and in dosage form. The proposed RP-HPLC, UV-Spectrophotometric methods were suitable methods for the determination of Etofylline, Bromhexine hydrochloride, and salbutamol sulphate in combination dosage forms. All the parameters of developed methods met the criteria of ICH guidelines for method validation.
Keywords:
Etofylline, Bromhexine Hydrochloride, Salbutamol Sulphate, Method validation, ICH GuidelinesINTRODUCTION
Etofylline (ET), chemically known as 7-(2-hydroxyethyl)-1, 3-dimethyl-3, 7-dihydro-1, 4-purine-2, 6-dione, is a xanthine bronchodilator used for the treatment of respiratory diseases and asthma in combination with SS [1].
Bromhexine hydrochloride (BH), chemically known as N-(2-amino-3, 5-dibromobenzyl)-N methyl cychlohexanamine hydrochloride, is an expectorant use in the treatment of various respiratory disorders.
Salbutamol sulphate (SS), chemically known as bis [(1RS)-2-[(1, 1-dimethylethyl) amino]-1-[4-hydroxy3-(hydroxymethyl) phenyl] ethanol] sulphate, is beta adenocepter agonist. It is used for
the relief of bronchospasm in condition such as asthma and chronic obstructive pulmonary disease. The smooth muscles are relaxed by the increase in the intracellular cyclic adenosine monophosphate.
SS, BH and ET are official in BP. Official methods involve determination of SS, BH and ET using Potentiometry. SS, BH and ET as component of a multi ingredient formulation and has been reported to be estimated by some spectroscopic methods either single or in combination simultaneously. One spectroscopic method has been reported for the determination of SS along with BH and ET in combined dosage forms. The tertiary combination SS, BH and ET, is not yet official in any pharmacopoeia. Therefore simple, rapid, economical and reliable UV spectroscopic method for estimation of these drugs in mixture seemed to be necessary. All the analytical and validation procedures followed in the present study were as per ICH guidelines.
Literature survey reveals information that some of the methods like UV-visible spectrophotometry [1-3], HPLC [4-14], Methods for all the individual drugs. But yet not a single method has been reported for all the drugs in a single combination. This study was designed to develop a simple and reliable method to quantitative ET, BH and SS in a relatively short time with high sensitivity. Therefore, this study focused on the development of simple and rapid RP-HPLC method which can be employed for the routine analysis of ET, BH and SS in bulk drug and formulation and the method was validated as per ICH guidelines.
MATERIALS AND METHODS
Instrumentation
Reverse phase high performance liquid chromatography equipped with Auto Sampler and UV detector. RP-HPLC experiments were carried out on Waters 717plus- Empower software, with waters UV detector using Auto sampler. Data collections and processing was done using EMPOWER software. The analytical column used for the separation was ZORBAX CN 250X 4.6MM, 0.5µM particle size column, Analytical balance (Denver), pH meter (Eutech), Sonicator (Unichrome) [9-11].
Chemicals and reagents
SS, BH and ET were supplied as gift sample from PVS Laboratories Limited and Koch organics in vijayawada and marketed formulation of Eto-salbetol-10 (Batch Number–BTK0017, Kare Labs Pvt. Ltd., Goa, India) was procured from the local drug store, Moga, Punjab. Acetonitrile (AR Grade; MERCK), orthophospharic acid (HPLC grade, MERCK), methanol and HPLC grade water were used for the entire study [2-5].
Chromatographic condition
Use suitable High Performance Liquid Chromatograph equipped with UV-visible detector. The chromatographic column used was ZORBAX CN 250X 4.6MM, 0.5µM particle size. The mobile phase consists of 0.1%OPA: METHANOL 800:500 at a flow rate of 1.0mL/min at an ambient temperature and the chromatograms were monitored at a detector wavelength of 225 nm using UV-Detector. The injection volume was 20µL Retention time of Salbutamol is about 2 to 3.5 min. Retention time of Etofylline is about 3.7 to 4 min. Retention time of Bromhexine is about 8 to 9 min [6-8].
PREPARATION OF STANDARD &
SAMPLE SOLUTIONS
P
reparation of standard solution
Weigh accurately about 20 mg of salbutamol, 50mg of ethofylline and 80mg of Bromhexine working standards into a 50 mL volumetric flask. Add 30 mL of diluent, sonicate to dissolve and dilute to volume with diluent. Further dilute 5mL of Solution to 50 mL with the diluent.
Preparation of Sample Solution
Weigh 1 tablet and taken into a 50 mL volumetric flask. Add 30 mL of diluent, sonicate to dissolve and dilute to volume diluent.
Preparation-1
Preparation-2
Further dilute 2.5 mL to 100 mL with the diluent for Etofylline. Filter through 0.45μ Nylon syringe filter.
PROCEDURE
Inject 20µL of Standard preparation five times and Sample preparations-1& 2 in the Chromatograph. Record the chromatograms and measure the peak responses for Salbutamol & Bromhexine from Preparation-1 & etofylline from Preparation-2. The System suitability parameters should be met. From the peak responses, calculate the content of Salbutamol, Bromhexine & Etofylline in the sample.
Method development
To saturate the column, the mobile phase was pumped for about 30 minutes thereby to get the base line corrected. The standard calibration line was constructed for drug. A series of aliquots were prepared from the above stock solution using diluent to get the concentration 5-30 μg/mL for ET,
10-40μg/mL for BH and 10-120 μg/mL for SS. Each concentration 6 replicates were injected in to chromatographic system. Each time peak area and retention time were recorded separately for the drugs. Calibration curves were constructed by taking average peak area on Y-axis and concentration on X-axis. From the calibration curve regression equation were calculated, this regression equation were used to calculate drug content in formulation as shown in the (figure 9-13).
Assay of Sample Solution
Crush 20 tablets into a fine powder. Transfer a powder equivalent to 100mg of ETO- Salbetol into 200ml volumetric flask, add 150 mL of diluent & sonicate for 15 min with continuous vigorous shaking at a temp NMT 20°C. Dissolve and dilute to volume diluent. Filter through 0.45μ Nylon syringe filter. This solution was estimated by above developed method. The assay procedure was repeated 6 times (n=6) the drug content was estimated using above calculated regression equation; the results of tablet dosage form are shown in the (Table-3).
%Assay of Formulation
Assay calculations
For Salbutamol,
AT Std wt (mg) 5ml 50ml (P) % Potency of Std = --- x --- x --- x --- x --- x 100 AS 50ml 50ml wt taken 100 For Bromhexine,
AT Std wt (mg) 5ml 50ml (P) % Potency of Std = --- x --- x --- x --- x --- x 100 AS 50ml 50ml wt taken 100
For Etofylline,
AT Std wt (mg) 5ml 50ml 100 (P) % Potency of Std = --- x --- x --- x --- x ---x--- x 100 AS 50ml 50ml wt taken 2.5 100
Assay (%): Assay (mg/tab) x 100/LC Where,
AT= Average area count of SS, ET & BH peaks in the chromatogram of sample solution.
AS= Average area count of SS, ET & BH peaks in the chromatogram of standard solution.
P=Percent potency of SS, ET & BH working standard on as is basis.
LC= Label claim of ET, BH and SS in mg.
Method validation
The analytical method was validated for various parameters as per ICH guidelines.
System suitability parameters
plate number(N), tailing factor(K), resolution, relative retention time and peak asymmetry of samples. (Table-2)
Specificity and selectivity
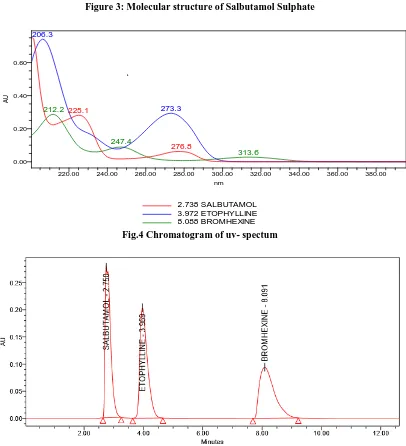
Specificity is the degree to which the procedure applies to a single analyte and is checked in each analysis by examining blank matrix samples for any interfering peaks. The HPLC chromatograms recorded for the drug matrix showed almost no interfering peaks with in retention time ranges. Fig.4, 5 & 6 show the chromatogram for ET, BH and SS. The figures shows that the selected drugs were cleanly separated. Thus, the RP-HPLC method proposed in this study was selective.[12-14].
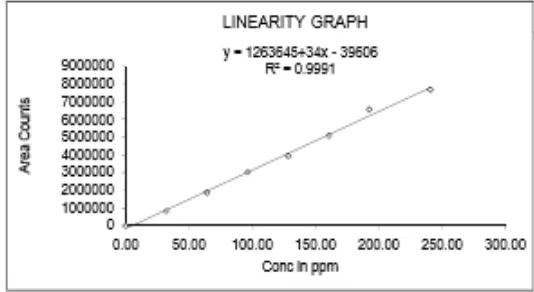
Linearity
Linearity of an analytical method is its ability to elicit the test results that are directly, or by well-defined mathematical transformation, proportional to the concentration of analyte in sample within a given range. Linear correlation was obtained between peak area Vs concentration of ET, BH and SS were in the range of 20 – 150µg/mL, 32 – 240and 8 – 58µg/mL. The linearity of the calibration curve was validated by the high value of correlation co-efficient of regression equation. The solution was injected in six replicates. The average peak area versus concentration data of drug was treated by least squares linear regression analysis and the results obtained as shown in Table-4
Accuracy
Accuracy is expressed as the closeness of the results from standard samples to that of the actual known amounts. Accuracy was evaluated in three replicates, at three different concentration levels equivalent to 50%, 100%, and 150% of the target concentration of active ingredient, by adding a known amount of each of the Standard to a pre-analysed concentration of drugs (ET, BH and SS) and calculating the % of recovery, and the results obtained were shown in Table-5(5a-5c).
Precision
Precision is the degree of repeatability of an analytical method under normal operation conditions.
Method precision was achieved by repeating the same procedure of preparation solution six times and injected. The % RSD was calculated.
System precision is checked by using standard substance to ensure that the analytical system is working properly. In this peak area and % of drug of six determinations is measured and % RSD was calculated. The results are shown in the Table-6(6a, 6b).
Ruggedness and robustness
Ruggedness of the method was determined by carrying out the analysis by two different analysts and the respective peak areas were noted. The result was indicated by % RSD (Table 7).
Robustness of the method was determined by carrying out the analysis at two different PH of mobile phase (i.e. 7.0±0.5) and three different flow rates (i.e. 1±0.2 mL/min)
The high % RSD values of robustness and for ET, BH and SS with change in flow rate indicates that the method is not robust for change in flow rate.
The low % RSD values of robustness and for ET, BH and SS with change in PH reveal that the proposed method is robust (Table 8a-8c).
Limit of detection (LOD) and limit of
quantification (LOQ)
The limit of detection (LOD) limit of quantification (LOQ) of the drug carry was calculated using the following equation as per international conference harmonization (ICH) guidelines.
LOD = 3.3 X σ /S LOQ = 10 X σ /S
LOD for ET was found to be 0.015µg/mL and LOQ for ET was found to be 0.0495µg/mL, LOD for BH was found to be 0.2000µg/mL and LOQ for BH was found to be 0.660µg/mL and LOD & LOQ for SS was found to be 0.1500µg/mL and0.4950 µg/mL (Table 9).
Stability study
Degradation study
The International Conference on Harmonization (ICH) guideline entitled stability testing of new drug substances and products requires that stress testing be carried out to elucidate the inherent stability characteristics of the active substance. The aim of this work was to perform the stress degradation studies on the ET, BH and SS using the proposed method (Table 11).
RESULTS AND DISCUSSION
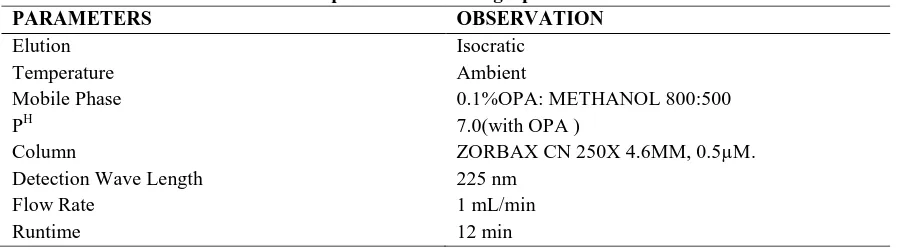
The conditions tested for method development indicates that all the system suitability parameters according to ICH guidelines were achieved by using ZORBAX CN 250X 4.6MM, 0.5µm, particle size column using mobile phase 0.1%OPA: METHANOL 800:500 in a Isocratic elution mode with a flow rate of 1 mL per min throughout the Isocratic program with a detection wavelength of 225 nm for all the compounds with an injection volume of 20 L.
To validate the RP-HPLC method, a series of tests were made using the most promising conditions. A calibration curve was made and
concentration examined within the detection range of 30 μg/mL for Etofylline, 10-40 μg/mL for Bromhexine Hydrochloride, 10-120 μg/mL for Salbutamol Sulphate and correlation coefficient was found to be 0.999 for all the compounds respectively. The precision (expressed as the relative standard deviation RSD) was determined for ET, BH and SS for repeated analysis and the values are presented in Table
The assay values obtained by proposed method and recovery experiment values obtained were performed by adding different amounts placebo to preanalysed concentration summarized.
The stability of sample was checked by forced degradation in different conditions and % of degradation was calculated. The peak purity of the analyte was passed in all conditions (purity angle should be less than the threshold value). The results as shown in Table-9 indicate that any other impurity is not merging with the main peak. The analyte sample solution was stable up to 24hrs at refrigerated conditions. A method was developed for the determination of ET, BH and SS in Tablets which is rapid, stable & specific. The results indicate that the described method can be used for quantitative analysis of the compounds.
Table 1: Optimized chromatographic conditions
PARAMETERS OBSERVATION
Elution Isocratic
Temperature Ambient
Mobile Phase 0.1%OPA: METHANOL 800:500
PH 7.0(with OPA )
Column ZORBAX CN 250X 4.6MM, 0.5µM.
Detection Wave Length 225 nm
Flow Rate 1 mL/min
Runtime 12 min
Table 2: Results of system suitability parameters for ET, BH and SS
S.NO Name Retention time Peak area Tailing factor Resolution
1 ET 3.909 93286 1.482 3.647
2 BH 8.091 1453626 2.189 5.943
3 SS 2.150 1875999 2.436 -
Table 3: Results of tablet dosage form Drug Avg std
area(n=6) Avg sample area(n=6) Avg wt of tab. (mg) Std wt (mg) Sample wt(mg) Lable amount(mg) Std purity Amount found (mg) % assay
ET 3579795 3543324 298.4 50 298.5 200 100 197.8 98.9
SS 1524714 1422330 298.4 20.3 298.5 2 100 1.894 94.7
Table 4: Linearity results of ET, BH and SS
S.NO Etofylline Bromhexine Salbutamol
Conc.(µg/mL) Peak area Conc.(µg/mL) Peak area Conc.(µg/mL) Peak area
1 0.00 0 0.00 0 0.00 0
2 20.08 707589 7.76 647256 32.08 840177
3 40.16 1453626 15.52 932826 64.16 1875999
4 60.24 2169899 23.28 1207243 96.24 3039940
5 80.32 2894003 31.04 1503585 128.32 3946200
6 100.40 3585006 38.80 1747360 160.40 5087562
7 120.48 4377428 46.56 2036610 192.48 657599
8 150.6 5373100 58.20 2447016 240.60 7681175
Regression equation y = 1263645+34x-39606 y = 1263645+34x-39606 y = 1263645+34x-39606
Slope 35882.26 33081.54 35582.56
Intercept 3244.06 149842.30 378922.48
R² 0.99990 0.9991 0.99987
Table 5: Accuracy results for ET, BH and SS Table 5 a: accuracy results of ET by RP-HPLC method %Accuracy Level Amount of API Added (mg) Actual API Added (mg) Area Counts Amount Recovered(mg) % Recovery Mean Recovery % RSD
50 % 7.60 7.60 1799146 7.52 98.9 99.6 0.6
7.60 7.60 1821030 7.61 100.1
7.60 7.60 1811770 7.57 99.6
100 % 15.20 15.20 3653208 15.27 100.5 100.6 0.230
15.20 15.20 3653538 15.27 100.5
15.20 15.20 3668498 15.33 100.9
150% 22.80 22.80 5441262 22.74 99.7 100.0 0.340
22.80 22.80 5449976 22.78 99.9
22.80 22.80 5477481 22.89 100.4
Table 5 B: Accuracy Results Of BH by RP-HPLC Method %Accuracy Level Amount of API Added (mg) Actual API Added (mg) Area Counts Amount Recovered (mg) % Recovery Mean Recovery % RSD
50 % 4.18 4.18 2466833 4.13 98.9 98.8 0.740
4.18 4.18 2446893 4.09 98.0
4.18 4.18 2479235 4.15 99.4
100 % 8.35 8.35 5126629 8.57 102.6 102.7 0.080
8.35 8.35 5127581 8.58 102.8
- - - - -
150% 12.53 12.53 7736619 12.94 103.3 103.7 0.290
12.53 12.53 7771142 13 103.8
12.53 12.53 7780965 13.01 103.9
(mg) (mg)
50 % 1.12 1.12 1039848 1.12 100.0 100.0 0.890
1.12 1.12 1021932 1.11 99.1
1.12 1.12 1042929 1.13 100.9
100 % 1.96 1.96 1772664 1.92 98.0 97.1 1.090
1.96 1.96 1736091 1.88 95.9
1.96 1.96 1767358 1.91 97.4
150% 2.58 2.58 2423995 2.62 101.7 102.7 0.950
2.58 2.58 2446217 2.65 102.9
2.58 2.58 2467889 2.67 103.6
Table 6: Precision results for ET, BH and SS Table 6A: method precession for ET, BH and SS
S.NO Method Precision Etofylline Bromhexine Salbutamol
1 MP 1 98.9 101 96.8
2 MP 2 99.6 102.4 96.9
3 MP 3 99.4 101.3 96.9
4 MP 4 99.7 100.9 97.0
5 MP 5 99.6 101.9 96.5
6 MP 6 101.7 100.1 96.5
Mean 99.8 101.3 96.8
SD 0.966 0.807 0.216
% RSD 0.97 0.8 0.22
Table 6 B: System Precession for ET, BH and SS
S.NO System Precision Etofylline Bromhexine Salbutamol
1 Injection- 1 3682459 5152104 1776803
2 Injection- 2 3672481 5191451 1766961
3 Injection- 3 3640104 5074564 1778513
4 Injection- 4 3728661 5298419 1796981
5 Injection- 5 3759092 5260884 1815952
6 Injection- 6 3642534 5070548 1798291
Mean 3687555 5174662 1788917
% RSD 1.291 1.82 1.006
Table 7: Ruggedness studies for ET, BH AND SS
S.NO Parameter ET BH SS Limit
1 Mean 3717583 5602640 1539425 NMT 2.0%
2 %RSD 1.919 2.706 1.416
Table 8: Robustness studies for ET, BH AND SS (a) Robustness results of etofylline BY RP-HPLC
Parameter ET
Retention time Peak area Resolution Tailing Plate count % RSD
Method Precision - Control 4.014 3588749 5.914 1.482 1117 0.397
Wave Length Plus 4.014 3043313 6.048 1.481 1117 0.433
Wave Length Minus 4.014 5301188 5.852 1.480 1112 0.450
Organic Plus 4.293 3728567 6.250 1.235 1936 0.169
Organic Minus 4.538 3901894 7.248 1.238 1898 1.480
Flow Minus 5.019 4235088 7.044 1.233 1859 0.325
(b) Robustness results of bromhexine hydrochloride by RP-HPLC
Parameter BH
Retention time Peak area Resolution Tailing Plate count % RSD
Method Precision - Control 8.432 5107093 3.647 2.147 1213 0.284
Wave Length Plus 8.432 3313041 3.632 2.021 1273 1.047
Wave Length Minus 8.432 9543571 3.609 2.185 1191 0.360
Organic Plus 8.389 5284248 4.470 1.993 1373 0.710
Organic Minus 10.124 5448261 5.292 2.024 1333 0.211
Flow Plus 3.728 4709398 3.226 2.220 1087 1.049
Flow Minus 10.970 6017536 5.293 1.852 1319 1.258
(b) Robustness results of salbutamol sulphate by RP-HPLC (c)
Parameter SS
Retention time Peak area Resolution Tailing Plate count % RSD
Method Precision - Control 2.741 1522614 - 2.436 3903 1.359
Wave Length Plus 2.742 1286940 - 2.436 3750 1.323
Wave Length Minus 2.742 1437613 - 2.449 3654 1.329
Organic Plus 2.976 1597196 - 1.950 4605 0.085
Organic Minus 3.025 1561146 - 2.241 9743 0.192
Flow Plus 2.608 1380261 - 2.769 2097 0.859
Flow Minus 3.351 1740142 - 2.021 9909 0.534
Table 9: Sensitivity parameters (LOD & LOQ) by RP-HPLC
parameter ET BH SS
µg/mL Area µg/mL Area µg/mL Area LOD 0.0150 10398 0.2000 242399 0.1500 103989 LOQ 0.0495 31195 0.6600 727198 0.4950 311967
Table 10: Results of stability study (a) Stability study results of etofylline Time period (hours) Etofylline
Retention Time Peak Area Tailing Factor Plate Count Resolution
6 4.340 3888396 1.221 1686 4.338
12 4.350 3804225 1.264 1804 4.449
18 4.362 3811135 1.253 1785 4.570
24 4.366 3801338 1.217 1708 4.341
(b) Stability study results of bromhexine hydrochloride Time period (hours) Bromhexine Hydrochloride
Retention Time Peak Area Tailing Factor Plate Count Resolution
6 8.673 5501665 1.925 1248 6.171
12 8.719 5490052 1.763 1301 6.208
18 8.784 5479477 1.711 1246 6.207
24 8.821 5442238 1.654 1282 6.337
(c) Stability study results of salbutamol sulphate Time period (hours) Salbutamol Sulphate
6 3.007 1570954 1.887 4868 5.067
12 3.020 1544009 1.921 5706 5.089
18 3.027 1558372 1.894 5481 5.272
24 3.029 1579345 1.974 4784 5.345
Table 11: degradation study results of ET, BH AND SS Degradation sample Etofylline
Mean area (n=6) % label claim % degradation
ACID 375.5 4389776 97.4 2.4
ALKALI 330.4 3866004 97.5 2.3
PEROXIDE 330.7 3903178 98.4 1.4
REDUCTION 330.9 3907967 98.4 1.4
sHEAT 300.5 3560670 98.8 1
HYDROLYSIS 300.1 3585850 99.6 0.2
PHOTO 307.9 3661702 99.1 0.7
THERMAL 300.4 3536997 98.1 1.7
Degradation sample Bromhexine Hydrochloride
Mean area (n=6) % label claim % degradation
ACID 375.5 119010 74.5 26.8
ALKALI 330.4 87164 62 39.3
PEROXIDE 330.7 90354 64.2 37.1
REDUCTION 330.9 93458 66.4 34.9
HEAT 300.5 74762 58.5 42.8
HYDROLYSIS 300.1 100459 78.7 22.6
PHOTO 307.9 118892 90.7 10.6
THERMAL 300.4 65937 51.6 49.7
Degradation sample Salbutamol Sulphate
Mean area (n=6) % label claim % degradation
ACID 375.5 176358 9.3 86.4
ALKALI 330.4 161992 9.7 86
PEROXIDE 330.7 210071 12.6 83.1
REDUCTION 330.9 171739 10.3 85.4
HEAT 300.5 170993 0 95.7
HYDROLYSIS 300.1 167771 11.1 84.6
PHOTO 307.9 171335 11.1 84.6
THERMAL 300.4 169180 11.2 84.5
Figure 2: Molecular structure of Bromhexine Hydrochloride
Figure 3: Molecular structure of Salbutamol Sulphate
Fig.4 Chromatogram of uv- spectum
Fig.5 Chromatogram of standard 2.738 SALBUTAMOL 3.972 ETOPHYLLINE 8.088 BROMHEXINE
212.2
247.4
313.6
206.3
273.3
225.1
276.8
AU
0.00 0.20 0.40 0.60
nm
Fig.6 Chromatogram of sample
Calibration Curve for ET, BH and SS
Calibration Curve of Etofylline
Figure 7: Calibration Curve of Etofylline at 225 nm.
Calibration Curve of Bromhexine Hydrochloride
Calibration Curve of Salbutamol sulphate
Figure 9: Linearity of Salbutamol sulphate at 225 nm.
CONCLUSION
The proposed RP-HPLC,
UV-Spectrophotometric methods were suitable methods for the determination of etofylline, Bromhexine hydrochloride, and salbutamol sulfate in combination dosage forms. All the parameters of developed methods met the criteria of ICH guidelines for method validation.
The developed HPLC method has the
following advantages
No tedious extraction procedures were involved. These methods are also having an advantage than reported method of good resolution and with retention time.
The developed method has good recovery and sensitivity.
The run time required for recording chromatogram was below 8.0 mins.
Suitable for the analysis of raw materials and formulations.
Hence, the developed chromatographic method for etophylline, Bromhexine hydrochloride, and salbutamol sulfate are said to be rapid, simple, precise, accurate, specific and cost effective that can be effectively applied for the routine analysis.
ACKNOWLEDGMENT
Authors are very thankful to principal Dr. Ch. Babu Rao, Priyadarshini Institute of Pharmaceutical Education and Research, Guntur, Andhra Pradesh for providing the library facilities for literature survey to carryout entire study. The Authors also thankful to the PVS Laboratories Limited and Koch organics in Vijayawada for providing the pure drugs for the present work. Authors also thankful to cystron laboratory for providing RP-HPLC Instrument to carry out Research work.
REFERENCE
[1]. Baldwin DR, Sivardeen Z, Pavord ID, Knox AJ Comparison of the effects of salbutamol and adrenaline on airway smooth muscle contractility in vitro and on bronchial reactivity in vivo. Thorax 49, 1994, 1103-1108. [2]. Prakash YS, van der Heijden HF, Kannan MS, Sieck GC Effects of salbutamol on intracellular calcium
oscillations in porcine airway smooth muscle. J Appl Physiol (1985) 82, 1997, 1836-1843.
[3]. Bai Y, Sanderson MJ Airway smooth muscle relaxation results from a reduction in the frequency of Ca2+ oscillations induced by a cAMP-mediated inhibition of the IP3 receptor. Respir Res 7, 2006, 34.
[4]. British Pharmacopoeia Her Majestys Stationary Office, London, UK. 2009.
[5]. Santoro M, Dos Santos M, Magalhaes J Spectrophotometric determination of bromhexine hydrochloride in pharmaceutical preparations. Journal-Association of Official Analytical Chemists 67, 1983, 532-534.
pharmaceuticals. Analyst 112, 1987, 871-874.
[7]. Zarapkar SS, Rele RV, Doshi VJ Simple spectrophotometric methods for the estimation of bromhexine hydrochloride. Indian Drugs 26, 1988, 38-41.
[8]. Naidu N, Naidu D, Rajeswari C, Naidu P A simple spectrophotometric determination of salbutamol sulfate in pharmaceutical formulations. Acta chimica hungarica-models in chemistry 126, 1989, 821-824.
[9]. Talwar N, Singhai AK, Shakya AK, Saraf S, Jain NK Difference spectrophotometric determination of salbutamol sulphate in tablets. Indian Drugs 28, 1991, 244-245.
[10].Gala B, Gomez-Hens A, PerezBendito D Direct kinetic determination of bromhexine hydrochloride in pharmaceutical formulations. Analytical letters 26, 1993, 2607-2617.
[11].Lemus Gallego JM, Prez Arroyo J Spectrophotometric determination of hydrocortisone, nystatin and oxytetracycline in synthetic and pharmaceutical preparations based on various univariate and multivariate methods. Analytica Chimica Acta 460, 2002, 85-97.
[12].Dave HN, Mashru RC, Thakkar AR Simultaneous determination of salbutamol sulphate, bromhexine hydrochloride and etofylline in pharmaceutical formulations with the use of four rapid derivative spectrophotometric methods. Anal Chim Acta 597, 2007, 113-120.
[13].ICH International Conference on Harmonization, Q2B Validation of Analytical Procedures: Methodology, Consensus Guidelines, ICH Harmonized Tripartite Guidelines 1996.