Journal of Biological Sciences and Medicine
Available online at www.jbscim.comISSN: 2455-5266
6
Research Article
Open Access
Association of IL-1RN polymorphism with diabetes type 2 in
Central Indian Population
Udita Singh
1, Pallavi Indurkar
2, Arti Saxena
3, Pankaj Mishra
4and Arvind Kumar
Tripathi
1*1Centre for Biotechnology Studies, A.P.S. University Rewa, Madhya Pradesh, India-486001
2Department of Medicine, Shyam Shah Medical College Rewa, Madhya Pradesh, India-486001
3Department of Zoology, Govt. Science College Rewa, Madhya Pradesh, India-486001
4School of Environmental Biology, A.P.S. University Rewa, Madhya Pradesh, India-486001
*Corresponding author: arvindt2584@gmail.com
ARTICLE INFO ABSTRACT
Article History: Received 28 August 2016
Accepted
26 September 2016
Available online 30 September 2016
The interleukin-1 receptor antagonist (IL-1RA) is a protein encoded by the IL1RN gene in human. In present study, anti-inflammatory gene; IL1RN has been studied for their association with diabetes type 2. A number of 190 diabetics and 210 healthy controls of central India were recruited for this study and anthropometric and lifestyle data were collected during sampling. Genetic polymorphism study of IL-1β gene was undertaken using PCR-RFLP, meanwhile IL-4 polymorphism was investigated using PCR-VNTR (Variable number of tandem repeats) analysis. Genotype, allele frequencies and carriage rates of IL-1β and IL-4 polymorphisms were recorded during this study. Diabetic patients had higher levels of fasting plasma glucose (P<0.0001), HbA1c (P<0.0001) and Post prandial glucose (P<0.0001) compared to control subjects. Nominal difference was observed for LDL-C (P=0.0462) and triglyceride (P=0.0024). Diabetic patients had higher levels of weight of women (P=0.0024), men (P=0.0157) and Body Mass Index (BMI) of women (P=0.0388), Waist Hip Ratio (WHR) in women (P<0.0001) and WHR in men (P=0.0147). Our findings suggested carriage of genotype I/II and II/II (p=0.0002; OR=2.194, 95% CI 1.455- 3.310 and p=0.0772; OR=1.80, 95% CI 0.9434- 3.434 respectively) were strongly associated with diabetes susceptibility.
Key words:
Interleukin 1 Receptor Antagonist; Diabetes type 2; Polymorphism; Anti-inflammatory
Copyright: © 2016 Singh et al. This is an open access article distributed under the terms of the Creative Commons Attribution License, which permits unrestricted use, distribution, and reproduction in any medium, provided the original author and source are credited.
Introduction
Diabetes is a metabolic disorder characterized by hyperglycemia (excessive amount of glucose) and associated with abnormal lipid and protein metabolism. It has now become global health problem and now days it has largest prevalence worldwide. Type 2 diabetes (T2D) is a complex metabolic disorder resulting from the interplay of both genetic and environmental factors like lifestyle and food habits (McCarthy and Froguel
7
immune and inflammatory responses. This gene and five other closely related cytokine genes form a gene cluster spanning approximately 400 kb on chromosome 2. A polymorphism of this gene is reported to be associated with increased risk of osteoporotic fractures and gastric cancer (Patel et al. 2015).
Diseases associated with IL1RN include Interleukin 1 Receptor Antagonist Deficiency and Microvascular Complications of Diabetes 4. Among its related pathways are Toll-Like Receptor Signaling Pathways and Interleukin-1 signaling. GO annotations related to this gene include cytokine activity and interleukin-1 receptor antagonist activity. An important paralog of this gene is IL37. Several alternatively spliced transcript variants encoding distinct isoforms have been reported. IL1RN (IL-1RA) which is competitive natural inhibitor of IL1β and the protein produced by IL1RN has been seen to improve the condition of hyperglycemia (Clau et
al. 2007). An eighty-six base VNTR
polymorphism has been found in IL4 gene and two different studies in many studies has been done and indicates that VNTR polymorphism of IL1RN is associated with diabetes type 2.
Material and Methods
Study population
The study population consisted of 400 unrelated subjects comprising of 190 T2D patients and 210 ethnically matched controls of central Indian population were included in this study. In this region people from all the religions lives, but most people belong to Hindu religion in this region.
Anthropometry
Height and Weight were measured in light clothes and without shoes in standing position as per standard guidelines. Body Mass Index (BMI) was calculated as weight in kilograms divided by height in meters squared. Waist circumference was measured in standing position midway between iliac crest and lower costal margin and
hip circumference was measured at its maximum waist to hip ratio (WHR) was calculated using waist and hip circumferences. Systolic and diastolic blood pressures were measured twice in the right arm in sitting position after resting for at
least 5 minute using a standard
sphygmomanometer and the average of the two reading was used.
Biochemical Analysis
Biochemical parameters related to type 2 diabetes were estimated for both cases and controls subjects. Measurement of Serum levels of Total cholesterol (TC), Triglycerides (TG), HbA1c, High density lipoprotein-cholesterol (HDL-C), Low density lipoprotein-cholesterol (LDL-C), Urea, Uric acid, C-reactive protein (CRP) and Creatinine were measured based on spectrophotometric method using automated clinical chemistry analyzer Cobas Integra 400 plus (Roche Diagnostics, Mannheim, Germany).
DNA isolation
Genomic DNA was extracted from whole blood by the modification of salting out procedure described by Miller and coworkers (Miller et al. 1988).
Detection of interleukin-1 receptor antagonist (IL-1RA) 86 bp VNTR DNA polymorphism
The intron 2 of IL-1Ra gene contains a VNTR of 86 bp length of DNA. This region was amplified using PCR. The alleles were designated according to their respective base pair size taking the 86 bp core repeat sequence of IL-1Ra VNTR marker from literature (Tarlow et al. 1993). Five alleles were observed corresponding to the length variation in different copy numbers of the 86 bp sequence. They were designated as follows: Allele 1(410 bp, four repeats of 86 bp sequence), Allele 2 (240 bp, two repeats of 86 bp sequence), Allele 3 (500bp, five repeats of 86 bp sequence), Allele 4 (325 bp, three repeats of 86 bp sequence), Allele 5 (595 bp, six repeats of 86 bp sequence).
8
The oligonucleotides (primers) used for
sequences flanking of IL-1RA region described Tarlow JK et al. 1993. They are as follows:
Forward primer- 5’ CTCAGCAACACTCCTAT 3’
Reverse primer- 5’ TCCTGGTCTGCAGGTAAT 3’
PCR Mix
25 μl of each PCR reaction mixture contained 2-5 μl template DNA (final concentration 100-200 ng/ μl), 2.5 μl of 10X Taq polymerase buffer (10 mM Tris HCl pH 8.8, 50 mM KCl, 1.5 mM MgCl2, 0.01% gelatin, 0.005% Tween-20, 0.005% NP-40; final concentration 1X; Genetix Biotech Asia Pvt. Ltd.,India), 1 μl of 10 mM dNTPs (Banglore Genei, Bangalore, India), 1 μl of 10 pm/μl of forward and reverse primers specific for IL-1Ra gene, 0.3 μl of 5U/ μl of Taq DNA polymerase (final concentration 1.5U; Banglore Genei, Bangalore, India ) and sterile water to set up the volume of reaction mixture to 25 μl.
Thermal Profile
Thermal profile used for the amplification of desired segment of gene was as follows: Initial denaturation at 95˚C for 5 min and 30 cycles of denaturation at 94˚C for 1 min, annealing at 58˚C for 1 min and extention at 72˚C for 1 min, followed by final extension at 72˚C for 5 min. PCR products were separated on 2% agarose gel (2% w/v, Sigma) using a 100 bp molecular weight (MW) marker to confirm different PCR product sizes indicating presence of different alleles of VNTR.
Genotyping
15 possible genotypes were expected depending upon the PCR pattern. They are as follows : Genotype 1/1(410 bp), genotype 1/2 (410 bp and 240 bp), Genotype 1/3 (410 bp and 500 bp), Genotype 1/4 (410 bp and 325 bp), Genotype 1/5 (410 bp and 595 bp), Genotype 2/2 (240 bp), Genotype 2/3 (240 bp and 500 bp), Genotype 2/4
( 240 bp and 325 bp), Genotype 2/5 (240 bp and 595 bp), Genotype 3/3 (500 bp), Genotype 3/4 (500 bp and 325 bp), Genotype 3/5 (500 bp and 595 bp), Genotype 4/4 (325 bp), Genotype 4/5 (325 bp and 595 bp), Genotype 5/5 (595 bp).
Results
Anthropometric
The descriptive data and comparison of anthropometric parameters of diabetic patients versus controls are presented in Table 1. As expected the diabetic patients had markedly higher levels of weight of women (P=0.0024), men (P=0.0157) and BMI of women (P=0.0388), waist circumference in women (P<0.0001), WHR in women (P<0.0001) and WHR in men (P=0.0147). Other results were not significantly different between case and control group and are tabulated in Table 1.
Biochemical and clinical findings
Biochemical test performed in the blood sample for following clinical parameters and the findings were tabulated. Statistical analysis was done by using student’s t-test and p-value obtained suggest the level of significant changes here. The descriptive data and comparison of biochemical parameters of diabetic patients versus controls are presented in Table 2. As expected, the diabetic patients had markedly higher levels of fasting
plasma glucose (P<0.0001) and HbA1c
(P<0.0001) and Post prandial glucose (P<0.0001) compared to that of control subject. Nominal difference was also observed for LDL-C (P=0.0462), triglyceride (P=0.0024), systolic blood pressure (P=0.0447). Creatinine value, blood urea level, HDL-C level and diastolic pressure were not significantly different between two groups and all the clinical studies (Table 2).
Detection of Interleukin 1 Receptor antagonist (IL-1RN or IL-1RA) Genetic polymorphism
9
Table 1. Comparison of anthropometric parameters of diabetic patients and controls
Characteristics Cases Controls P-value
n(Men/Women) 190(126/64) 210(114/96)
Age(years) 52.5±12.5 53.0±14.2 0.7100
Height(m) 160.50±13.40 162.2± 12.000 0.1815
Weight (Kg)
Women 62.5 ±5.70 60 ± 4.50 0.0024 **
Men 68±5.60 66.0±7.1 0.0157*
BMI (kg/m2)
Women 26.4±3.1 25.1 ± 4.3 0.0388*
Men 24.6±4.7 24.1± 5.1 0.4301
Waist circumference (cm)
Women 92.5±6.2 84.5±6.7 P<0.0001***
Men 90.0±7.0 89.0±6.0 0.2383
Hip (cm)
Women 95.0±5.0 96.5±6.0 0.178
Men 91.0±4.0 90.5±5.5 0.4183
WHR
Women 0.97±0.05 0.88±0.08 P<0.0001***
Men 0.99±0.05 1.00±0.03 0.0147*
*denotes level of significant change between case and control
Table 2.Comparison of Biochemical and clinical findings of diabetic patients and controls
Characteristics Cases Controls P-value
FPG(mg/dL) 143.3± 17.6 92.44±7.5 P<0.0001***
Post-Prandial Glucose (mg/Dl) 211.7±44.7 108.5±12.1 P<0.0001***
HbA1C (%) 6.9±0.8 5.3±0.6 P<0.0001***
HDL-C(mmol/L) 112.2±14.8 109.8±11.6 0.0705
LDL-C (mg/dL) 42.1±4.3 41.3±3.7 0.0462*
TG(mg/dL) 131.1±13.2 126.9±14.2 0.0024**
Systolic BP (mmHg) 130.20±8.1 128.8±5.7 0.0447*
Diastolic BP (mmHg) 87.1±5.8 86.5±6.0 0.3109
Blood Urea(mg/dL) 9.1±1.6 8.8±1.8 0.0801
Creatinine(mg/dL) 1.08±0.14 1.06±0.10 0.0986
(* denotes the level of significant change between case and control)
Values expressed in Mean ±SD are taken at one point of time during treatment and will not indicate a lifelong trend of the concentrations in the given patients.
This region was amplified using PCR. The alleles were designated according to their respective base pair size taking the 86 bp core repeat sequence of IL-1Ra VNTR marker from
literature. Five alleles were observed
corresponding to the length variation in different copy numbers of the 86 bp sequence. They were
10
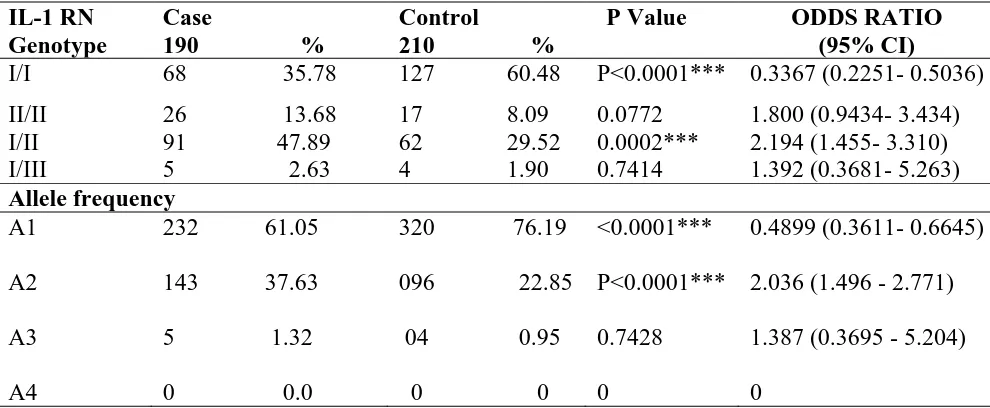
The distribution of genotype, allele frequency and carriage rate of IL-1RN was significantly different in case and control populations (Table 3). In our study, we found genotype I/I is significantly higher in control population as compared to patients of diabetes type 2 (60.48% vs. 35.78%). The genotype II/II was present in higher frequency in case population as compared to healthy controls (13.08% vs 8.09%). The heterozygous I/II was found in higher frequency in case population as compared to control (47.89% vs. 29.52%). I/III genotype was distributed in approximately equal frequency in both groups. The odds ratio of 0.34 of Genotype I/I has shown its protective effect while odds ratio of 1.80, 2.194 showed harmful and positive effects of II/II homozygous and I/II heterozygous respectively. Genotype I/I was significantly higher in control as compared to case (χ2= 24.33, P<0.0001) and genotype II/II was non-significantly higher in diabetic patients as compared to control population. Heterozygous was also found significantly higher in case as compared to control (χ2 value – 14.25 P=
0.0002). The overall allele frequency was significantly different between case and control (χ2=21.44, P<0.0001). Allele ‘I’ shows an odds
ratio of 0.4899 (p value= =<0.0001,
95%CI=0.3611- 0.6645) which supported its protective role against diabetes type 2. An odds ratio of 2.036 (p=<0.0001, 95%CI= 1.496 - 2.771) was found for allele ‘A2’ (II) which indicates its strong association with disease susceptibility. Carriage rate of allele I was higher in control and allele II were found in higher frequency in Diabetic individuals and was found significantly different between both groups (χ2= 9.659, P=0.0080). Allele frequency and carriage rate of allele III was rare in both groups and not significantly different between case and control. These data clearly indicate the association of allele II with susceptibility to diabetes type 2. Our findings suggested carriage of genotype I/II and II/II (p=0.0002; OR=2.194, 95% CI 1.455- 3.310 and p=0.0772; OR=1.80, 95% CI 0.9434- 3.434 respectively) were strongly associated with diabetes susceptibility.
Table 3. Genotype distribution and allele frequency Table for IL-1RN
IL-1 RN Genotype
Case
190 %
Control
210 %
P Value ODDS RATIO
(95% CI)
I/I 68 35.78 127 60.48 P<0.0001*** 0.3367 (0.2251- 0.5036)
II/II 26 13.68 17 8.09 0.0772 1.800 (0.9434- 3.434)
I/II 91 47.89 62 29.52 0.0002*** 2.194 (1.455- 3.310)
I/III 5 2.63 4 1.90 0.7414 1.392 (0.3681- 5.263)
Allele frequency
A1
A2
A3
A4
232 61.05
143 37.63
5 1.32
0 0.0
320 76.19
096 22.85
04 0.95
0 0
<0.0001***
P<0.0001***
0.7428
0
0.4899 (0.3611- 0.6645)
2.036 (1.496 - 2.771)
1.387 (0.3695 - 5.204)
0
11
Discussion
Type 2 Diabetes Mellitus is a disease that is increasing rapidly in a global environment of obesity and sedentary lifestyles. There is a systemic impact, both from a clinical and economic perspective on individuals and society. Diabetes type 2 is well established multifactorial disorder which could be associated with genetic as well as life style and environmental factors. It
means to say that neither genetic nor
environmental factors alone could be sufficient to cause diabetes type 2, but both of them are needed. Although, etiology of diabetes type 2 is not very clear but many studies previously reported the inheritance in the progeny, supports its strong genetic link. Diabetes type 2 has reached epidemic proportions in India and has become a major health problem worldwide. Escalating rates of diabetes type 2 is attributable to changes in the environment, favoring the onset of obesity, which is a major risk factor for type 2 diabetes. However, not all obese persons develop diabetes. Furthermore, a large variation in the occurrence of diabetes type 2 is observed among different ethnic groups, even when they are exposed to similar environmental conditions (Abate and Chandalia 2003).
Interleukin 1 Receptor antagonist is an endogenous inhibitor that antagonizes many of the biological actions of IL-1β by competitive inhibition (Arner 2000). The interleukin-1 receptor antagonist (IL-1ra) is a major modulator of the interleukin-1 pro-inflammatory pathway. In addition to the association with an increased prevalence of CAD, the presence of allele 2 of the IL-1RN (IL-1Ra) gene VNTR has been described as a risk factor for diabetic nephropathy (Blakemore et al. 1996).
Both β-cell expression and serum levels of IL-1Ra was reduced in patients with diabetes type 2 (Maedler et al. 2004; Marculescu et al. 2002). This inadequate IL-1 antagonism seems to be a genetic trait because genetic polymorphisms in the gene encoding IL-1Ra are associated with altered serum levels of IL-1Ra (Hurme and
Santtila 1998; Rafiq et al. 2007; Reiner et al. 2008; Strandberg et al. 2006).
Claus M. Larsen et al. 2007, proposed that 13 weeks of IL-1Ra treatment with anakinra reduced A1C, improved β-cell function, and reduced inflammatory markers. It is a great discovery and showed the possible role of inflammatory proteins in destruction of islets of beta cells in pancreas. Interleukin 1 Receptor antagonist gene contains an 86 bp VNTR in intron 2. Although polymorphism in intron doesn’t affect the production of functional protein but it may be associated with abnormality in rate of expression of protein. In present investigation, we found I/I was higher in control (60.48 vs. 35.78%), II/II genotype was higher in diabetes patients (13.68 vs. 8.09%), while combined heterozygous was also higher in patients (47.29 vs. 29.52%). I/I genotype has been found protective with odds ratio of 0.36, while our findings suggested carriage of genotype I/II, II/II (p=0.0002; OR=2.194, 95% CI 1.455- 3.310 and p=0.0772; OR=1.80, 95% CI 0.9434- 3.434 respectively) strongly associated with diabetes susceptibility. An odds ratio of 2.036 was found for allele ‘A2 (II)’ which indicates its strong association with disease susceptibility. III allele was very less observed in both case and control.
12
physically active persons was seen as compared to control (41.57% Vs 53.33%). The significance level was sufficiently strong to reveal the protective association of physical activity (χ2 =5.524, P Value 0.0188). An odds ratio of 0.62 clearly indicates the positive association of physical activity with prevention of diabetes and active life style that could be concluded as a very
important factor which can prevent
pathophysiology of diabetes type. In the present investigation, we had taken small sample size, but this is the first molecular level study in Vindhyan Region (Central India) population and we recommend a Genome wide association study in this region to find out the other genes associated with diabetes type 2.
Conclusion
On the basis of our findings we can conclude that obesity is associated with diabetes susceptibility
only in female subjects, meanwhile
polymorphism in IL-1RN VNTR polymorphism is associated with diabetes risk.
Conflicts of interest
All contributing authors declare no conflicts of interest.
Acknowledgments
The authors are thankful to the Awadhesh Pratap Singh University, Rewa (M.P.) for providing support materials and the laboratory facility for conducting this study.
References
Abate N, Chandalia M (2003) The impact of ethnicity on Type 2 diabetes. J Diabetes complication 17: 39-58 Achyut BR, Srivastava A, Bhattacharya S, Mittal B (2007)
Genetic association of interleukin-1beta (-511C/T) and interleukin-1 receptor antagonist (86 bp repeat) polymorphisms with Type 2 diabetes mellitus in North Indians. Clin Chim Acta 377: 163-169 Arner P (2000) Obesity a genetic disease of adipose tissue?
Br J Nutr 83: S9-S16
Bid HK, Konwar R, Agrawal CG, Banerjee M (2008) Association of IL-4 and IL-1RN (receptor antagonist) gene variants and the risk of type 2
diabetes mellitus: a study in the north Indian population. Indian J Med Sci 62: 259-266
Blakemore AI, Cox A, Gonzalez AM, Maskil JK, Hughes ME, Wilson RM, Ward JD, Duff GW (1996) Interleukin-1 receptor antagonist allele (IL1RN*2) associated with nephropathy in diabetes mellitus. Hum Genet 97: 369 –374
Clau M Larsen, Faulenbench M, Vaag A, Volund A, Ehses A, Seifert B et al. (2007) Interleukin-1 receptor antagonist in type 2 diabetes mellitus. N. Eng. Jr of Med 356: 1517-1526
Hurme M, Santtila S (1998) IL-1 receptor antagonist (IL-1Ra) plasma levels are co-ordinately regulated by both IL-1Ra and IL-1β genes. Eur J Immunol 28: 2598– 2602
Maedler K, Sergeev P, Ehses JA, Mathe Z, Bosco D, Berney T, Dayer JM, Reinecke M, Halban PA, Donath MY (2004) Leptin modulates β cell
expression of IL-1 receptor antagonist and release of IL-1β in human islets. Proc Natl Acad Sci USA 101: 8138– 8143
Marculescu R, Endler G, Schillinger M, Iordanova N, Exner M, Hayden E, Huber K, Wagner O, Mannhalter C (2002) Interleukin-1 receptor antagonist genotype is associated with coronary atherosclerosis in patients with type 2 diabetes. Diabetes 51: 3582– 3585
McCarthy MI, Froguel P (2002) Genetic approaches to the molecular understanding of type 2 diabetes. Am J Physiol Endocrinol Metab 283: 217-225
Miller SA, Dykes DD, Polesky HF (1988) A simple salting out procedure for extracting DNA from human nucleated cells. Nuc Acids Res 16 (3): 1215
Patel SK, Wong AL, Wong FL, Breen EC, Hurria A, Smith M, Kinjo C, Paz IB, Kruper L, Somlo G, Mortimer JE, Palomares MR, Irwin MR, Bhatia S (2015) Inflammatory Biomarkers, Comorbidity, and Neurocognition in Women with Newly Diagnosed Breast Cancer. J Natl Cancer Inst 107 (8): 1-7 Rafiq S, Stevens K, Hurst AJ, Murray A, Henley W,
Weedon MN, Bandinelli S, Corsi AM, Guralnik JM, Ferruci L, Melzer D, Frayling TM (2007) Common genetic variation in the gene encoding interleukin-1-receptor antagonist (IL-1RA) is associated with altered circulating IL-1RA levels. Genes Immun 8: 344– 351
Reiner AP, Wurfel MM, Lange LA, Carlson CS, Nord AS, Carty CL, Rieder MJ, Desmarais C, Jenny NS, Iribarren C, Walston JD, Williams OD, Nickerson DA, Jarvik GP (2008) Polymorphisms of the IL1-receptor antagonist gene (IL1RN) are associated with multiple markers of systemic inflammation.
Arterioscler Thromb Vasc Biol 28: 1407– 141 Strandberg L, Lorentzon M, Hellqvist A, Nilsson S,
13 associated with fat mass in young men. J Clin
Endocr Metab 91: 2749-2754