R E S E A R C H
Open Access
Association between pregnancy exposure
to air pollution and birth weight in selected
areas of Norway
Sviatlana Panasevich
1*, Siri Eldevik Håberg
1, Geir Aamodt
2, Stephanie J. London
3, Hein Stigum
1,4,
Wenche Nystad
1and Per Nafstad
1,4Abstract
Background:Exposure to air pollution has adverse effects on cardiopulmonary health of adults. Exposure to air pollution in pregnancy may affect foetal development. However, the evidence of such effect remains inconsistent. We investigated the effects of exposure to air pollution during pregnancy on birth outcomes.
Methods:This study, based within the Norwegian Mother and Child Cohort Study (MoBa), includes 17,533 participants living in the two largest cities in Norway: Oslo and Bergen, and their two surrounding counties: Akershus and Hordaland. Air pollution levels at residential addresses were estimated using land use regression models and back-extrapolated to the period of each pregnancy using continuous monitoring station data. Birth outcomes were birth weight, low birth weight, gestational age, and preterm delivery obtained from the Medical Birth Registry of Norway. Information on lifestyle factors was collected from MoBa questionnaires completed by mothers during pregnancy. Linear and logistic regression models were used to analyse the associations between pregnancy NO2exposure and birth outcomes. Results:We found a statistically significant negative association between pregnancy exposure to NO2and birth weight −43.6 (95%CI−55.8 to−31.5) g per 10μg/m3NO2. However, after adjusting for either area or the combination of parity and maternal weight, no substantive effects of air pollution exposure were evident.
Conclusions:Exposure to air pollution during pregnancy was associated with decrease in birth weight, but area-related and lifestyle factors attenuated this association. We found no statistically significant associations of air pollution exposure with gestational age, low birth weight or preterm delivery.
Keywords:Air pollution, Birth weight, MoBa, The Norwegian Mother and Child Cohort Study
Background
Air pollution has been shown to have systemic effects including inflammation and oxidative stress [1]. The as-sociations between exposure to higher air pollution levels and respiratory and cardiovascular morbidity in adults have been shown in numerous studies [1, 2]. There is increasing interest in the possibility that expos-ure to air pollution during pregnancy leads to develop-mental effects in the foetus, such as lower birth weight or shorter gestational age. Results of these relatively re-cent studies are inconsistent, and there are relatively few
data on putative causative biological pathways, critical time windows, and confounding by socioeconomic fac-tors [2, 3]. Exposure to air pollution during pregnancy may lead to health impairment later in life, including re-duced lung function, increased respiratory morbidity and altered immune system maturation [4]. Adverse birth outcomes may be a harbinger of air pollution ef-fects on further developmental changes that can only be detected later. The majority of studies associate reduced birth weight and low birth weight with exposure to CO, NO2, and/or particulate matter (PM10 and PM2.5) [5]. Our study investigated NO2as one of the major traffic-related pollutants and also as an indicator of ambient air pollution in Norway.
* Correspondence:Sviatlana.Panasevich@fhi.no
1Domain for Mental and Physical Health, Norwegian Institute of Public Health, Oslo, Norway
Full list of author information is available at the end of the article
With the development of new methods, epidemiologic studies have been able to provide more individualized exposure assessment by using dispersion or land use re-gression (LUR) models for estimating air pollution ex-posure at residential addresses. In this paper we built LUR models for traffic-related air pollutant NO2for the specific areas of Norway that we studied: two city areas (Oslo and Bergen) and their two surrounding counties (Akershus and Hordaland). The selected areas represent the most populated areas in Norway and also include the territories with highest levels of ambient air pollu-tion. Each of these four areas has different land use prac-tices, road network density, industrial activities and landscape specifics. To our knowledge, previously the as-sociations of modelled air pollution exposure with preg-nancy outcomes were studied in Norway only in Oslo [6, 7]. In the study of Oslo alone, no association between term birth weight and traffic air pollution was seen [6]. Oslo data were included in the consortium European Study of Cohorts for Air Pollution (ESCAPE) which re-ported an association of pregnancy exposure to PM2.5 with an increased risk of low birthweight at term but no significant decrease in birth weight [7].
We investigated the effects of exposure to traffic-related air pollution during pregnancy in selected urban and county areas of Norway on birth outcomes, includ-ing birth weight and the length of gestation.
Methods Study population
The Norwegian Mother and Child Cohort Study (MoBa) is a prospective population-based pregnancy cohort study conducted by the Norwegian Institute of Public Health [8, 9]. Participants were recruited from all over Norway from 1999 to 2008. Among invited women, 40.6 % consented to participate. The whole cohort in-cludes 114,500 children, 95200 mothers and 75200 fa-thers. Participants living in Oslo, Akershus, Bergen and Hordaland with information on home address at the time of delivery were included in our study (N= 22149). We excluded consequently participants with missing pregnancy NO2 exposure information (N= 3876), mul-tiple births (N= 664) and non-live births (N= 76). Only data on singleton live births were used in the analysis. Total number of participants from the studied areas with non-missing air pollution exposure data was 17533 (born from 2001 to 2009), of which 4669 from Oslo, 7554 from Akershus, 3869 from Bergen and 1441 from Hordaland (Table 1). Birth records were obtained from the Medical Birth Registry of Norway (MBRN). Mothers participating in the MoBa study filled a number of ques-tionnaires. We used data on lifestyle characteristics from questionnaire 1 filled at recruitment (approximately at week 17–18 of pregnancy) and questionnaire 3 filled at
week 30 of pregnancy. MoBa has approvals from the re-gional Ethics committee and the Norwegian Data In-spectorate. The current study is based on version VI of the quality-assured data files released for research on the 15thApril 2011.
Outcomes and covariates
For assessing birth outcomes we used continuous MBRN variables birth weight (grams) and gestational age (weeks). Air pollution can potentially affect the size of developing foetus. Therefore estimating gestational age was based on the last menstrual periods as estimates based on ultrasound assessments are dependent on early foetal growth [10]. If information on the last menstrual period was missing (N= 718, 9.5 %), we used data from ultrasound measurements to determine gestational age. We also studied binary outcomes: low birth weight (<2500 g) and preterm delivery (<37 completed weeks of gestation).
The following characteristics were also extracted from the MBRN: sex of the child (boy; girl), parity (0; 1;≥2), mother’s age at birth (years), marital status (married/co-habit; other). Questionnaire information was used to de-termine: maternal education (less than high school; high school; up to 4 years of college; more than 4 years of college (master or professional degree)), maternal smok-ing dursmok-ing pregnancy (never; any smoksmok-ing dursmok-ing preg-nancy), maternal weight at the beginning of pregnancy (kg), maternal height (cm). Exposure to air pollution was estimated at the registered address at delivery. Women who did not change their address during pregnancy were used in a sensitivity analysis. Area variable was defined by the location of the address at delivery: Oslo, Akershus, Bergen, Hordaland.
Air pollution exposure
Estimating air pollution exposure during pregnancy was based on the methodology developed for the ESCAPE project [7, 11]. LUR models for NO2levels were built for the studied areas in order to account for regional spe-cifics. In the models we used air pollution measurements conducted in 2010 for Oslo and Akershus, and in 2011 for Bergen and Hordaland. Measurement campaigns in-cluded three rounds of approximately two weeks dur-ation with NO2 measurements (during winter, summer and an intermediate season) within a one year period. Measurement sites were selected to represent the range of residential exposure for each study area. For the ana-lysis we included sites with no missing data, and no geo-coding mismatches.
built for Bergen and Hordaland together due to a low number of valid measurement sites for Hordaland. Pre-dictors for building the LUR model were obtained from a GIS analysis of the N50 and VBASE maps (obtained in
February 2013) providing information on land use, resi-dential density, types of landscape and road network in-formation. Predictor variables are listed in Additional file 1: Table S1. We used altitude, distances to roads, Table 1Descriptive statistics for study participants from the MoBa cohort: N (%) or mean ± standard deviation
Oslo (N= 4669) Akershus (N= 7554) Bergen (N= 3869) Hordaland (N= 1441) Total (N= 17533)
Birth weighta, g 3539 ± 545 3617 ± 558 3592 ± 550 3628 ± 553 3592 ± 554
Low birth weight 153 (3.3) 192 (2.5) 107 (2.8) 39 (2.7) 491 (2.8)
Missing 7 (0.1) 3 (0.1) 10 (0.1)
Gestational age, weeks 39.7 ± 1.9 39.8 ± 1.9 39.8 ± 1.9 39.7 ± 1.9 39.8 ± 1.9
Preterm delivery 241 (5.2) 340 (4.5) 170 (4.4) 68 (4.7) 819 (4.7)
Women who changed address during pregnancy
629 (13.5) 1023 (13.5) 513 (13.3) 171 (11.9) 2336 (13.3)
Parity
0 2819 (60.4) 3032 (40.1) 1930 (49.9) 529 (36.7) 8310 (47.4)
1 1424 (30.5) 3052 (40.4) 1314 (34.0) 538 (37.3) 6328 (36.1)
≥2 426 (9.1) 1470 (19.5) 625 (16.2) 374 (26.0) 2895 (16.5)
Birth weight by parity, g
0 3471 ± 544 3512 ± 547 3484 ± 545 3524 ± 547 3492 ± 546
1 3645 ± 522 3676 ± 542 3687 ± 502 3652 ± 554 3669 ± 531
≥2 3630 ± 562 3712 ± 579 3722 ± 596 3742 ± 533 3706 ± 575
Sex of child
Boy 2413 (51.7) 3808 (50.4) 1950 (50.4) 754 (52.3) 8925 (50.9)
Girl 2256 (48.3) 3746 (49.6) 1919 (49.6) 687 (47.7) 8608 (49.1)
Maternal age, years 31.3 ± 4.1 31.4 ± 4.5 30.5 ± 4.6 29.5 ± 4.8 31.0 ± 4.5
Marital status
Married/cohabit 4530 (97.0) 7335 (97.1) 3576 (92.4) 1339 (92.9) 16780 (95.7)
Other 139 (3.0) 219 (2.9) 293 (7.6) 102 (7.1) 753 (4.3)
Maternal education
Less than high school 140 (3.0) 495 (6.6) 207 (5.4) 144 (10.0) 986 (5.6)
High school 804 (17.2) 2062 (27.3) 842 (21.8) 467 (32.4) 4175 (23.8)
Up to 4 years of college 1734 (37.1) 2768 (36.6) 1455 (37.6) 523 (36.3) 6480 (37.0)
More than 4 years of college (master or professional degree)
1762 (37.7) 1772 (23.5) 1115 (28.8) 218 (15.1) 4867 (27.8)
Missing 229 (4.9) 457 (6.1) 250 (6.5) 89 (6.2) 1025 (5.9)
Maternal smoking during pregnancy 171 (3.7) 555 (7.4) 225 (5.8) 134 (9.3) 1085 (6.2)
Missing 221 (4.7) 443 (5.9) 247 (6.4) 89 (6.2) 1000 (5.7)
Maternal weighta, kg 65.3 ± 10.4 67.3 ± 11.4 66.3 ± 11.0 68.4 ± 11.9 66.7 ± 11.2
Maternal heighta, cm 168.4 ± 6.1 168.3 ± 5.9 168.0 ± 5.9 167.9 ± 6.1 168.2 ± 5.9
Season of birth
Winter 1042 (22.3) 1650 (21.8) 1015 (26.2) 392 (27.2) 4099 (23.4)
Spring 1224 (26.2) 2052 (27.2) 1020 (26.4) 390 (27.1) 4686 (26.7)
Summer 1292 (27.7) 2102 (27.8) 900 (23.3) 336 (23.3) 4630 (26.4)
Autumn 1111 (23.8) 1750 (23.2) 934 (24.1) 323 (22.4) 4118 (23.5)
LUR modelled NO2exposure
during pregnancy,μg/m3 21.6 ± 4.4 10.3 ± 3.8 13.2 ± 6.2 6.3 ± 4.3 13.6 ± 6.9
a
port, airport, and to sea, estimates of land use types within the buffers of 100, 300, 500, 1000 and 5000 m. We included all categories of roads except walking and bicycling paths. Major roads included only roads of European, state and county levels. The summarized lengths of roads were estimated within the buffers of 25, 50, 100, 300, 500 and 1000 m. We built multiple linear regression models and performed diagnostic model tests according to the method described by Beelen and col-leagues [11]. Final models were validated for: multicolli-nearity between included variables (Variance Inflation Factors), influential observations (Cook’s D), heterosce-dasticity and spatial autocorrelation (Moran’s I) of resid-uals to assess the independence assumption. We used leave-one-out cross-validation (LOOCV) method to evaluate model performance.
Yearly means of air pollution levels at residential ad-dress at birth were estimated using the resulting LUR models. Variables in models were truncated in accord-ance to the range of corresponding variables used for LUR model building. Negative modelled values were re-placed with 0.01. In order to account for temporal vari-ability, we used the ratio method of back-extrapolation to the period of each pregnancy using continuous rou-tine monitoring station data [7]. Daily NO2 measure-ments were obtained from the Norwegian Institute for Air Research database “Luftkvalitet.info” for the period 2000–2012 in Oslo (used for Oslo and Akershus), and for the period 2003–2012 in Bergen (used for Bergen and Hordaland). The daily estimates of exposure were calculated as the LUR-modelled yearly estimate multi-plied by the ratio between daily NO2routine monitoring station measurement and an annual average for the year when LUR measurement campaign took place. Daily NO2exposure estimates were averaged separately for 1st, 2nd, and 3rd trimester, and also over the whole preg-nancy. Exposures by trimester and the whole pregnancy exposure were highly correlated and therefore we de-cided to use one exposure estimate: the average NO2 ex-posure during the whole pregnancy.
Statistical analysis
We used linear regression models to analyse associations between pregnancy NO2exposure and birth weight and gestational age. Logistic regression models were used to evaluate associations between pregnancy NO2 exposure and low birth weight and preterm delivery. The results are presented for both crude and adjusted models for a 10 μg/m3 increase in NO2. Adjustment variables were selected based on the literature analysis. Model 1 is ad-justed for: maternal education, birth season, sex of child, maternal age, maternal marital status, maternal smoking during pregnancy, and maternal height. Model 2 con-tains Model 1 adjustment plus the area variable. Model
3 contains Model 1 adjustment plus parity and mater-nal weight. We performed stratified amater-nalysis by area (Oslo, Akershus, Bergen, Hordaland), smoking status of the mother during pregnancy, parity, sex of child, ma-ternal education level, and season of birth in order to explore potential effect modifiers. Sensitivity analysis of the results was performed in a subgroup of women who did not change address during pregnancy and in a sub-group of women for whom gestational age was deter-mined from the last menstrual period –as a preferable method for assessment of potential effects of air pollution on the size of the developing foetus [10]. Additional analysis was performed in a subset of partic-ipants with no missing data. We used ArcGIS10.1 soft-ware (Esri, CA, USA) for GIS analyses; statistical analyses were performed using STATA 13.0 (StataCorp, Texas, USA).
Results
Overall birth weight was lower in cities (Oslo and Ber-gen) and higher in the two county areas (Akershus and Hordaland), however, these differences were less prom-inent when comparing birth weight within each parity strata (Table 1). Having had at least two children prior to the study pregnancy was more common in Horda-land (26 %) than in Oslo (9.1 %). Educational differ-ences were also notable with the highest proportion of higher education in Oslo. Maternal smoking during pregnancy was uncommon (<10 %) throughout but highest in Hordaland.
The LUR models created for estimating NO2 yearly means are presented in Table 2. For Oslo, the important predictors were forested and semi-natural areas within the buffer of 1000 m and inverse squared distance to major road. The important predictors in the Akershus NO2model were area of water in the buffer of 500 m, distance to major road, and agricultural areas within the buffer of 1000 m. The model for levels of NO2in Bergen and Hordaland included the following: lengths of major roads within the buffers 50 m, 50 to 100 m, 100 to 1000 m, inverse squared distance to port, high and low density residential land within the buffer of 1000 m, alti-tude, agricultural area within the buffer of 1000 m, and distance to the sea. The adjusted R2 of the models ranged from 59 to 87 % (Table 2).
during pregnancy were below the European Union standard of average 1 year exposure of 40μg/m3NO2.
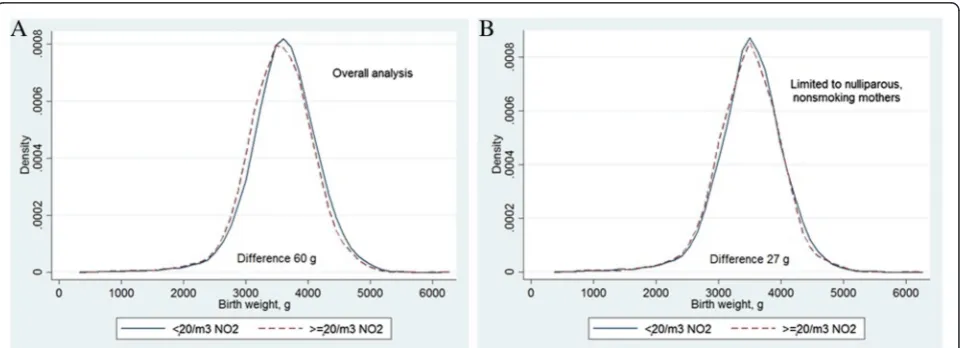
Comparing the overall birth weight distributions, we found a shift towards lower birth weight in children with pregnancy exposure to NO2 above or equal to 20μg/m3(corresponding to the highest quartile of posure in our study population) compared to those ex-posed to below 20 μg/m3 NO2, with estimated 60 g difference in means (p< 0.0001) between these groups (Fig. 1a). The same comparison of birth weight distri-butions among first-borns in non-smoking mothers gave us a smaller difference of 27 g (p= 0.047) (Fig. 1b). In the adjusted regression Model 1 we found a statistically significant negative association between pregnancy exposure to NO2 and birth weight −43.6 (95%CI−55.8 to−31.5) g per 10μg/m3NO2(Table 3). The estimate changed very little in sensitivity analysis restricted to women who did not change their address during pregnancy, and in an analysis restricted to women for whom gestational age was estimated with
last menstrual period data. However, the effect esti-mate was strongly attenuated and no longer statisti-cally significant in further adjustment (Models 2 and 3). Among the model covariates, those with the stron-gest effect in attenuating the air pollution effect estimates were either study area (Model 2) or a com-bination of parity and maternal weight (Model 3) (Table 3). Results of the analyses repeated in a subset of participants with no missing data (N= 15829) did not change substantially from the results in the main analyses.
Upon stratification of the crude and the adjusted Model 1 by area, none of the associations of pregnancy air pollution exposure and birth weight were statistically significant (Table 3). The association of air pollution with birth weight was statistically significant in the much larger group of non-smokers but not the small group of smokers although associations for both groups were in the same direction. Inverse associations were seen at all levels of maternal education but were strongest in the Table 2Description of the developed land use regression models for NO2
Study area LUR modela R2of
model
Adjusted R2 of model
RMSE (cross-validation) (μg m−3)
Number of sites
Moran’s I (p-value)
Measured concentration (μg/m3)b
Oslo 24.59–8.40E-06*NATURAL1000 + 9684.22*DISTINVMAJOR2
67 % 61 % 5.3 14 −0.09 (0.45) 19.1 [2.8–30.0]
Akershus 15.79 + 0.000042*WATER500 -0.01*DISTMAJOR - 3.79E-06* AGRO1000
59 % 55 % 4.5 36 0.01 (0.41) 13.7 [5.3–30.3]
Bergen and Hordaland
7.38 + 0.01*MAJORLENGTH50_100 + 859649.5*DISTINVPORT2 + 4.20E-06* HLDRES1000 + 0.05*MAJORLENGTH50 + 0.0003*MAJORLENGTH100_1000 - 0.05* ALT–0.00003*AGRO1000 + 0.002*DISTSEA
87 % 85 % 4.3 46 −0.12 (0.11) 18.7 [6.8–51.0]
a
See Additional file1: Table S1 for definitions of the variable names.b
Mean [min - max].LURland use regression
Main analysis
Entire study population 17523 −37.9 (−49.7 to−26.0) <0.001 16273 −43.6 (−55.8 to−31.5) <0.001 16273 −5.6 (−23.6 to 12.4) 0.54 15829 −7.4 (−19.6 to 4.8) 0.24
Women who did not change address
15191 −37.4 (−50.2 to−24.7) <0.001 14196 −42.7 (−55.7 to−29.6) <0.001 14196 −7.0 (−26.3 to 12.3) 0.48 13818 −4.7 (−17.8 to 8.4) 0.48
LMP-based GA only 16805 −35.4 (−47.5 to−23.2) <0.001 15618 −40.8 (−53.3 to−28.4) <0.001 15618 −3.2 (−21.6 to 15.1) 0.73 15195 −5.8 (−18.3 to 6.7) 0.36
Stratified analysis
Oslo 4669 7.5 (−27.7 to 42.7) 0.68 4380 −5.9 (−42.8 to 31.0) 0.75 4285 12.5 (−24.3 to 49.3) 0.51
Akershus 7547 10.5 (−22.8 to 43.9) 0.54 6982 8.9 (−25.4 to 43.1) 0.61 6759 29.2 (−4.8 to 63.1) 0.09
Bergen 3866 −15.6 (−43.7 to 12.4) 0.28 3577 −4.8 (−33.0 to 23.4) 0.74 3490 19.8 (−7.7 to 47.2) 0.16
Hordaland 1441 −37.6 (−104.6 to 29.4) 0.27 1334 −36.0 (−103.5 to 31.5) 0.30 1295 −26.7 (−92.7 to 39.2) 0.43
Not smoking 15440 −41.3 (−53.8 to−28.8) <0.001 15229 −43.3 (−55.8 to−30.8) <0.001 15229 −6.6 (−25.1 to 12.0) 0.49 14835 −5.6 (−18.2 to 6.9) 0.38
Smoking 1083 −28.3 (−80.0 to 23.3) 0.28 1044 −45.5 (−97.7 to 6.8) 0.09 1044 22.1 (−51.8 to 96.1) 0.56 994 −27.3 (−80.1 to 25.5) 0.31
Parity 0 8304 −16.8 (−33.3 to−0.4) 0.045 7803 −17.8 (−34.7 to−1.0) 0.04 7803 4.3 (−20.5 to 29.0) 0.74 7594 −8.3 (−25.2 to 8.5) 0.33
Parity 1 6326 −0.6 (−20.6 to 19.4) 0.95 5858 −6.9 (−27.4 to 13.5) 0.51 5858 21.8 (−8.2 to 51.8) 0.15 5695 2.0 (−18.3 to 22.4) 0.85
Parity≥2 2893 −26.5 (−60.3 to 7.4) 0.13 2612 −31.0 (−66.4 to 4.4) 0.09 2612 17.8 (−31.7 to 67.4) 0.48 2540 −24.8 (−59.9 to 10.4) 0.17
Boys 8921 −30.7 (−47.5 to−13.8) <0.001 8290 −39.6 (−57.0 to−22.2) <0.001 8290 −7.5 (−33.0 to 18.1) 0.57 8040 −5.4 (−22.8 to 12.1) 0.55
Girls 8602 −45.5 (−62.0 to−29.1) <0.001 7983 −47.8 (−64.8 to−30.8) <0.001 7983 −3.6 (−28.9 to 21.8) 0.78 7789 −9.4 (−26.4 to 7.6) 0.28
Education less than high school
985 −35.4 (−95.3 to 24.5) 0.25 968 −24.5 (−83.4 to 34.5) 0.42 968 −18.4 (−96.7 to 60.0) 0.65 905 −27.8 (−87.2 to 31.5) 0.36
Education high school 4173 −31.9 (−58.5 to−5.3) 0.02 4098 −36.0 (−62.3 to−9.7) 0.007 4098 10.4 (−27.3 to 48.1) 0.59 3948 4.8 (−21.7 to 31.3) 0.72
Education up to 4 years of college
6474 −42.4 (−61.5 to−23.3) <0.001 6403 −44.0 (−62.8 to−25.3) <0.001 6403 −1.5 (−30.2 to 27.1) 0.92 6262 −4.9 (−23.7 to 13.9) 0.61
Education more than 4 years of college (master or professional degree)
4866 −48.2 (−69.6 to−26.9) <0.001 4804 −50.2 (−71.4 to−29.0) <0.001 4804 −17.8 (−49.4 to 13.8) 0.27 4714 −13.3 (−34.5 to 8.0) 0.22
Born in winter 4097 −20.2 (−46.6 to 6.2) 0.13 3797 −35.3 (−62.5 to−8.2) 0.01 3797 7.8 (−31.1 to 46.7) 0.69 3677 4.9 (−22.4 to 32.1) 0.73
Born in spring 4684 −60.6 (−82.2 to−39.0) <0.001 4355 −60.2 (−82.2 to−38.3) <0.001 4355 −46.7 (−79.5 to−13.8) 0.005 4226 −28.5 (−50.6 to−6.4) 0.01
Born in summer 4626 −35.1 (−57.4 to−12.8) 0.002 4272 −40.5 (−63.3 to−17.6) 0.001 4272 14.2 (−20.7 to 49.1) 0.43 4167 −2.7 (−25.7 to 20.3) 0.82
Born in autumn 4116 −28.8 (−54.9 to−2.7) 0.03 3849 −31.9 (−58.6 to−5.3) 0.02 3849 16.1 (−23.0 to 55.1) 0.42 3759 5.1 (−21.4 to 31.7) 0.70
Effect estimate in grams per 10μg/m3
NO2 GAgestational age,LMPlast menstrual period
a
Model 1 adjusted for: maternal education, birth season, sex of child, maternal age, maternal marital status, maternal smoking during pregnancy, maternal height
b
Model 2 adjusted for: maternal education, birth season, sex of child, maternal age, maternal marital status, maternal smoking during pregnancy, maternal height, area
c
Model 3 adjusted for: maternal education, birth season, sex of child, maternal age, maternal marital status, maternal smoking during pregnancy, maternal height, parity, maternal weight; in stratified analysis the corresponding stratification variable is not included in the adjustment
al.
Archives
of
Public
Health
(2016) 74:26
Page
6
of
groups with higher education. In the adjusted Models 2 and 3, where the overall findings were attenuated to-wards null, significant inverse associations between NO2 and birth weight were seen only in children born in spring (Table 3).
In our analysis we found no significant association of NO2 exposure during pregnancy and either gestational age, low birth weight or preterm delivery (Additional file 1: Table S2, Table S3 and Table S4).
Discussion
We found a significant association of exposure to NO2 during pregnancy with lower birth weight. However, this association was strongly attenuated and no longer statis-tically significant when adjusting for study area. Adjust-ing for parity and maternal weight also substantially attenuated the association. No statistically significant as-sociations were found for gestational age, low birth weight and preterm delivery.
Birth weight is associated with a variety of different factors: genetic and ethnic background, parity, maternal weight, socio-economic factors, medical conditions be-fore or during pregnancy, and maternal lifestyle vari-ables, most notably smoking during pregnancy [12]. The role of traffic-related exposure to NO2during pregnancy have been investigated in a number of studies with in-consistent results. An association of NO2exposure with low birth weight was found in the studies of Bell et al. 2007 (exposure during 1sttrimester), Lee et al. 2003 (ex-posure between months 3 and 5) [13, 14]. However, studies by Madsen et al. 2010, Liu et al. 2003, Aguilera et al. 2009, and Pedersen et al. 2013 did not find such
association, [6, 7, 15, 16] even though the mean levels of exposure were comparable in these studies.
In our study, the association between pregnancy ex-posure to NO2 and birthweight was attenuated and no longer statistically significant when adjusting for study area. Our area variable may reflect the spatial distribu-tion of air polludistribu-tion, representing by itself the proxy of exposure, or it may represent unmeasured factors in each study area which also influence birth weight and pregnancy length. The area means for modelled NO2 range from highest in Oslo to lowest in Hordaland (Table 1), thus adjusting for area may remove some of the effect of spatially distributed air pollution [17]. Also, we found no association of pregnancy exposure to air pollution with decrease in birth weight in a stratified analysis by study area. The phenomenon where overall analysis indicates a strong reverse association between air pollution and birth weight and no such effect in the stratified analysis by area is theoretically presented as a scheme in Fig. 2. The observed effect might be due to minor methodological differences in initial measurement campaigns and their timing in different areas, differences in LUR models and in factors determining the NO2 levels on local scale. Areas may differ by mean levels of air pollution exposure, as well as by socioeconomic and lifestyle characteristics. For instance, social classes may be differently distributed within polluted areas depend-ing on a region [4]. In the light of these area differences within one country with relatively homogenous popula-tion, more attention should be given to exploring socio-economic and lifestyle differences in large multicenter studies and consortia [18].
Among the potential area-specific factors that attenu-ate the association of birth weight with air pollution ex-posure, our study singled out the combination of parity and maternal weight. These factors may be related to lifestyle, socioeconomic situation, and health state of mothers, and can vary by study area. Specifically in Norway, families with more than one child tend to move out from large cities, which may explain the difference in distribution of parity by study area. Stronger associa-tions of air pollution exposure with adverse birth outcomes have been reported in less economically advantaged classes [19, 20]. In our data we observed a more pronounced decrease in birth weight in cities com-pared to counties and in mothers with higher levels of education compared to mothers with lower levels of education (Table 3). More travel to and from work and to other activities, visiting central more polluted parts of the city by higher educated women and city dwellers may result in a potential exposure misclassification [21].
Our study found no association of NO2exposure dur-ing pregnancy with gestational age and preterm delivery. This is in line with other studies also reporting no asso-ciation of NO2exposure with preterm delivery [16, 22].
The important strengths of our study include stan-dardized exposure assessment, detailed information on potential confounders, and a large study population. We highlighted the importance of area-specific factors that may confound the association between air pollution ex-posure and pregnancy outcomes. Our results suggest that these factors should be given a proper consideration in large multicenter studies. Further research is needed for identifying potential critical windows of exposure. In our data, exposures by trimester were highly correlated with whole pregnancy exposure. We assessed exposure at residence, but for more detailed individual exposure it is advisable to consider estimating exposures during travel and frequency of visits to city center. Most of our study participants did not move during pregnancy, but we did note a difference in distribution of multiparous women in our study areas, with higher proportion of them living in counties, and not in the cities. Besides the identification of the important confounders, such as par-ity and maternal weight, we might still have the residual confounding of unmeasured lifestyle factors in our data.
Conclusions
In this large pregnancy cohort with detailed information on lifestyle and pregnancy factors, land use regression modelled exposure to NO2during pregnancy was associ-ated with a decrease in birth weight in some models. However, when adjusting for area-related and lifestyle fac-tors this association was attenuated. We found no statisti-cally significant associations of air pollution exposure with gestational age, low birth weight and preterm delivery.
Additional file
Additional file 1:Table S1.Predictor variables used in land use regression with variable names, units, buffer sizes, transformations and predefined direction of effect.Table S2.Main and stratified analysis of association between pregnancy exposure to NO2and gestational age.
Table S3.Main and stratified analysis of association between pregnancy exposure to NO2and low birth weight.Table S4.Main and stratified analysis of association between pregnancy exposure to NO2and preterm delivery. (DOCX 43 kb)
Abbreviations
GA:gestational age; LMP: last menstrual period; LUR: land use regression; MBRN: Medical Birth Registry of Norway; MoBa: Norwegian Mother and Child Cohort Study.
Acknowledgments
The co-authors would like to express gratitude to all MoBa cohort participants and research team, to Jon Wickmann at NIPH for his generous help with database management, and to the Norwegian Institute for Air Research team of“Luftkvalitet.info”database for providing valuable research data.
Funding
The Norwegian Mother and Child Cohort Study is supported by the Norwegian Ministry of Health and the Ministry of Education and Research, NIH/NIEHS (contract no N01-ES-75558), NIH/NIDS (grant no.1 UO1NS 047537–01 and grant no.2 UO1 NS 047537-06A1). This study was also supported by the Research Council of Norway (grant no.196102) and the Intramural Research Program of the NIH, National Institute of Environmental Health Sciences (project number Z01 ES49019).
Authors’contributions
PN, SJL, WN were involved in conception, hypothesis delineation and study design. SJL, GA, SEH, SP contributed to the exposure assessment. SP analysed the data under the supervision of PN and HS. SP drafted this manuscript. All co-authors were involved in data interpretation and providing feed-back for the manuscript. All authors read and approved the final manuscript.
Competing interests
The authors declare that they have no competing interests.
Consent
All participants gave written informed consent.
Author details
1Domain for Mental and Physical Health, Norwegian Institute of Public Health, Oslo, Norway.2Department of Landscape Architecture and Spatial Planning, Norwegian University of Life Sciences, Ås, Norway.3National Institute of Environmental Health Sciences, National Institutes of Health, Department of Health and Human Services, Research Triangle Park, North Carolina, USA.4Department of General Practice and Community Medicine, Medical Faculty, University of Oslo, Oslo, Norway.
Received: 22 March 2016 Accepted: 7 May 2016
References
1. Brook RD, Rajagopalan S, Pope 3rd CA, Brook JR, Bhatnagar A, Diez-Roux AV, Holguin F, Hong Y, Luepker RV, Mittleman MA, et al. Particulate matter air pollution and cardiovascular disease: An update to the scientific statement from the American Heart Association. Circulation. 2010;121(21):2331–78. 2. Ruckerl R, Schneider A, Breitner S, Cyrys J, Peters A. Health effects of
particulate air pollution: A review of epidemiological evidence. Inhal Toxicol. 2011;23(10):555–92.
3. Glinianaia SV, Rankin J, Bell R, Pless-Mulloli T, Howel D. Particulate air pollution and fetal health: a systematic review of the epidemiologic evidence. Epidemiology. 2004;15(1):36–45.
5. Stieb DM, Chen L, Eshoul M, Judek S. Ambient air pollution, birth weight and preterm birth: A systematic review and meta-analysis. Environ Res. 2012;117:100–11.
6. Madsen C, Gehring U, Walker SE, Brunekreef B, Stigum H, Naess O, Nafstad P. Ambient air pollution exposure, residential mobility and term birth weight in Oslo, Norway. Environ Res. 2010;110(4):363–71.
7. Pedersen M, Giorgis-Allemand L, Bernard C, Aguilera I, Andersen AM, Ballester F, Beelen RM, Chatzi L, Cirach M, Danileviciute A, et al. Ambient air pollution and low birthweight: a European cohort study (ESCAPE). Lancet Respir Med. 2013;1(9):695–704.
8. Magnus P, Irgens LM, Haug K, Nystad W, Skjaerven R, Stoltenberg C, MoBa Study G. Cohort profile: the Norwegian Mother and Child Cohort Study (MoBa). Int J Epidemiol. 2006;35(5):1146–50.
9. Nilsen RM, Vollset SE, Gjessing HK, Skjaerven R, Melve KK, Schreuder P, Alsaker ER, Haug K, Daltveit AK, Magnus P. Self-selection and bias in a large prospective pregnancy cohort in Norway. Paediatr Perinat Ep. 2009;23(6): 597–608.
10. Slama R, Khoshnood B, Kaminski M. How to control for gestational age in studies involving environmental effects on fetal growth. Environ Health Perspect. 2008;116(7):A284. author reply A284-A285.
11. Beelen R, Hoek G, Vienneau D, Eeftens M, Dimakopoulou K, Pedeli X, Tsai MY, Kunzli N, Schikowski T, Marcon A, et al. Development of NO2 and NOx land use regression models for estimating air pollution exposure in 36 study areas in Europe - The ESCAPE project. Atmos Environ. 2013;72:10–23. 12. de Bernabe JV, Soriano T, Albaladejo R, Juarranz M, Calle ME, Martinez D,
Dominguez-Rojas V. Risk factors for low birth weight: a review. Eur J Obstet Gyn R B. 2004;116(1):3–15.
13. Bell M, Ebisu K, Belanger K. Is risk of low birth weight affected by maternal exposure to air pollution? Epidemiology. 2007;18(5):S128.
14. Lee BE, Ha EH, Park HS, Kim YJ, Hong YC, Kim H, Lee JT. Exposure to air pollution during different gestational phases contributes to risks of low birth weight. Hum Reprod. 2003;18(3):638–43.
15. Aguilera I, Guxens M, Garcia-Esteban R, Corbella T, Nieuwenhuijsen MJ, Foradada CM, Sunyer J. Association between GIS-Based Exposure to Urban Air Pollution during Pregnancy and Birth Weight in the INMA Sabadell Cohort. Environ Health Perspect. 2009;117(8):1322–7.
16. Liu SL, Krewski D, Shi YL, Chen Y, Burnett RT. Association between gaseous ambient air pollutants and adverse pregnancy outcomes in Vancouver, Canada. Environ Health Perspect. 2003;111(14):1773–8.
17. Hoffmann B, Moebus S, Dragano N, Stang A, Mohlenkamp S, Schmermund A, Memmesheimer M, Brocker-Preuss M, Mann K, Erbel R, et al. Chronic Residential Exposure to Particulate Matter Air Pollution and Systemic Inflammatory Markers. Environ Health Perspect. 2009;117(8):1302–8. 18. Strickland MJ, Klein M, Darrow LA, Flanders WD, Correa A, Marcus M, Tolbert
PE. The issue of confounding in epidemiological studies of ambient air pollution and pregnancy outcomes. J Epidemiol Commun H. 2009;63(6): 500–4.
19. Wilhelm M, Ritz B. Residential proximity to traffic and adverse birth outcomes in Los Angeles county, California, 1994–1996. Environ Health Perspect. 2003;111(2):207–16.
20. Ponce NA, Hoggatt KJ, Wilhelm M, Ritz B. Preterm birth: the interaction of traffic-related air pollution with economic hardship in Los Angeles neighborhoods. Am J Epidemiol. 2005;162(2):140–8.
21. Ha S, Hu H, Roussos-Ross D, Kan HD, Roth J, Xu XH. The effects of air pollution on adverse birth outcomes. Environ Res. 2014;134:198–204. 22. Brauer M, Lencar C, Tamburic L, Koehoorn M, Demers P, Karr C. A cohort
study of traffic-related air pollution impacts on birth outcomes. Environ Health Perspect. 2008;116(5):680–6.
• We accept pre-submission inquiries
• Our selector tool helps you to find the most relevant journal
• We provide round the clock customer support
• Convenient online submission
• Thorough peer review
• Inclusion in PubMed and all major indexing services
• Maximum visibility for your research
Submit your manuscript at www.biomedcentral.com/submit