Interaction analysis of the new pooled
cohort equations for 10-year
atherosclerotic cardiovascular disease
risk estimation: a simulation analysis
Chun G Schiros,1Thomas S Denney Jr,2Himanshu Gupta1,3
To cite:Schiros CG, Denney TS, Gupta H. Interaction analysis of the new pooled cohort equations for 10-year atherosclerotic cardiovascular disease risk estimation: a simulation analysis.BMJ Open2015;5: e006468. doi:10.1136/ bmjopen-2014-006468
▸ Prepublication history and additional material is available. To view please visit the journal (http://dx.doi.org/ 10.1136/bmjopen-2014-006468).
Received 26 August 2014 Revised 26 December 2014 Accepted 7 January 2015
1Department of Medicine,
Cardiovascular Disease, University of Alabama, Birmingham, Alabama, USA
2Department of Electrical and
Computer Engineering, Auburn University, Auburn, Alabama, USA
3VA Medical Center,
Birmingham, Alabama, USA
Correspondence to Dr Himanshu Gupta; [email protected]
ABSTRACT
Objectives:To evaluate the individual and interacting
impacts of the continuous variables (age, total cholesterol (total-C), high-density lipoprotein cholesterol (HDL-C) and systolic blood pressure(BP)) on 10-year atherosclerotic cardiovascular disease (ASCVD) risk and better understand the pattern of predicted 10-year risk with change of each variable using recently published new pooled cohort equations.
Design:Simulation analysis was performed across the
whole range of the boundary limits suggested for the continuous variables for groupings based on race and gender in the pooled cohort 10-year risk equations.
Setting:Computer-based simulation analysis.
Participants:Data were generated by simulation
using prespecified variable ranges.
Intervention:Data simulation and visual display of
the hazard analysis.
Main outcome measures:Interactions of age with
other variables were analysed using multidimensional visualisation and hazard analysis.
Results:In African–American females, due to the
interaction of age with HDL-C, treated BP and untreated BP, increasing age may not always increase 10-year risk. Furthermore, in the same cohort, increasing HDL-C level may result in higher 10-year risk for older individuals. For Caucasian females, due to square of Ln (age) term in the equation, the age-risk curve does not monotonically increase with age. The vertex is within the given age range of 40–79 years for a certain range of total-C and HDL-C, indicating that age may not always result in increased predicted 10-year risk.
Conclusions:The new pooled cohort equations are
sophisticated as they take into account the interactions of the continuous variables in predicting 10-year risk. We find situations where the estimated 10-year risk does not follow the general secular trends. The impact of such interesting patterns may be substantial and therefore further exploration is needed as it has direct implications in clinical management for primary prevention.
INTRODUCTION
The recent guidelines for prevention of ath-erosclerotic cardiovascular disease (ASCVD)
events using the new pooled cohort equa-tions for 10-year risk calculation and subse-quent management strategies are expected to have a major impact on clinical practice
and public policy.1 2For the primary
preven-tion, the risk equations were formulated
based on five contemporary longitudinal
epi-demiological studies with subsequent
internal and external validation.1
Gender-specific and race-specific
propor-tional hazards models were used to develop risk estimates. These models included covari-ates of age, treated or untreated systolic
Strengths and limitations of this study
▪ Our paper provides a novel approach for under-standing complex equations. With increasing emphasis on evidence-based medicine, these complexities are more likely to be encountered on a routine basis. Our paper outlines a visual approach for understanding these complex math-ematical equations that may not be readily appar-ent to clinicians or researchers.
▪ On the basis of our analysis of the risk equa-tions, we find certain unexpected behaviours/ paradoxes in the risk equations. This aspect is most pronounced in Caucasian females where the age-risk curve is parabolic, indicating that for certain values of the variables, the relationship of 10-year risk with age is uncertain. This has direct implications in clinical management for primary prevention in this population grouping. Our paper therefore highlights aspects of the risk equations that are not readily apparent and pro-vides a rationale for further refinement of these equations in the future.
▪ We performed the simulation based on the pooled cohort equations and range of allowable input values for the variables. The study was limited in that we did not have access to the clin-ical data set that formed the basis of formulation of the new pooled cohort risk equations for esti-mating 10-year risk.
on September 22, 2020 by guest. Protected by copyright.
blood pressure (SBP), total cholesterol (total-C),
high-density lipoprotein cholesterol (HDL-C), current
smoking and diabetes. The final model also contained
the interactions of age with other variables that are
sig-nificant. Receiver operating curve for discrimination and
calibration χ2 statistics were performed to evaluate the
model’s goodness of fit. When the risk equations were
applied to National Health and Nutrition Examination
Surveys (NHANES, 2007–2010), approximately 45% of
the population (or 45 million people) between the ages
of 40 and 79 years had 10-year risk of 5% or more.1
Based on the guidelines, this substantial population
would be considered eligible for statin therapy.2
There have been concerns about the robustness of risk estimates using the new pooled cohort equations. The authors of the guidelines have noted that there is overprediction of events in all the external validation
groups.1Consistent with these observations in the
guide-lines, analysis by Ridker and Cook,3 who calculated the
10-year ASCVD risk using the same equations but differ-ent population cohorts, found that the new pooled cohort equations systematically overestimated the 10-year risk. Another concern that has been raised was that the older population virtually exceeded the threshold limits
for statin therapy regardless of other risk factors.2 3
Pencina et al4 recently reported that the number of
adults eligible for statin therapy based on the new 10-year risk guideline would increase by 12.8 million; these were mainly older adults without cardiovascular disease.
Owing to the interactions of age with other variables in the risk equations, the impact magnitude of each vari-able on the 10-year risk estimation is not immediately obvious. To better understand the pattern of the pre-dicted 10-year risk with change of each variable, we eval-uated the individual and interacting impacts of age, total-C, HDL-C and SBP on the estimated 10-year risk for different cohorts.
MATERIALS AND METHODS
Using the age range of 40–79 years, total-C range 130–
320 mg/dL, HDL-C 20–100 mg/dL and SBP 90–
200 mm Hg, as defined in the guideline, simulations
were performed on the pooled cohort equations to
esti-mate 10-year risk for African–American males and
females, and Caucasian males and females, respectively, in Matlab (2013b, MathWorks, Massachusetts, USA). The HRs for each individual variable and interaction term of
the equations were computed as eβ, where β was the
coefficient of the term provided in the online
supple-mentary appendix 4 of the guidelines.1 5
Interactions of age with other variables were analysed using the HR and further visualised using Matlab visual-isation tool (2013b, MathWorks, Massachusetts, USA). Simulation was performed according to the risk equa-tion for each cohort, by varying one variable of interest
at a time, while fixing all the other variables. All
variables were ranged within the limits defined by the
guideline. For African–American females, there were
sig-nificant interactions of age with HDL-C and SBP. With
fixed total-C, simulation was performed by varying age,
HDL-C and SBP, respectively. Three-dimensional
colour-codedfigures incorporating age, HDL-C, SBP and
simu-lated 10-year risk were plotted. For Caucasian males and
females, age was significantly interacting with total-C,
HDL-C and current smoking status. With fixed SBP,
simulation was performed by varying age, HDL-C and total-C, respectively. Three-dimensional colour-coded
figures incorporating age, total-C, HDL-C and simulated
10-year risk were plotted for smokers and non-smokers,
respectively. Since there were no variables significantly
interacting with age in the African–American males
cohort, the impact of each variable to the estimated
10-year risk was straightforward, based on its coefficient.
Therefore, interaction analysis is not provided for this cohort in the current study.
RESULTS
The coefficient and HR of each variable itself and its
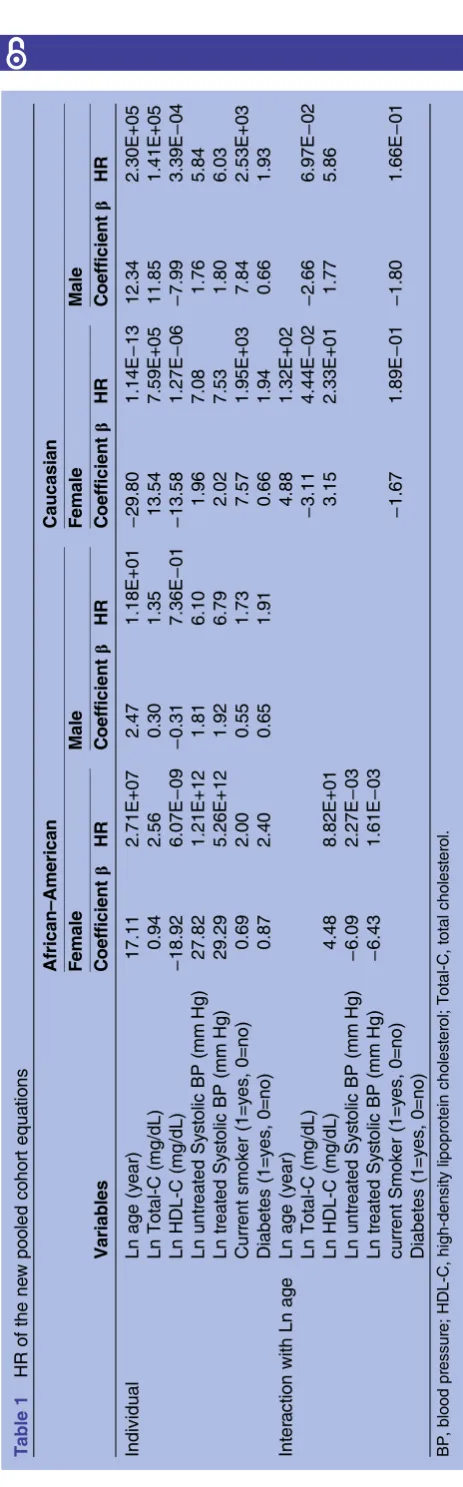
interaction with age (if available) in the new pooled cohort equation for each population is presented in table 1.
For African–American females, individual SBP
(treated or untreated) has the highest HR to the esti-mated 10-year risk, indicating the biggest impact to
10-year risk among all variables. However, SBP signifi
-cantly interacted with age in a negative fashion
(untreated β=−6.09; treated β=−6.43). Considering that
age also significantly interacted with HDL-C in a positive
fashion (β=4.48), in cohorts with higher HDL-C levels,
SBP per unit has a higher impact to the 10-year risk in older age compared with younger age (indicated by
black arrows in figure 1). This pattern was reversed in
cohorts with lower HDL-C level, where SBP per unit has a lower impact to the 10-year risk in older age than
younger age (indicated by blue arrows in figure 1).
Furthermore, age by itself had the second highest impact to the estimated 10-year risk (table 1) compared with SBP. Owing to the interaction with SBP and HDL-C, in cohorts with lower HDL-C level and higher SBP, we noted paradoxical behaviour where older age had a lower estimated risk compared with younger age, as
indi-cated by the dashed red arrow in figure 2. Boundary
limits to observe this behaviour shifted for different total-C level and smoking or diabetes status. For example, for the non-diabetic, non-smoking population cohort with total-C of 130 mg/dL, when HDL-C was
around 20 mg/dL and SBP was above 155–160 mm Hg,
the 10-year risk was decreasing with ageing. As HDL-C increased, this inconsistent behaviour was only noted at higher SBP level. As HDL-C levels reached above 30 mg/ dL, the behaviour was no longer observed within the
vari-able ranges defined in the guideline. Another interesting
observation we made for this cohort was related to the
on September 22, 2020 by guest. Protected by copyright.
relationship of HDL-C and estimated 10-year risk. HDL-C
by itself had a negative impact on 10-year risk (β=−18.92),
that is, increasing HDL-C generally resulted in lower 10-year risk. However, due to the interaction with age, when age was >69 to70 years, increasing HDL-C would paradoxically increase 10-year risk (indicated by dashed
green arrow infigure 3).
Table 1 HR of the ne w pooled cohort equa tions African – American Caucasia n Female Male Female Male V ariables C oefficient β HR C oefficient β HR C oefficient β HR C oefficient β HR Individual L n age (y ear) 17.11 2.71E+07 2.47 1.18E+01 − 29.80 1.14E − 13 12.34 2.30E+05 Ln T otal-C (mg/dL) 0.94 2.56 0.30 1.35 13.54 7.59E+05 11.85 1.41E+05 Ln HDL-C (mg/dL) − 18.92 6.07E − 09 − 0.31 7.36E − 01 − 13.58 1.27E − 06 − 7.99 3.39E − 04 Ln untr ea ted Sy s tolic BP (mm Hg) 27.82 1.21E+12 1.81 6.10 1.96 7.08 1.76 5.84 Ln tr ea ted Sy s tolic BP (mm Hg) 29.29 5.26E+12 1.92 6.79 2.02 7.53 1.80 6.03 Curr ent smok er (1=y es, 0=no) 0.69 2.00 0.55 1.73 7.57 1.95E+03 7.84 2.53E+03 Diab etes (1=y es, 0=no) 0.87 2.40 0.65 1.91 0.66 1.94 0.66 1.93 Inter a ction with Ln age Ln age (y ear) 4.88 1.32E+02 Ln T otal-C (mg/dL) − 3.11 4.44E − 02 − 2.66 6.97E − 02 Ln HDL-C (mg/dL) 4.48 8.82E+01 3.15 2.33E+01 1.77 5.86 Ln untr ea ted Sy s tolic BP (mm Hg) − 6.09 2.27E − 03 Ln tr ea ted Sy s tolic BP (mm Hg) − 6.43 1.61E − 03 cu rr ent Smok er (1=y es, 0=no) − 1.67 1.89E − 01 − 1.80 1.66E − 01 Diab etes (1=y es, 0=no) BP , blood pr ess ur e; HDL -C, high-d ensity lipopr otein cho les ter ol; T otal-C, total chol es ter ol.
Figure 1 Illustration of interaction among age, systolic blood
pressure (BP) and high-density lipoprotein cholesterol (HDL-C) in terms of their combined impact to 10-year risk. Systolic BP per unit has a bigger impact on the 10-year risk in older individuals ( ) than younger individuals ( ) at higher HDL-C levels. This pattern reverses at lower HDL-C levels, that is, systolic BP per unit has a bigger impact on the 10-year risk in young individuals ( ) than in older individuals ( ) at low HDL-C levels. Note that smoking status, diabetic status and total cholesterol levels are independent variables in the African–American female cohort—changing these variables would not affect the interaction pattern of systolic BP, age and HDL-C; a similar pattern holds true for treated systolic BP.
Figure 2 Illustration showing that when individuals have
high-density lipoprotein cholesterol (HDL-C) around 20 mg/dL and systolic blood pressure (BP) above 155–160 mm Hg, predicted 10-year risk would decrease with ageing ( ). As HDL-C level increases, similar scenarios would only hold true at higher systolic BP level. However, when HDL-C is above 30 mg/dL, ageing would increase 10-year risk regardless of systolic BP levels ( ).
on September 22, 2020 by guest. Protected by copyright.
For Caucasian females, an intriguing aspect of the cohort equation was the use of square of Ln (age) term, which was not present for any other cohorts. Owing to square of Ln (age) term, the predicted risk did not always follow conventional rules and increasing age may not always be associated with increasing risk. In general, the age-risk curve did not monotonically increase with age. Instead, the predicted 10-year risk decreased with increasing age until it reached a minimum, and then
increased again. Since age also significantly interacted
with total-C (β=−3.11) and HDL-C (β=3.15), this
rela-tionship was not apparent within the given age range for
all total-C or HDL-C levels. Figure 4A (non-smoker) and
B (smoker) illustrate examples of this relationship between age and 10-year risk at a range of total-C levels at SBP=90 mm Hg and HDL-C=20 mg/dL for non-smokers and 30 mg/dL for non-smokers. In general, the
minimum (indicated by the black arrow infigure 4C,D)
of the paradoxical relationship would be within the
given age range for HDL-C<25 mg/dL and
Figure 3 Illustration showing that when age of individuals is
above 69–70 years, increasing HDL-C will increase the estimated 10-year risk ( ); when age is below 68 years, increasing HDL-C will decrease the estimated 10-year risk ( ), (BP, blood pressure; HDL-C, high-density lipoprotein
cholesterol).
Figure 4 Depiction of the interaction of age with other variables on the predicted 10-year risk in White female cohort that are
non-diabetic, on no treatment for hypertension and systolic BP of 90 mmHg. (↓) A (non-smoker) and B (smoker) illustrate the non-linear relationship between age and 10-year risk at various total-C levels when SBP is 90 mmHg and HDL-C is 20 mg/dL for non-smoker and 30 mg/dL for smoker. C (non-smoker) and D (smoker) depict that the minimum ( pointed out by arrow) of the paradoxical relationship is within the given age range when HDL-C<25 mg/dL and total-C≥200 mg/dL for non-smokers and HDL-C≤50 mg/dL and total-C≥150 mg/dL for smokers. Note that, diabetes and systolic BP level are independent variables in female White cohort, changing these variables would not affect the interaction pattern of age, total-C and HDL-C; similar pattern holds true for treated systolic BP. Total-C, total cholesterol; HDL-C, high-density lipoprotein cholesterol; BP, blood pressure.
on September 22, 2020 by guest. Protected by copyright.
total-C≥200 mg/dL for non-smokers (figure 4C) and
HDL-C≤50 mg/dL and total-C≥150 mg/dL for smokers
(figure 4D).
For African–American males and for Caucasian males,
we did not observe any paradoxical patterns of the risk equations within the proposed ranges for the variables.
For African–American males, none of the variables had
significant interaction with age in thefinal model;
there-fore, the impact of each variable to the 10-year risk was
clearly indicated by their coefficients and HRs. For
Caucasian males, age had significant interaction with
total-C, HDL-C and current smoking status, as described intable 1.Figure 5demonstrates the interactions of age, total-C and HDL-C in non-smokers (A) and smokers (B) in terms of their combined impact to the 10-year risk. No paradoxical patterns were observed in this cohort with variable ranges.
DISCUSSION
Our analysis of the new pooled cohort risk equations highlights important aspects that are of direct clinical relevance. These include:
A. For African–American females, increased age may
not always result in increased 10-year risk.
Furthermore, increasing HDL-C level may result in higher 10-year risk for older age.
B. For Caucasian females, the age and 10-year risk rela-tionship is parabolic and the vertex is within the
given age range of 40–79 years for a certain range of
total-C and HDL-C levels. This implies that age may not always result in increased predicted 10-year risk. The new pooled cohort equations for risk estimation are critical to the new preventive guidelines for ASCVD
events.1 2 Based on the hazard analysis and visualisation,
age may not always be the predominant risk factor contrib-uting to estimated 10-year risk. Other variables also make an important contribution to the overall 10-year risk.
Moreover, for all the cohorts except African–American
males, age has multiple interactions with other risk vari-ables. Therefore, estimated 10-year risk should be inter-preted in the appropriate clinical context.
Our analyses also find interesting patterns of the
pro-posed risk equations. There are situations when increase in age paradoxically results in lower 10-year risk while other variables remain the same. The impact of these anomalies is most profound in Caucasian females who smoke, where a substantial number may be in a region of the 10-year risk estimates where the calculated risk values are counter to the currently accepted concepts of ASCVD risk evolution and age. Many of these females will be at the boundary limits of 5% and 7.5% 10-year risk and therefore be subject to greater uncertainties regarding
statin therapy. We also find that the robustness of the
pooled cohort equations fails for African-American
females with HDL-C <30 mg/dL, SBP >150–160 mm Hg
who are older than 70 years of age. The baseline
esti-mated 10-year risks for these individuals are≥10% once
values of other parameters are incorporated. Therefore, these affected individuals are well beyond the current boundary limit of 7.5% for aggressive medical therapy.
However, Downset al6have recently proposed this
thresh-old may be low and suggested a risk level of 10% or 15%
and above for statin treatment. Our finding of
paradox-ical pattern in the affected African-American females cohort would be an important issue for deciding medical therapy in such situations and may need to be addressed in future updates of the risk calculator.
We performed the simulation based on the pooled cohort equations and range of allowable input values for the variables. We did not have access to the clinical data set that formed the basis of formulation of the new pooled cohort risk equations for estimating 10-year risk. Despite this limitation, this does not negate our observa-tions, as the intent of the new guidelines is to incorpor-ate the risk calculator in clinical practice based on the
methods and coefficients described in the guidelines.
Figure 5 Depiction of the interactions of age with other
variables on the predicted 10-year risk in members of the White male cohort who are non-diabetic, on no treatment for hypertension and who have a systolic blood pressure (BP) of 90 mm Hg, and who are non-smokers (A) and smokers (B). No paradoxical patterns were observed in this cohort with variable ranges. Note that diabetes and systolic BP level are independent variables in this White male cohort—changing these variables would not affect the interaction pattern of age, total cholesterol (total-C) and high-density lipoprotein
cholesterol (HDL-C); a similar pattern holds true for treated systolic BP.
on September 22, 2020 by guest. Protected by copyright.
In conclusion, the new pooled cohort equations for 10-year risk estimation have predictable behaviour con-sistent with ASCVD disease pathophysiology in most instances. Nevertheless, there are certain important exceptions where the results obtained from the risk equations are surprising. These patterns need further investigation.
AcknowledgementsThe authors thank Matthew C Schiros for his review and
proofreading of the manuscript.
Contributors CGS and HG were responsible for the conceptualising,
designing, drafting and finalising of the manuscript. CGS and TSD were responsible for the multidimensional visualisation analysis. All authors were responsible for the revising of the manuscript critically for important intellectual content, and gave approval for the final version.
Funding This research received no specific grant from any funding agency in
the public, commercial or not-for-profit sectors.
Competing interests None.
Provenance and peer review Not commissioned; externally peer reviewed.
Data sharing statement No additional data are available.
Open Access This is an Open Access article distributed in accordance with
the Creative Commons Attribution Non Commercial (CC BY-NC 4.0) license, which permits others to distribute, remix, adapt, build upon this work non-commercially, and license their derivative works on different terms, provided the original work is properly cited and the use is non-commercial. See: http:// creativecommons.org/licenses/by-nc/4.0/
REFERENCES
1. Goff DC, Lloyd-Jones DM, Bennett G,et al. 2013 ACC/AHA Guideline on the Assessment of Cardiovascular Risk: A Report of the American College of Cardiology/American Heart Association Task Force on Practice Guidelines.Circulation2014;129(25 Suppl 2):S49–73. 2. Stone NJ, Robinson J, Lichtenstein AH,et al. 2013 ACC/AHA
Guideline on the Treatment of Blood Cholesterol to Reduce Atherosclerotic Cardiovascular Risk in Adults: A Report of the American College of Cardiology/American Heart Association Task Force on Practice Guidelines.Circulation2014;129(25 Suppl 2):S1–45. 3. Ridker PM, Cook NR. Statins: new American guidelines for
prevention of cardiovascular disease.Lancet2013;382:1762–5. 4. Pencina MJ, Navar-Boggan AM, D’Agostino RB,et al. Application of
new cholesterol guidelines to a population-based sample.N Engl J Med2014;370:1422–31.
5. Cox D. Regression models and life tables.J R Stat Soc1972;34 (series B):187–220.
6. Downs J, Good C. New cholesterol guidelines: has Godot finally arrived?Ann Intern Med2014;160:354–5.
on September 22, 2020 by guest. Protected by copyright.