http://www.sciencepublishinggroup.com/j/ajpst doi: 10.11648/j.ajpst.20170305.11
ISSN: 2575-5978 (Print); ISSN: 2575-5986 (Online)
Pectin-Chitosan Polyelectrolyte Complex Nanoparticles for
Encapsulation and Controlled Release of Nisin
Hui Wang
*, Bo Yang, Hongyuan Sun
Department of Food Science and Technology, Hainan Tropical Ocean University, Sanya, China
Email Address:
[email protected] (Hui Wang) *Corresponding author
To cite this article:
Hui Wang, Bo Yang, Hongyuan Sun. Pectin-Chitosan Polyelectrolyte Complex Nanoparticles for Encapsulation and Controlled Release of Nisin. American Journal of Polymer Science and Technology. Vol. 3, No. 5, 2017, pp. 82-88. doi: 10.11648/j.ajpst.20170305.11
Received: October 3, 2017; Accepted: October 19, 2017; Published: November 8, 2017
Abstract:
Nisin is a broad spectrum antimicrobial effective against Gram-positive bacteria. Antibacterial activity of Nisin is reduced when it is applied in food, due to binding with food matrix components. Encapsulation of Nisin in pectin-chitosan polyelectrolyte complex was prepared to protect Nisin from losing efficacy. Systematically, a number of parameters, pectin degree of esterification (DE), m (PE): m (CHI) mass ratio and solution pH were explored and their effect on the formation ofstable polyelectrolyte nano complex colloid between pectin (PE) and chitosan (CS) was determined. Electrostatic interactions between carboxyl groups on pectin and amino groups on chitosan are confirmed by FTIR. The effects of DE of pectin on Nisin-loaded encapsulation properties were studied. Nanocapsules prepared by low methoxyl pectin (LPE) had higher encapsulation efficiency (EE) and loading capacity (LC) with smaller particle size, compared with those prepared by high methoxyl pectin (HPE). The largest EE is 65.9% when m (LPE): m (CHI) ratio was 20:15 and Nisin was 7 mg. Increasing
amount of Nisin had a tendency to form nanocapsules with lower EE and higher LC and particle size. Release profile of Nisin from nanocapsules was affected by pH, more amounts of Nisin released at pH 3 than at pH 6. Encapsulated Nisin showed more active antibacterial activities against S. aureus than free Nisin. Encapsulation offers great promise to improve antibacterial
effectiveness of Nisin.
Keywords: Polyelectrolyte Complex, Nisin, Pectin, Nanocapsules, Chitosan, Degree of Esterification
1. Introduction
Nisin, a small peptide of 34 amino acids with a molecular weight of 3510 Daltons, is produced by Lactococcus lactis
subspecies lactis. Nisin has broad spectrum antimicrobial
activities against Gram-positive bacteria and is considered as Generally recognized as Safe (GRAS), has been approved its use in foods as a bacteriocin [1, 2]. However, antibacterial efficacy of Nisin is weakened when it is used in food, due to its binding and interaction with food matrix components that makes the antimicrobial unavailable to control food microorganisms [3, 4]. Encapsulation of Nisin into micro/nano particles can protect Nisin from interacting with food components. Moreover, controlled release of nisin from micro/nano particles to improve its antibacterial properties in foods can be achieved [5-7]. The studies of Nisin in liposome [8-10] and biopolymers like zein [11, 12], cellulose [13],
alginate [14] and poly (lactic acid) [15, 16], which have been explored for making micro particles and films for controlled release of Nisin, have been reported. Nanocapsules of Nisin by polyelectrolyte complexes have shown potential in food technology realms [17-19].
acid which can be partially methyl esterified. According to degree of esterification (DE), pectins are divided into low methoxyl pectin (LPE, DE < 50%) and high methoxyl pectin (HPE, DE > 50%) [24, 25]. Chitosan and pectin can complex by electrostatic attraction, which is often applied in the controlled release of active materials and in the preparation of membranes and microspheres with pH sensitive properties [26-28]. Charge density in macromolecules significantly affects the final complexes [29, 30], therefore pectin molecular chain with different DE affect complexation with chitosan due to different number of negative ions.
Usually, there is a narrow window of physicochemical conditions where the nano complexes are formed and stay in solution. Beyond these conditions, polyelectrolyte complex appear to form flocculation [31, 32]. PEC formation has previously been reported to be affected by the ratio of pectin to chitosan, i.e. the molar ratio of anionic to cationic groups of the polysaccharides and the pH of the solutions [26]. DE of pectin has also been shown to be a determining parameter in PEC formation [33]. In this work, the preparation condition of forming stable nano complex colloidal particles by chitosan and pectin with different degree of esterification were studied. Nisin-loaded pectin-chitosan nanocapsules were prepared and the effects of DE of pectin on encapsulation properties were studied. The nanocapsules were evaluated for in vitro release of Nisin and for
antibacterial properties.
2. Materials and Methods
Nisin was from Zhejiang Silver-Elephant Bio-engineering Co., LTD (Zhejiang province, China). Other reagents were analytical grade.
2.1. The Effect of m (PE): m (CHI) Ratio on the Stability of PE-CHI Complex Colloid
High methoxyl pectin (HPE, 66-72% DE) and low methoxyl pectin (LPE, 30-40% DE) were used as negatively charged pectin (Quzhou Pectin CO., Zhejiang, China) to interact with positively charged chitosan (molecular weight of 4×10⁵, degree of acetylation of more than 95%, Qiyun Biotechnology Co., Guangdong, China). The pectin solution (1 mg/mL) and 1 mg/mL chitosan solution of acetic acid (1% (w/v)) were prepared and adjusted pH to 5. Pectin solution was added to chitosan solution while stirring at room temperature, and the changes of the system in the process of complex formation were observed. The conditions to form a stable dispersion were determined.
2.2. The Effect of pH on the Stability of PE-CHI Complex Colloid
The pectin solution (1 mg/mL) and chitosan solution of acetic acid (1 mg/mL) were mixed in a certain ratio, pH of the mixture was adjusted to 10. The absorbance of the solution was measured at 500 nm by UV-VIS spectrophotometer (Shimadzu, Japan) with the change of pH.
No absorbance of pectin and chitosan solutions was recorded at this wavelength.
2.3. Preparation of Nisin Nanocapsules with PE-CHI Complex
Two-step method was used to prepared Nisin nanocapsules. The pectin solution (1 mg/mL) and 1 mg/mL chitosan solution of acetic acid (1% (w/v)) were prepared and adjusted pH to 5. Various amounts of Nisin (Zhejiang Silver-Elephant Bio-engineering Co., Zhejiang, China) solution (10 mg/mL) was added drop-wise to 25 mL pectin solution and stirred for 30 min. The obtained pectin solution was added to 25 mL chitosan solution at 1: 1 of m (PE): m (CHI) ratio and stirred
for additional one hour. The nanoparticles were separated by centrifugation, washed 3 times with distilled water and freezing-dried.
2.4. Nisin Loading Capacity and Encapsulation Efficiency
The Nisin loading capacity and encapsulation efficiency were determined after complete degradation of nanocapsules in diluted HCl solution. The supernatant obtained after centrifugation was used for determining the residual Nisin content. The Nisin loading capacity and encapsulation efficiency were calculated according to the following equations, respectively:
Loading capacity (LC) = (The amount of Nisin in the nanocapsules/Total amount of nanocapsules weight)×100%
Encapsulation efficiency (EE) = (The amount of Nisin in the nanocapsules/Total amount of Nisin)×100%
The Nisin content was assayed by HPLC (LC-10A, Japan). A silica based C-18 reversed-phase column, with a particle diameter of 5µm and dimensions of 150 mm × 4.6 mm I.D was used. Nisin concentration in the solution was calculated by preparing a standard curve for various Nisin concentration.
Nisin was dissolved in pH 2 water and further dilutions were made to obtain a standard concentration in the range of 5 to 125 µg/mL. 50 µl samples were injected into HPLC System. Water and acetonitrile solution, both containing 0.1% TFA were used as mobile phase. A gradient of 20-60% acetonitrile at a flow rate of 1 ml/min over 20 minutes was maintained. UV detection for Nisin was set at 254 nm wavelength. A calibration curve (Figure 1) was constructed for standard Nisin solutions.
Figure 1. The standard curve of Nisin.
y = 6419.2x - 4976.4
R2 = 0.9967
0 100000 200000 300000 400000 500000 600000 700000
0 20 40 60 80 100 120
Concentration of Nisin(μg/mL)
P
e
a
k
a
r
e
2.5. Particle Size Measurement
Particle size was determined by using a Malvern Mastersizer 2000, equipped with Malvern application software version 4.00 (Mastersizer 2000, Malvern Instruments Ltd., UK). The instrument is based on the principle of laser light-scattering and capable of measuring size down to 0.01 µm.
2.6. FTIR Measurement
Dried samples were ground with KBr in 1:20 ratio, pressed into pellets and measured by FTIR spectrometer (IRAffinity– 1, Japan). The samples were scanned over a range of 400 cm -1 - 4000 cm-1 (30 scans).
2.7. In Vitro Nisin Release Studies
Approximately 10 mg of Nisin nanoencapsules were dispersed in 5 mL of 0.1 M phosphate buffer solution, then transferred to the dialysis bags with cut-off molecular weight of 14000 Da. The bag was then sealed and placed in conical flask with lid containing 50 mL phosphate buffer (pH 3 or pH 6). The flask was shaken continuously at 100 rpm on an orbital shaker in an incubator at 25°C. Samples of 1 mL were withdrawn with sterile pipette periodically and replaced with corresponding fresh phosphate buffer. The amount of Nisin released was quantified by HPLC.
2.8. Antibacterial Properties of Nisin Nanocapsules
Staphylococcus aureus was incubated in beef
extract-peptone mediun at 37°C with a level of 108 CFU/mL. After dilution to 105 CFU/mL, free Nisin and Nisin nanocapsules were added at Nisin concentration of 0.5 mg/mL, vortexed and incubated at 25°C. The samples were taken at a certain time interval and optical density (OD) at 600nm was measured on UV-visible spectrophotometer. Preliminary test showed that minimum inhibitory concentration (MIC) of Nisin was 0.5 mg/mL.
3. Results and Discussion
3.1. The Effect of m (PE):m (CHI) Ratio on the Stability of PE-CHI Complex Colloid
Polyelectrolyte complexes are produced by electrostatic interactions between oppositely charged polyelectrolytes. The charges of the formed PECs play a significant role on the PECs stability. When the interaction occurs on the stoichiometric ratio of anionic to cationic groups at the point of zero charge, the non-charged PECs are easy to flocculate. On the other hand, the interaction occurs at charge inequivalent ratios, causing each PEC to carry an excess charge. Because particles with same charges repel each other, flocculation of complex particles was hampered and stable colloidal dispersion was formed.
Table 1. The effect of m (PE):m (CHI) ratio on the stability of complex system.
m (PE): m (CHI) 1: 10 1: 5 1: 2 1: 1 3: 2 2: 1
HPE √ √ √ √ √ ×
LPE √ √ √ √ × ×
√ indicates stable complex colloid dispersion; × indicates coagulation of complex colloid.
Table 1 presents the change of complex system when pectin was dropped into chitosan solution. Stable colloidal dispersion was formed in certain ratio range of m (PE): m (CHI), beyond this range, colloidal dispersion flocculated.
When positively charged amino groups of chitosan completely interacted with the negatively charged carboxylic groups on pectin molecular chains at a certain m
(PE): m (CHI) ratio, hydrophobic polyelectrolyte
complexes were generated, leading to flocculation. When lesser amounts of pectin were added to much of chitosan, many unreacted amino groups surrounded outside the core of complex to form hydrophilic shell. With increasing amount of pectin, unreacted amino groups decreased and positive charges outside colloid particles decreased, thus phase separation occurred at certain m (PE): m (CHI) ratio. Colloid
particles coagulated at 2: 1 of m (HPE): m (CHI), while
coagulated at 3: 2 of m (LPE): m (CHI). The results show
that different charge density in pectin molecular chain affects the formation of polyelectrolyte complexes, because the LPE molecules have more carboxylic groups than HPE, fewer amount of LPE were needed to completely interact with chitosan.
3.2. The Effects of pH on the Stability of PE-CHI Complex Colloid Dispersion
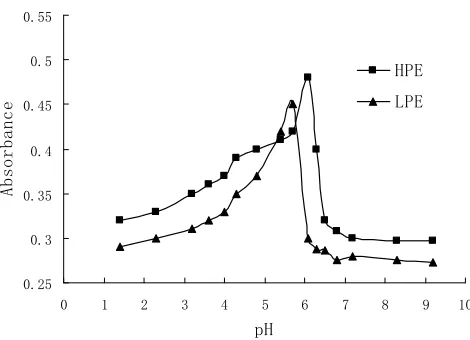
Figure 2. The effect of pH on absorbance of PE-CHI complex solution.
Figure 2 is the absorbance values of solution varying with the decrease of pH at 1: 1 of m (PE): m (CHI) ratio. The
absorbance values increase with the increasing of the turbidity of solution. It shows that the absorbance of system had almost no change in alkaline solution, however, the absorbance increased sharply when pH decreased to a certain value. The flocculation of complex leaded to large absorbance. This may be explained that protonation of CHI
0.25 0.3 0.35 0.4 0.45 0.5 0.55
0 1 2 3 4 5 6 7 8 9 10
pH
A
b
s
o
r
b
a
n
c
e
amino groups increased when pH deceased, and the electrostatic interaction between amino groups and carboxylic acid became stronger and stronger, finally achieved full complexation. With pH further decreased, dissociation of carboxylic acid decreased, negative charge density decreased, which leaded to partial dissociation of complex particles and absorbance of solution decreased. This phenomenon means that the aggregated complexes were reversible. The pH value at the maximum absorbance for HPE was larger than LPE. The maximum absorbance for HPE was at pH 6.1, and for LPE was at pH 5.7.
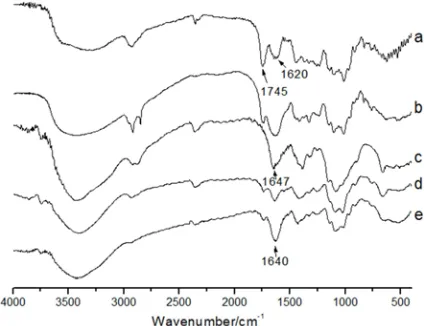
3.3. FTIR Analysis of PE-CHI Complex
A general review of the FTIR spectra of HPE, LPE, CHI, HPE-CHI and LPE-CHI are shown in Figure 3. The obtained spectral data were analyzed by comparing the following characteristic regions: O-H stretching (3100 ~3600 cm-1), C-H stretching (2800 ~3000 cm-1), carboxylic group stretching region (1200 ~1800 cm-1) and C-O stretching (1000 ~1300 cm-1), which reflects the monosaccharide composition of the pectin. Two peaks at 1745 and 1620 cm-1 in the carboxylic groups region assigned to the C=O stretching of methylated carboxyl groups, and to anti-symmetric stretching modes of COO-, respectively. The spectrum of HPE and LPE reveal that a decrease of 1745cm-1 band and increase of 1620 cm-1 band were related to the decrease of pectin DE, thus the area ratio of these two absorption peaks can indicate the DE. The infrared analysis of the PE-CHI complex samples revealed some changes occurred. N-H stretching of CHI was in 1647 cm-1, and it shifted to lower wavenumber to 1640 cm-1 in PE-CHI, a decrease of 1745 cm-1 band and disappear of 1620 cm -1 band demonstrate that electrostatic interactions occurred in
PE-CHI complex [34, 35].
Figure 3. FTIR spectrum of a) HPE; b) LPE; c) CHI; d) HPE-CHI; e) LPE-CHI.
3.4. Encapsulation Properties of Nisin Nanocapsules
The effect of added Nisin amount on encapsulation properties of Nisin nanocapsules is shown at table 2. Nanocapsules prepared by LPE-CHI had higher EE and LC with smaller particle size, compared with those prepared by HPE-CHI. Nanocapsules had a lower EE and higher LC and particle size with increasing amount of added Nisin. This can be explained that fewer Nisin molecules were in solution when less Nisin were added,which increased difficulties for polyelectrolyte complex to catch Nisin during the formation of nancapsules and resulted in lower Nisin encapsulation efficiency. The LPE-CHI prepared nanocapsules had the largest EE 65.9% when 7 mg Nisin were added. There were so much Nisin molecules in solution when 10 mg Nisin was added that polyelectrolyte complexes were not enough to encapsulate them and EE became lower.
Table 2.The effect of added Nisin amount on encapsulation properties of Nisin nanocapsules (m (PE): m (CHI) ratio=1: 1, pH=5).
Added Nisin amount (mg)
LPE-CHI HPE-CHI
EE LC Size (nm) EE LC Size (nm)
4 60.1±5.3 37.9±3.5 302±24 52.4±4.4 30.5±2.8 380±24
7 65.9±6.1 41.6±3.9 436±31 56.2±3.9 33.3±2.7 503±36
10 54.7±4.8 49.1±4.1 655±39 42.3±3.7 37.8±3.2 712±51
3.5. FTIR Analysis of Nisin Nanocapsules
Figure 4 shows the FTIR spectra of LPE-CHI, Nisin and Nisin-LPE-CHI. The main characteristic absorption peaks of Nisin are at 1630 cm-1和1539 cm-1, which assigned to amide group and bending of primary amines. The appearance of these two peaks in the spectra of Nisin loaded nanocapsules demonstrates the encapsulation of Nisin. The resulting peaks could be seen to be from simple superposition of their separated components in the infrared spectra. Spectral analysis indicated that the specific functional groups of Nisin in the nanocapsule surface have almost the same chemical characteristics as that of Nisin. The study suggests that molecular interactions that could alter the chemical structure of the Nisin did not occur, and therefore, no chemical interaction between functional group of Nisin and polymer
exist [18].
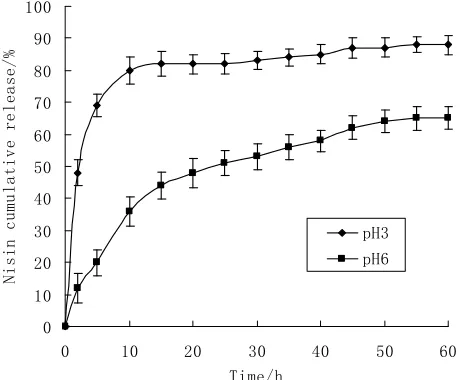
3.6. Nisin Release from Nanocapsules
The Nisin cumulative release from nanocapsules at pH 3 and pH 6 are shown in Figure 5. The results showed that there was an initial burst effect followed by a subsequent release of Nisin. The initial burst may be attributed to presence of Nisin at or near the surface of nanocapsules. After the initial burst effect, there was a prolonged release of nisin in the releasing media because of the increased diffusion distance in polymer matrix [18, 36]. The medium pH has a great impact on Nisin release. Nisin released faster at pH 3 than at pH 6, and more amounts of nisin were released at pH 3. The cumulative release of Nisin was 85% at pH 3 in 10 h, followed by no significant increase in later time. At pH 6, the release of Nisin reached balance in 50 h, and the cumulative release of Nisin was 64%. At pH 3, both Nisin and polyelectrolyte composites are positively charged, and the electronic repulsion facilitates the diffusion of Nisin from particles to the liquid phase. At pH 6, both Nisin and polyelectrolyte composites were more hydrophobic, and the electrostatic interactions between them may cause low release of Nisin through the diffusion effect.
Figure 5. Nisin Release from Nanocapsules at pH 3 and pH 6.
3.7. Antibacterial Properties of Encapsulated Nisin Nanocapsules
Comparison of antibacterial properties of free Nisin and encapsulated Nisin is shown in Figure 6 for S. aureus
incubated in beef extract-peptone mediun at 37°C. Growth curves of S. aureus show that free nisin kept the S. aureus
population at very low level and inhibited the growth of S. aureus throughout 20 h incubation. However, fast growth of S. aureus population treated by free Nisin was observed from
time points of 20 h and longer. Although S. aureus
population of encapsulated Nisin treatment was slightly higher than free Nisin throughout 28 h incubation, S. aureus
population was maintained lower from the time point of 30 h. Because the added Nisin was in minimum inhibition concentration (MIC), and was unable to maintain the inhibition ability with the consumption of Nisin, S. aureus
population gradually recovered and grew fast. At last time point of 40 h, there is only a little difference between free Nisin treatment and the control, while that of encapsulated Nisin treatment was quite lower. The results exhibited better antibacterial properties of encapsulated Nisin than free Nisin. Our work showed an example of Nisin antibacterial delivery system to enhance microbiological food safety but much work is needed to further improve antibacterial properties of Nisin in food.
Figure 6. Growth curve of Staphylococcus aureus incubated in beef extract-peptone medium at 37°C when treated by 0.5 mg/mL free nisin (▲), encapsulated nisin (■), or without nisin (◆).
4. Conclusion
This study shows that Nisin can be encapsulated by pectin-chitosan polyelectrolyte complex. The degree of esterification, m (PE): m (CHI) ratio and pH had effect on the
formation of polyelectrolyte complex colloid particles between chitosan (CS) and pectin (PE). Electrostatic interactions between carboxyl groups on pectin and amino groups on chitosan existed in pectin-chitosan complex. Particle flocculation occurred at balanced charge ratios of the components, whereas with more than cations (CHI), small non-aggregating particles were formed. At pH>6, the amino groups of CHI were less protonated and the remaining protonated groups available for interaction would lead to negative charged PEC, leading to form colloid particles. Decrease of pH value resulted in complex flocculation. It is suggested that strong polymer interactions occur when most side groups of CHI are protonated, resulting in neutral complex. The pH value of PECs flocculation for HPE was larger than LPE. The flocculation for HPE was at pH 6.1, and for LPE was at pH 5.7.
The degree of esterification of pectin had effect on Nisin encapsulation properties. Nisin nanocapsules prepared by LPE had higher EE and LC with smaller particle size, compared with HPE. The studies also show that the added Nisin amount played a role in determining EE, LC and particle size. In vitro release studies demonstrated that Nisin released from nanocapsules faster at pH 3 than at pH 6. Encapsulated Nisin exhibited better antibacterial properties 0
10 20 30 40 50 60 70 80 90 100
0 10 20 30 40 50 60 Time/h
N
i
s
i
n
c
u
m
u
l
a
t
i
v
e
r
e
l
e
a
s
e
/
%
pH3 pH6
0 0.1 0.2 0.3 0.4 0.5 0.6 0.7 0.8
0 5 10 15 20 25 30 35 40
Time/h
O
D
6
0
than free Nisin. Encapsulation is a useful tool for generating nanocapsules to improve antibacterial effectiveness of Nisin.
Acknowledgements
We acknowledge the financial support by the National Natural Science Foundation of China (Grant No. 51363018); Hainan Natural Science Foundation (Grant No. 317153).
References
[1] Zhou H, Fang J, Tian Y, et al. Mechanisms of nisin resistance in Gram-positive bacteria [J]. Annals of microbiology, 2014, 64 (2): 413-420.
[2] Punyauppa-path S, Phumkhachorn P, Rattanachaikunsopon P. Nisin: Production and mechanism of antimicrobial action [J]. International Journal of Current Research and Review, 2015, 7 (2): 47.
[3] Bhatti M, Veeramachaneni A, Shelef L A. Factors affecting the antilisterial effects of nisin in milk [J]. International journal of food microbiology, 2004, 97 (2): 215-219.
[4] Aasen I M, Markussen S, Møretrø T, et al. Interactions of the bacteriocins sakacin P and nisin with food constituents [J]. International journal of food microbiology, 2003, 87 (1): 35-43.
[5] Prombutara P, Kulwatthanasal Y, Supaka N, et al. Production of nisin-loaded solid lipid nanoparticles for sustained antimicrobial activity [J]. Food Control, 2012, 24 (1): 184-190.
[6] Hosseini S M, Hosseini H, Mohammadifar M A, et al. Preparation and characterization of alginate and alginate-resistant starch microparticles containing nisin [J]. Carbohydrate polymers, 2014, 103: 573-580.
[7] da Silva Malheiros P, Daroit D J, da Silveira N P, et al. Effect of nanovesicle-encapsulated nisin on growth of Listeria monocytogenes in milk [J]. Food Microbiology, 2010, 27 (1): 175-178.
[8] da Silva Malheiros P, Sant'Anna V, de Souza Barbosa M, et al. Effect of liposome-encapsulated nisin and bacteriocin-like substance P34 on Listeria monocytogenes growth in Minas frescal cheese [J]. International journal of food microbiology, 2012, 156 (3): 272-277.
[9] Taylor T, Bruce B D, Weiss J, et al. Listeria monocytogenes
and Escherichia coli O157:H7 inhibition in vitro by
liposome-encapsulated nisin and ethylene diaminetetraacetic acid [J]. Journal of food safety, 2008, 28 (2): 183-197.
[10] Imran M, Revol-Junelles A M, Paris C, et al. Liposomal nanodelivery systems using soy and marine lecithin to encapsulate food biopreservative nisin [J]. LWT-Food Science and Technology, 2015, 62 (1): 341-349.
[11] Xiao D, Davidson P M, Zhong Q. Release and antilisterial properties of nisin from zein capsules spray-dried at different temperatures [J]. LWT-Food Science and Technology, 2011, 44 (10): 1977-1985.
[12] Chen H, Zhong Q. A novel method of preparing stable zein nanoparticle dispersions for encapsulation of peppermint oil [J]. Food Hydrocolloids, 2015, 43: 593-602.
[13] Guiga W, Swesi Y, Galland S, et al. Innovative multilayer antimicrobial films made with Nisaplin® or nisin and cellulosic ethers: Physico-chemical characterization, bioactivity and nisin desorption kinetics [J]. Innovative food science & emerging technologies, 2010, 11 (2): 352-360.
[14] Narsaiah K, Jha S N, Wilson R A, et al. Optimizing microencapsulation of nisin with sodium alginate and guar gum [J]. Journal of food science and technology, 2014, 51 (12): 4054-4059.
[15] Ji S, Lu J, Liu Z, et al. Dynamic encapsulation of hydrophilic nisin in hydrophobic poly (lactic acid) particles with controlled morphology by a single emulsion process [J]. Journal of colloid and interface science, 2014, 423: 85-93.
[16] Gharsallaoui A, Joly C, Oulahal N, et al. Nisin as a food preservative: Part 2: Antimicrobial polymer materials containing nisin[J]. Critical reviews in food science and nutrition, 2016, 56 (8): 1275-1289.
[17] Chandrasekar V, Coupland J N, Anantheswaran R C. Characterization of nisin containing chitosan-alginate microparticles [J]. Food Hydrocolloids, 2017, 69: 301-307.
[18] Chopra M, Kaur P, Bernela M, et al. Surfactant assisted nisin loaded chitosan-carageenan nanocapsule synthesis for controlling food pathogens [J]. Food Control, 2014, 37: 158-164.
[19] Bernela M, Kaur P, Chopra M, et al. Synthesis, characterization of nisin loaded alginate–chitosan–pluronic composite nanoparticles and evaluation against microbes [J]. LWT-Food Science and Technology, 2014, 59 (2): 1093-1099.
[20] Van der Gucht J, Spruijt E, Lemmers M, et al. Polyelectrolyte complexes: bulk phases and colloidal systems [J]. Journal of colloid and interface science, 2011, 361 (2): 407-422.
[21] Park M R, Seo B B, Song S C. Dual ionic interaction system based on polyelectrolyte complex and ionic, injectable, and thermosensitive hydrogel for sustained release of human growth hormone [J]. Biomaterials, 2013, 34 (4): 1327-1336.
[22] Tsai R Y, Chen P W, Kuo T Y, et al. Chitosan/pectin/gum Arabic polyelectrolyte complex: Process-dependent appearance, microstructure analysis and its application [J]. Carbohydrate polymers, 2014, 101: 752-759.
[23] Morris G A, Castile J, Smith A, et al. Macromolecular conformation of chitosan in dilute solution: A new global hydrodynamic approach [J]. Carbohydrate Polymers, 2009, 76 (4): 616-621.
[24] Wai W W, Alkarkhi A F M, Easa A M. Effect of extraction conditions on yield and degree of esterification of durian rind pectin: An experimental design [J]. Food and bioproducts processing, 2010, 88 (2): 209-214.
[25] Fellah A, Anjukandi P, Waterland M R, et al. Determining the degree of methylesterification of pectin by ATR/FT-IR: Methodology optimisation and comparison with theoretical calculations [J]. Carbohydrate polymers, 2009, 78 (4): 847-853.
[27] Maestrelli F, Cirri M, Mennini N, et al. Influence of cross-linking agent type and chitosan content on the performance of pectinate-chitosan beads aimed for colon-specific drug delivery [J]. Drug development and industrial pharmacy, 2012, 38 (9): 1142-1151.
[28] Birch N P, Schiffman J D. Characterization of self-assembled polyelectrolyte complex nanoparticles formed from chitosan and pectin [J]. Langmuir, 2014, 30 (12): 3441-3447.
[29] Davidenko N, Blanco M D, Peniche C, et al. Effects of different parameters on the characteristics of chitosan–poly (acrylic acid) nanoparticles obtained by the method of coacervation [J]. Journal of Applied Polymer Science, 2009, 111 (5): 2362-2371.
[30] Bigucci F, Luppi B, Cerchiara T, et al. Chitosan/pectin polyelectrolyte complexes: selection of suitable preparative conditions for colon-specific delivery of vancomycin [J]. European journal of pharmaceutical sciences, 2008, 35 (5): 435-441.
[31] Joye I J, McClements D J. Biopolymer-based nanoparticles and microparticles: fabrication, characterization, and
application [J]. Current Opinion in Colloid & Interface Science, 2014, 19 (5): 417-427.
[32] Ramasamy T, Tran T H, Cho H J, et al. Chitosan-based polyelectrolyte complexes as potential nanoparticulate carriers: physicochemical and biological characterization[J]. Pharmaceutical research, 2014, 31 (5): 1302.
[33] Krivorotova T, Cirkovas A, Maciulyte S, et al. Nisin-loaded pectin nanoparticles for food preservation[J]. Food Hydrocolloids, 2016, 54: 49-56.
[34] Marudova M, MacDougall A J, Ring S G. Pectin–chitosan interactions and gel formation [J]. Carbohydrate research, 2004, 339 (11): 1933-1939.
[35] Coimbra P, Ferreira P, De Sousa H C, et al. Preparation and chemical and biological characterization of a pectin/chitosan polyelectrolyte complex scaffold for possible bone tissue engineering applications [J]. International journal of biological macromolecules, 2011, 48 (1): 112-118.