R E S E A R C H A R T I C L E
Open Access
Rasch analysis of the patient-rated wrist
evaluation questionnaire
Saravanan Esakki
1*, Joy C. MacDermid
1,3, Joshua I. Vincent
1, Tara L. Packham
2, David Walton
1and Ruby Grewal
3,4Abstract
Background:The Patient-Rated Wrist Evaluation (PRWE) was developed as a wrist joint specific measure of pain and disability and evidence of sound validity has been accumulated through classical psychometric methods. Rasch analysis (RA) has been endorsed as a newer method for analyzing the clinical measurement properties of self-report outcome measures. The purpose of this study was to evaluate the PRWE using Rasch modeling.
Methods:We employed the Rasch model to assess overall fit, response scaling, individual item fit, differential item functioning (DIF), local dependency, unidimensionality and person separation index (PSI). A convenience sample of 382 patients with distal radius fracture was recruited from the hand and upper limb clinic at large academic healthcare organization, London, Ontario, Canada, 6-month post-injury scores of the PRWE was used. RA was conducted on the 3 subscales (pain, specific activities, and usual activities) of the PRWE separately.
Results:The pain subscale adequately fit the Rasch model when item 4“Pain - When it is at its worst”was deleted to eliminate non-uniform DIF by age group, and item 5“How often do you have pain”was rescored by collapsing into 8 intervals to eliminate disordered thresholds. Uniform DIF for“Use my affected hand to push up from the chair” (by work status) and“Use bathroom tissue with my affected hand”(by injured hand) was addressed by splitting the items for analysis. After background rescoring of 2 items in pain subscale, 2 items in specific activities and 3 items in usual activities, all three subscales of the PRWE were well targeted and had high reliability (PSI = 0.86). These changes provided a unidimensional, interval-level scaled measure.
Conclusion:Like a previous analysis of the Patient-Rated Wrist and Hand Evaluation, this study found the PRWE could be fit to the Rasch model with rescoring of multiple items. However, the modifications required to achieve fit were not the same across studies, our fit statistics also suggested one of the pain items should be deleted. This study adds to the pool of evidence supporting the PRWE, but cannot confidently provide a Rasch-based scoring algorithm.
Keywords:PRWE, Rasch analysis, Patient-reported outcome measure, Distal radius fracture
Background
Patient-reported outcome measures have become a cornerstone of evaluation in hand therapy and hand sur-gery [1, 2]. A well-developed patient-reported outcome measure (PROM) can provide a clinically relevant evalu-ation of the patient perspective and status to inform health care decisions [1, 2]. Classical test theory (CTT) forms the basis for most evaluations of measurement properties [3]. A core tenet of CTT is validity and reliabil-ity results apply only to the sample studied [4]. This has
resulted in a proliferation of studies on commonly used outcome measures in upper extremity rehabilitation to evaluate measurement properties in a spectrum of con-texts and patient populations [5].
Rasch analysis (RA) is a form of mathematical model-ing employed to develop new outcome measures and ap-praise the properties of existing instruments [6]. RA extends the measurement evaluation by critically evalu-ating discrete items and scores, which is an advantage over CTT [6]. The Rasch rating scale is based on item response theory (IRT) [7]. However, according to its de-veloper George Rasch, the central differentiating feature between the Rasch and IRT is the defining role of * Correspondence:sesakki@uwo.ca
1School of Physical Therapy, Western University, London, ON, Canada
Full list of author information is available at the end of the article
specific objectivity, which presumes both individuals and items can be rated [8]. Rasch uses probabilistic modeling to determine the degree to which items on a scale func-tion as linear (interval-level) measurement of the latent construct, or domains of interest. Further, it models the predicted amounts of this latent construct within the in-dividuals studied [9, 10]. While this interval-level of measurement is a pre-requisite for much statistical ana-lysis, many scales developed within CTT fail to meet this interval measurement standard and are used for decision making and statistical purposes, this may ultimately in-fluence the validity of research findings [5].
The Patient-Rated Wrist Evaluation [PRWE] [11] (see Additional file1) is a patient-reported outcome measure intended to quantify perceptions of pain and disability evolving from wrist conditions. The PRWE has been used in more than 150 studies and has been recom-mended as a core measure for evaluating outcomes in distal radius fracture (DRF) [12]. While the PRWE ques-tionnaire was originally developed for distal radius frac-ture, the scoring instructions (but not the items) were later modified as the Patient-Rated Wrist and Hand Evaluation [PRWHE] [12, 13] to address not only wrist but also hand conditions. A recent systematic review summarized 22 studies examined measurement proper-ties of the PRWE and found strong supporting evidence for reliability and responsiveness [14]. The validity of the PRWHE version is supported for the use in patients with wrist and hand conditions by demonstrating similar re-sponsiveness with the components of the Disabilities of the Arm, Shoulder, and Hand (DASH) [15], but the sys-tematic review noted a gap in clinically relevant indica-tors like the minimally significant difference. While triangulating findings from different measurement models such as CTT and Rasch can lend confidence to the properties of a scale, only a single study reported the properties of the instrument using RA. Packham and MacDermid conducted RA on the PRWHE using 264 patient records representing a mixture of wrist and hand injuries and found good to excellent reliability of the scale [16]. The study found no significant differential item functioning, or scale differences between the people with injuries in the dominant hand when compared to the injuries in the non-dominant hand. A key finding was best fit to the Rasch model was attained if the dis-ability scale was split into the specific activities and usual activities components for analysis [16]. Background re-scoring of some items was also required: however, the authors cautioned that revising the PRWHE based on a single study would be premature. A critical limitation of this study was some patients were represented multiple times (at different time points in their recovery) within the dataset. Another concern limiting the application of the findings in the study did not address the work status
of the participants [16]. Return to work status has been used for many years by rehabilitation professionals as an objective indicator of function, and is an increasingly popular measure of overall recovery from injury [17,18]. Given the return to work is considered a vital indicator of recovery [19], current work status (compared to pre-injury) may be an important person factor upon which to evaluate the measurement properties of a question-naire. While there is no reason to believe the difference in wording of the instructions (the only difference be-tween the PRWHE and PRWE is ‘wrist/hand’ is substituted for ‘wrist’ on the PRWHE) would substan-tially influence measurement properties, there is an op-portunity to replicate the Rasch analyses of the PRWHE using the PRWE. Furthermore, RA of PRWE data gath-ered in a different practice setting and from a different patient population would provide an opportunity to con-trast and compare the stability of findings in the differ-ent practice environmdiffer-ent. Although RA is thought to be less affected by participant samples, this has not always been empirically supported [20, 21]. Taking these con-siderations together, there is a need to further explore the measurement properties of the PRWE using the Rasch paradigm with a different population.
The purpose of this study is to utilize RA to evaluate the PRWE in a cohort of persons following distal radius fracture:
1) To test the construct validity of the pain and dis-ability subscales of the PRWE by examining the unidi-mensionality of the scales, and to evaluate the reliability as defined by Rasch traditions.
2) To examine the interval-level properties of the pain and disability scales of the PRWE by examining the fit to the Rasch model and ordering of item thresholds.
3) To examine the potential for bias in PRWE score based on age, gender and work status of respondents, and to explore solutions for minimizing any bias.
Methods
Research design
Cross-sectional study using RA
6-month post-injury scores for analysis as a return to work status was also evaluated at this time point.
Data collection
Sample size and characteristics
We conducted a secondary analysis of a convenience (existing) cross-sectional data set consisting of 300 and 82 patient’s PRWE scores 6 months post-injury, col-lected at the Hand and Upper Limb clinic at a large aca-demic healthcare organization in London, Ontario, Canada. Ethics approval for the original study was re-ceived from Western University ethics board. Men and women accounted for 32.5% and 67.5% of the sample re-spectively: mean age was 58.5 years. 67% (n= 256) were working and 33% (n= 126) were non-working popula-tion. 19.6% (n= 78) participants have left hand as dom-inance and 61.2% (n= 234) participants have DRF at the dominant side hand (right or left). RA requires large samples to ensure adequate distribution of responses for analysis across all levels of the condition or construct of interest: a minimum of 250 or at least 10 endorsements for each potential response category for each item have been suggested as standards for ensuring adequacy of sample size [21].
The paper copy of the PRWE questionnaire was com-pleted by the patients, and the data were compiled in SPSS for demographic examination and then imported into the RUMM2030 version 5.1(RUMM Laboratory Pty Ltd., Perth, Australia) [22] for RA.
RA
We followed the approach suggested by Lundgren Nils-son and Tennant [6] as described below. The 3 subscales of the PRWE were analyzed separately for sources of misfit to the model [23, 24]. Bonferroni correction [25] was applied throughout the analysis to reduce alpha er-rors due to multiple testing.
Likelihood ratio (LR) test
The choice of Rasch model (Rating Scale vs. Partial Credit) [24] was made by conducting and interpreting a likelihood ratio test that evaluates the likelihood that mathematical differences between polytomous response options are equal. A significant LR suggests they are not equal, and that the unconstrainted partial credit model should be used [24].
Class interval and distribution structure
The size of class intervals was checked throughout the analyses to ensure equal distribution between the inter-vals. Class intervals are generated by the analysis soft-ware after ranking the person location: the sample is then split into relatively equal class intervals to ensure adequate representation of the key patient variables in
each class for differential item functioning analysis [26]. In this instance, 4 class intervals were generated.
Thresholds
Category probability curves were used to identify disor-dered thresholds, item misfit and inconsistent use of items. Disordered thresholds arise when the respondents find it difficult to differentiate between the item re-sponse options [27]. This occurs when there are too many response options, or the selection options are similar to one another, confusing or open to misinter-pretation. Disordered thresholds can be corrected either by rescaling the tool or by collapsing the categories and revising the response option to improve the overall fit to the model [27].
Fit statistics
The following important fit statistics are inspected when analyzing the fit of the data to the Rasch model.
Unidimensionality
Unidimensionality is one of the main assumptions for the data to fit the Rasch model. The absence of any meaningful pattern in the residuals reveals the presence of unidimen-sionality [6]. A test proposed by Smith [28] examines the relationship between items and the first residual factor identified by principal components analysis and uses these patterns to define 2 subsets of items. By then testing using paired t-tests, we could see if the person estimate derived from these subsets significantly differs from that derived from all items. For the questionnaire to be unidimensional, the percentage of tests that are significant (P< 0.05) should be less than 5%. Final evaluation of unidimensionality is completed only when all other scale adjustments have been completed [28].
Local dependency
RA employs Principal Components Analysis (PCA) of the residuals to ensure the local independence of the items [6]. An inter-item residual correlation > 0.2 above the average residual correlation was used as the thresh-old to indicate local dependency [6].
Item/person fit residuals
In RA, the scale is always centered on zero logits, which represents the average item difficulty for the scale. Individ-ual item fit is then calculated relative to this point, or are
‘fitted’to the model. Person fit is then evaluated by con-sidering the mean location of persons in the sample. For a well-targeted measure, the mean location for persons would be around the value of zero. When the mean is ap-proximately zero, and the standard deviation is close to one, the item and persons (residuals) fit the model, and a hierarchical ordering of items (e.g., from low to high levels of activity limitation) is achieved [4, 30]. Standardized fit residuals for individual items were flagged as extreme if the values exceeded + 2.5.
Item-trait interaction
To analyze the property of invariance across the trait be-ing measured, item-trait interaction is assessed usbe-ing a chi-square statistic. The chi-square statistic [31] com-pares the difference in observed values with expected values across groups representing different ability levels (called class intervals) across the trait to be measured (e.g., pain). A significant chi-square value (< 0.05) indi-cates that the hierarchical ordering of the items varies across the trait, compromising the required property of invariance [31].
Reliability indices
Person-Separation-Index (PSI) indicates the reliability of the scale for estimating the amount of latent trait in any individual. This can also be interpreted as the ability of the scale to identify differences among respondents [32]. A person-separation value of a minimum of 0.7 and maximum of 0.95 is considered, in general, to be the ac-ceptable level of PSI. Reliability of the fit characteristics depends on the value of the PSI, with higher PSI indicat-ing higher reliability [32].
Differential item functioning (DIF)
DIF indicates potential sources of bias in-person measure-ments which result in misfit of the data to the Rasch model. DIF occurs when distinct subgroups within the sample population respond in divergent ways to the indi-vidual item even though they have equal levels of under-lying characteristics [8]. DIF can be identified both graphically, by analyzing the item characteristic curves, and statistically using analysis of variance (ANOVA) [33]. DIF can occur in two forms: uniform and non-uniform. Uniform DIF occurs when the difference in scoring per-formance remains constant across all respondent’s ability levels. Uniform DIF can be rectified by either combining items or by splitting items: subtest analyses are performed to verify the DIF was canceled by these adjustments.
Non-uniform DIF occurs when the difference in performance varies with the level of the attributes. There is no definite procedure to rectify the non-uniform DIF, and therefore, the most common solution is for that item to be re-written or removed from the questionnaire [6]. In this RA, we tested DIF on working status, injured hand, dominant hand, gender and age group variables.
Item difficulty Item difficulty for each of the subscales was graphically represented by the generation of a Wright map [10]. This allows the difficulty of the items to be compared and serves as a form of content valid-ation by looking for potential floor or ceiling effects.
Results
In this study, the likelihood ratio was statistically signifi-cant (P value < 0.05): therefore, we used partial credit parameters for the analysis [24]. There were no missing data, and all 382 independent cases were determined to be valid by the RUMM 2030 software. The 3 subscales were analyzed separately, as we presumed each subscale represented a distinct latent trait.
Pain subscale
Initial analysis of the 5 items on the pain subscale using the partial credit model showed shows excellent Individ-ual item fit and indicated acceptable levels of discrimin-ation. Item 5 (How often do you have pain?) shows disordered threshold. The scale also shows significant item-trait interaction (p< 0.001) and PSI of 0.84. Item 4,
“Pain at its worst” showed non-uniform DIF across age groups. Local dependency was observed between item 1 and 5, where predictably, persons with pain at rest re-ported high frequencies of pain. Acceptable unidimen-sionality was observed. (Table1: initial analysis).
To improve the overall fit to the Rasch model item 5 was rescored by collapsing response categories from the original 0–10 responses based on the category probabil-ity curves (Fig.1) until the rescored curves show no dis-ordered thresholds (F = 2.056, df 3, p= 0.105931), resulting in 8 categories (Table2). Item 4 was deleted to eliminate the Non-Uniform DIF (Age group) (F = 2.290, df 3, p= 0.078249). Re-analysis after rescoring shows that the person-item threshold map (Fig. 2) indicates that this subscale has good item coverage for wrist disor-ders related pain. Also, no local dependency was present and unidimensionality was observed.
Specific activities subscale
from a chair”) (F = 15.769, df 1, p= 0.000091) and item 6 (“Use bathroom tissue with my affected hand”) (F = 0.183, df 1, p= 0.669405) by both work status and injured hand. None of the items exhibited DIF for gender or dominant hand. Local dependency was observed between the item 1 (“Turn a door knob using the affected hand”) and item 2 (“Cut meat using a knife in my affected hand”).
To improve the overall fit of the specific activities sub-scale to Rasch model, the following actions were taken. Initially, to deal with DIF, we split the item 4 for the work status as “Yes” and “No” for working and not working and split the item 6 for the injured hand as into right: left: both. This essentially creates a different PRWE scoring system for persons in each of these cat-egories. Then item 1 and 2 were bundled (treated statis-tically as a single item) to address the local dependency. Re-analysis of the altered scale confirmed that DIF and local dependency were resolved. Chi-square residual
became non-significant indicating an acceptable fit of the data to the Rasch model (Fig. 3), and the analysis showed unidimensionality (Table1: final analysis).
Usual activities subscale
The usual activities subscale analysis demonstrated that the scale was unidimensional with 95% confidence interval (0.0150) and reliability was good (PSI = 0.78) (Table1: ini-tial analysis). No DIF was observed for the injured hand, dominant hand, and gender. However, it shows misfit to the Rasch model with disordered thresholds for two of the four items (items 3 and 4). Item 2 “Household work (cleaning, maintenance)” showed uniform DIF for work status, while non-uniform DIF for age group was observed for item 4“Recreational activities”.
To increase the overall fit of the scale to the Rasch model, the items (3 and 4) with disordered thresholds were collapsed to reorder into 7 intervals. (Table 2). Table 1Summary fit statistics for individual subscales of the PRWEa
Analysis Item fits residual Person Fit residual Item-trait interaction Unidimensionality PSIa
Mean SD Mean SDa Chi-square(df)a P Per C < 5%a
PAIN SUBSCALE
Initial −0.41 1.72 −0.45 0.94 23 (20) 0.49 6.9% 0.89
Final −0.53 1.17 −0.44 0.91 18 (20) 0.54 2.5% 0.84
SPECIFIC ACTIVITIES SUBSCALE
Initial −0.60 2.13 −0.45 1.07 54 (30) 0.00 4.7% 0.81
Final −0.47 1.87 −0.37 1.03 32 (25) 0.04 - (since items were split for DIF) 0.80
USUAL ACTIVITIES SUBSCALE
Initial −0.41 1.72 −0.45 0.94 23 (20) 0.28 1.5% 0.78
Final −0.43 1.58 −0.45 1.00 35 (25) 0.07 - (since items were split for DIF) 0.81
a
Source of misfit to the Rasch model; SD = Standard deviation; df = Degrees of freedom; per C < 5% = proportion of t-tests that were significant at level of signifi-cance of 0.05; 95% CI = 95% confidence interval; PSI = Person separation index; PRWE–Patient-Rated Wrist Evaluation
For the data to satisfy Rasch model requirements:
The mean is expected to be approx. Around zero (Can range between ± 2.5); S.D. should be approx. 1;
Chi-square value is expected to be small and statistically non-significant;
For a measure to be unidimensional per C < 5% should be less than 0.05; if it is higher than 0.05 then look into the lower limit the 95% confidence interval if it is less than 0.05 then the measure is unidimensional
PSI (Person separation index) should be greater than 0.70 for the summary statistics to be reliable;
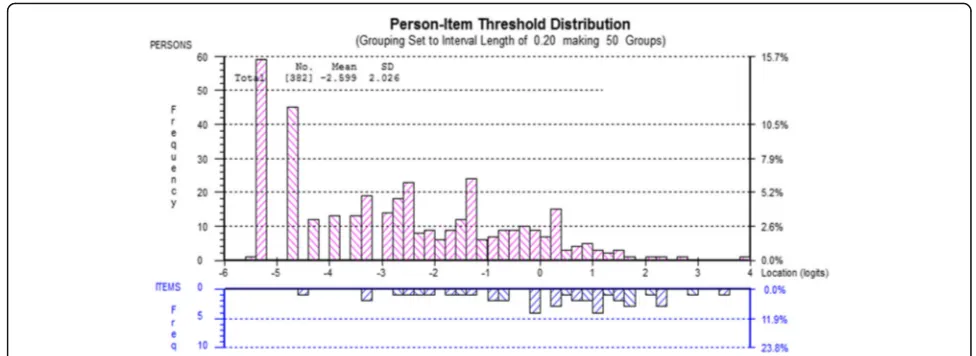
After rescoring, summary statistics showed no local de-pendency on the scale. To eliminate the DIF, item 2 was split for work status as“Yes” and “No” for working and not working (F = 4.054, df 1, p= 0.045085), and item 4 was split for the age group as 0–35 years: 36–50 years: 51–65 years: 65 years plus for the better distribution of per-sons within this category (F = 1.693, df 3, p= 0.168899). The final analysis demonstrated the data to fit the Rasch model, increasing the reliability of the subscale (PSI = 0.86) and decreased chi-square value (Table 1: final analysis,
Fig.4). The person-item threshold map illustrated the high level of recovery seen in the sample of 6 months post re-covery in DRF sample (pink bars). The scale has good coverage across the range of abilities, and that’s illustrated by the figures (blue bars) (Fig.5).
Discussion
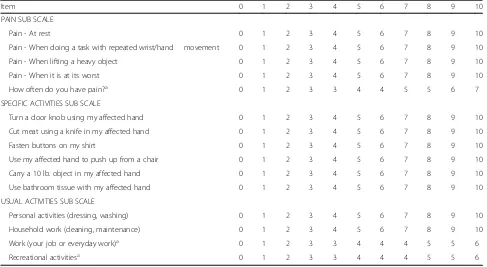
The result of this RA adds additional evidence for accept-able measurement properties to that derived from classical test methods on the psychometric properties of the Table 2Table showing the structure of scores for individual items of the PRWE
Item 0 1 2 3 4 5 6 7 8 9 10
PAIN SUB SCALE
Pain - At rest 0 1 2 3 4 5 6 7 8 9 10
Pain - When doing a task with repeated wrist/hand movement 0 1 2 3 4 5 6 7 8 9 10
Pain - When lifting a heavy object 0 1 2 3 4 5 6 7 8 9 10
Pain - When it is at its worst 0 1 2 3 4 5 6 7 8 9 10
How often do you have pain?a 0 1 2 3 3 4 4 5 5 6 7
SPECIFIC ACTIVITIES SUB SCALE
Turn a door knob using my affected hand 0 1 2 3 4 5 6 7 8 9 10
Cut meat using a knife in my affected hand 0 1 2 3 4 5 6 7 8 9 10
Fasten buttons on my shirt 0 1 2 3 4 5 6 7 8 9 10
Use my affected hand to push up from a chair 0 1 2 3 4 5 6 7 8 9 10
Carry a 10 lb. object in my affected hand 0 1 2 3 4 5 6 7 8 9 10
Use bathroom tissue with my affected hand 0 1 2 3 4 5 6 7 8 9 10
USUAL ACTIVITIES SUB SCALE
Personal activities (dressing, washing) 0 1 2 3 4 5 6 7 8 9 10
Household work (cleaning, maintenance) 0 1 2 3 4 5 6 7 8 9 10
Work (your job or everyday work)a 0 1 2 3 3 4 4 4 5 5 6
Recreational activitiesa 0 1 2 3 3 4 4 4 5 5 6
a
Rescored items; PRWE–Patient-Rated Wrist Evaluation
PRWE. As with many Rasch analyses conducted on in-struments that were not developed using Rasch, some modifications were required to achieve interval level scal-ing or fit to the Rasch model. However, these adjustments indicated an adjusted PRWE could provide interval level scaling and appropriate targeting for a DRF population.
During the initial steps of our RA, we found three disor-dered item thresholds from the pain (1 item) and usual ac-tivity (2 items) subscales. Similar findings have been observed in the previous study on the measurement prop-erties of the PRWHE (3 items) [16] and the analysis of the similarly structured Patient-Rated Elbow Evaluation (PREE) (17 items) [33]. Other work has suggested disor-dered thresholds in 0 to 10 scales may reflect difficulty for respondents in finding meaningful distinctions between 11 different response categories. Nonetheless, the concept of 0 to 10 is commonly used and easy for patients to understand. It is not clear if overtly rewriting items to have fewer categories would be beneficial, especially since
the optimal number of categories would then vary by question. Therefore, background rescoring is a simple so-lution and is commonly used to reduce items responses to fewer categories “behind the scenes” without disturbing the original construction or outward appearance of the item that is in common use [34].
The three subscales of the PRWE were considered sep-arately to accommodate the unidimensionality assump-tion of the Rasch model. Unidimensionality was observed in all the three subscales. This suggests each subscale represents a unique construct and would sup-port comparisons between these components, as well as comparisons based on the total PRWE score. This is concordant with the previous PRWHE analysis [16], which was unable to fit the disability component to the model as a unit, and needed to look at the subscale level in order to see fit to the model. Confirmatory factor ana-lysis of this dataset could potentially validate this per-spective and is warranted. While it is common to use a
Fig. 3Person-item threshold distribution (Specific activities)
single summary score in reporting outcomes in clinical studies, it has become more apparent that pooling differ-ent constructs can have drawbacks. Recdiffer-ent recommen-dations around the use of core measures suggest that pain and disability subscales should be considered as separate constructs [33]. Our RA approach is consistent with that recommendation. Given that trials will con-tinue to prefer to use a single summary outcome meas-ure, it is advisable that such studies also examine subscale differences in outcome to avoid inaccurate in-terpretation of the impact of interventions.
In the pain subscale, we found non-uniform DIF was ex-hibited based on age group. This misfit should be consid-ered in the context that previous pain studies indicate the perception of pain differs from person to person and also pain tolerance is reduced as people age [35,36]. A mean-ingful pattern of local dependency was observed between items 1“pain at rest”and 5 (pain frequency). If the pain is reported at rest, the person is also likely to have pain more frequently. But these local dependency issues were accom-modated when subtest analysis was performed, demon-strating the impact of this correlation is mitigated by always considering both items together in the context of the scale. In terms of clinical implications, it is important to note these adjustments we made to fit the PRWE to the Rasch model are to support the accuracy of interval level scoring [33] for research comparisons to other interval level variables such as grip strength.
In the specific activities subscale, uniform DIF was ob-served by work status for“use my affected hand to push up from a chair.”It may be that people in the workplace have more possibilities of using the injured hand while pushing up from the chair when compared to the non-working participants thus calibrating this differently. Similarly, in usual activities subscale, differential item functioning by age groups may reflect the difficulty in
transferring that is often reported by older adults aged 65 and above [37]. However, work status and age are correlated in this sample which reflects the epidemiology of DRF, since most older adults aged 65 and above would not be working [38]. So, it is difficult to determine which factors drive the differential item functioning. Gender or dominant hand did not exhibit DIF, which shows that this scale has good construct validity. A dom-inance effect has been reported in some patient-reported outcome measures, such as the DASH [15], however, the PRWE instructions refer to “the affected hand”, whereas the DASH refers to difficulty at the person-level: this may account for the differences seen in the importance of dominance as an outcome mediator. The local de-pendency observed between the “Turn a door knob using the affected hand” and “Cut meat using a knife in my affected hand” has not been reported in other Rasch analyses of the PRWHE, PREE and is not intuitive. It may be that difficult with a hand grip that occurs follow-ing DRF links these items in this sample. Since the prior RA included different diagnoses, this link may not have occurred in a more heterogeneous sample. Because it has not been reported in previous studies, the depend-ency may not generalize beyond this sample.
In the usual activities subscale,“Household work (clean-ing, maintenance)”was the source of misfit. The analysis shows uniform DIF for the work status: this may be due to the differences in the perception of the household work among the people who are working and who are not, and their contribution to household tasks. People who hold paid employment outside the home may contribute rela-tively less to household work when compared to people who stay at home [39]. This could explain the reason for observing a uniform DIF. This finding was similar to RA results reported for the PREE, where uniform DIF was ob-served on “Household work (cleaning, maintenance)”
from the usual activities subscale for gender. In our sam-ple, non-uniform DIF was observed between different age groups for “Recreational activities”, perhaps due to the age-based differences in participation as the type of activ-ities, intensity of the recreational activactiv-ities, and the value of participation in recreation also differs between the age groups [38, 40]. Younger adults often engage in high-intensity recreational activities while older adults may tend to do mild to moderate intensity recreational activ-ities, but may perceive the level of intensity differently. Recreational activities in older adults are most likely to participate in activities such as watching television or lis-tening to the radio and leisure walking [37,38]. This may explain why the participants answered this question differ-ently. Since age is one of the most commonly reported el-ements in clinical research studies, the distributions of this may need to be considered when interpreting the patient-reported outcomes using the PRWE in clinical studies of persons with wrist conditions. This also reflect-ive of the nature of the DRF population, where fractures in younger persons are most likely high velocity related to sports and MVA, in comparison to older adults where low-velocity injuries such as falls from standing height predominate [41].
The strengths of the current study are its high PSI values and the excellent power of fit with a sample size of 382 pa-tients. Although we used available data from a DRF popula-tion for this secondary analysis, we were able to examine for DIF based on gender, age, work status and hand domin-ance and affected side. In Rasch tradition, item and person measures are not considered sample-dependent if the data can be shown to fit the Rasch model after adjustment for DIF. We were able to build on previous work using RA to examine the predominantly similar outcome measure the PRWHE [16] while addressing the limitations of that previ-ous study. While we anticipated measurement properties would be similar given the small variations between the scales, we now have empirical data confirming this. More importantly, our study addresses previously unreported measurement properties including the impact of the work-ing status of the participants on the performance of the PRWE. Return to work is a considered a vital indicator of recovery [18, 19], this study utilized the current and pre-injury work status as a person factor for analyzing the measurement properties of PRWE. The ANOVA supports that even though the working and the non-working popula-tions answered the question differently, still the mean total PRWE score of people who have returned to work (−1.47 logits) and those not working (−1.48 logits) have no statis-tical difference (F (1,379) = 0.033,p= 0.86).
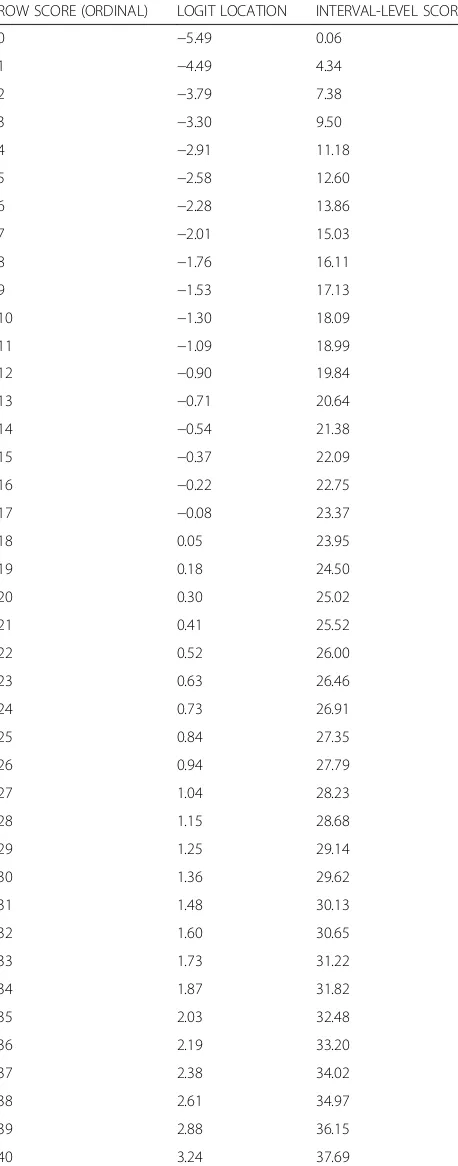
The limitations of the current study are that the data were collected only from one location and at a single re-covery time point. As this data represents participant status at 6 months post-injury, we might expect a floor Table 3Transformation Matrix for Converting Raw Ordinal Level
Scores to Interval-level Scores, Using the Revised Scoring Where the Scale is Out of a Maximum of 10 Points. This conversion can be used only with the modified PRWE questionnaire
ROW SCORE (ORDINAL) LOGIT LOCATION INTERVAL-LEVEL SCORE
0 −5.49 0.06
1 −4.49 4.34
2 −3.79 7.38
3 −3.30 9.50
4 −2.91 11.18
5 −2.58 12.60
6 −2.28 13.86
7 −2.01 15.03
8 −1.76 16.11
9 −1.53 17.13
10 −1.30 18.09
11 −1.09 18.99
12 −0.90 19.84
13 −0.71 20.64
14 −0.54 21.38
15 −0.37 22.09
16 −0.22 22.75
17 −0.08 23.37
18 0.05 23.95
19 0.18 24.50
20 0.30 25.02
21 0.41 25.52
22 0.52 26.00
23 0.63 26.46
24 0.73 26.91
25 0.84 27.35
26 0.94 27.79
27 1.04 28.23
28 1.15 28.68
29 1.25 29.14
30 1.36 29.62
31 1.48 30.13
32 1.60 30.65
33 1.73 31.22
34 1.87 31.82
35 2.03 32.48
36 2.19 33.20
37 2.38 34.02
38 2.61 34.97
39 2.88 36.15
bias, as persons are generally recovered and may have very low scores on the PRWE. However, this analysis suggests even at this lower end of scores, the data still fit the Rasch model. While RA supposes that results should be transferable across patient populations [9], our study does not address if similar findings would occur across diverse patient populations, or across a DRF population at different time points in recovery. Finally, the rescor-ing, splitting and bundling of items required to achieve model fit is likely not operational for general clinical practice, and future work should confirm our findings before undertaking the development of systems to facili-tate Rasch scoring, such as specific conversion tables (Table3) or digital apps.
Conclusion
In conclusion, this Rasch analysis suggests the psychomet-ric measurement and interval level properties of the PRWE are robust, reinforcing previous studies on PRWE/ PRWHE’s psychometric properties using both classical test theory and Rasch approaches. The PRWE conformed to many of the fit expectations of the Rasch model, but not all. With modifications, we were able to fit all the items to the Rasch model.
Additional file
Additional file 1:Patient Rated Wrist Evaluation. (DOCX 18 kb)
Abbreviations
ANOVA:Analysis of Variance; CTT: Classical Test Theory; DASH: Disabilities of the Arm, Shoulder, and Hand; DIF: Differential Item Functioning; DRF: Distal Radius Fracture; IRT: Item Response Theory; LR: Likelihood Ratio; MVA: Motor Vehicle Accidents; PCA: Principal Components Analysis; PREE: Patient-Rated Elbow Evaluation; PROM: Patient-Reported Outcome Measure; PRWE: The Patient-Rated Wrist Evaluation; PRWHE: Patient-Rated Wrist and Hand Evaluation; PSI: Person Separation Index; RA: Rasch Analysis
Acknowledgements
Not applicable
Funding
No funding were received for this study
Availability of data and materials
Please contact author for data requests
Authors’contributions
JM and JV collected the data, JV and TP helped in analyzing the data, DV and RG helped to draft the manuscript. SE participated in the design of the study and performed the statistical analysis and draft the manuscript. All authors read and approved the final manuscript.
Ethics approval and consent to participate
Not applicable
Consent for publication
Not applicable
Competing interests
The authors declare that they have no competing interests
Publisher’s Note
Springer Nature remains neutral with regard to jurisdictional claims in published maps and institutional affiliations.
Author details
1School of Physical Therapy, Western University, London, ON, Canada. 2School of Rehabilitation Science, McMaster University, Hamilton, ON,
Canada.3The Hand and Upper Limb Centre, St Joseph’s Health Centre, London, ON, Canada.4Department of Surgery, University of Western Ontario,
London, ON, Canada.
Received: 26 June 2017 Accepted: 8 February 2018
References
1. MacDermid JC. Patient-reported outcomes state-of-the-art hand surgery and future applications. Hand Clin. 2017;30:293–304.
2. Goldhahn J, Beaton D, Ladd A, MacDermid JC, Hoang A. Recommendation for measuring clinical outcome in distal radius fractures: a core set of domains for standardized reporting in clinical practice and research. Arch Orthop and Trauma Surg. 2014;134:197–205.
3. DeVellis RF. Classical test theory. Med Care. 2006;44:50–9.
4. Prieto L, Alonso J, Lamarca R. Classical test theory versus Rasch analysis for quality of life questionnaire reduction. Health Qual Life Outcomes. 2003;1:27. 5. Sica N, Chachamovich E, Pio M, Fleck DA, Tennant A. An introduction to
Rasch analysis for psychiatric practice and research. J Psychiatr Res. 2013;47: 141–8.
6. Pallant JF, Tennant A. An introduction to the Rasch measurement model: an example using the hospital anxiety and depression scale (HADS). Br J Clin Psychol. 2007;46:1–18.
7. Reckase MD. The past and future of multidimensional item response theory. Appl Psychol Meas. 1997;21:25–36.
8. Nilsson ÅL, Tennant A. Past and present issues in Rasch analysis: the functional independence measure (FIM TM) revisited. J Rehabil Med. 2011; 43:884–91.
9. Tennant A, McKenna SP, Hagell P. Application of Rasch analysis in the development and application of quality of life instruments. Value Heal. 2004;7:22–6.
10. Wright BD, Masters GN. Rating scale analysis. Rasch measurement. 5835 S. Chicago: MESA Press; 1982.
11. MacDermid JC. Development of a scale for patient rating of wrist pain and disability. J Hand Ther. 1996;9:178–83.
12. Taylor J, Kersten P. The patient-rated wrist and hand Evaluation : a systematic review of its validity and reliability. NZ J Physiother. 2014;42:141–7. 13. MacDermid JC. The Patient-Rated Wrist Evaluation (PRWE) User Manual.
https://srs-mcmaster.ca/wp-content/uploads/2015/05/English-PRWE-User-Manual.pdf. Accessed 20 Jan 2018.
14. Mehta SP, MacDermid JC, Richardson J, MacIntyre NJ, Grewal R. A systematic review of the measurement properties of the patient-rated wrist evaluation. J Orthop Sports Phys Ther. 2015;45:289–98.
15. MacDermid JC, Tottenham V. Responsiveness of the disability of the arm, shoulder, and hand (DASH) and patient-rated wrist/hand evaluation (PRWHE) in evaluating change after hand therapy. J Hand Ther. 2004;17:18–23. 16. Packham T, MacDermid JC. Measurement properties of the patient-rated
wrist and hand evaluation: Rasch analysis of responses from a traumatic hand injury population. J Hand Ther. 2013;26:216–24.
17. Butler JR, Baldwin ML, Johnson WG. Managing work disability: why first return to work is not a measure of success. ILR Review. 1995;48:452–69. 18. Mackenzie EJ, Shapiro SAM, Smith RT, Siegel JH, Moody M, Pitt A. Factors
influencing return to work following hospitalization for traumatic injury. Am J Public Heal. 1987;77:329–34.
19. Shames J, Treger I, Ring H, Giaquinto S. Return to work following traumatic brain injury: trends and challenges. Disabil Rehabil. 2007;29:1387–95. 20. Chang WC, Chan C. Rasch analysis for outcomes measures: some
methodological considerations. Arch Phys Med Rehabil. 1995;76:934–9. 21. Hagell P, Westergren A. Sample size and statistical conclusions from tests of
fit to the Rasch model according to the Rasch unidimensional
measurement model (RUMM) program in health outcome measurement. J Appl Meas. 2016;17:416–31.
23. Suhr DD. Exploratory or confirmatory factor analysis.http://www2.sas.com/ proceedings/sugi31/200-31.pdf. Accessed 20 Jan 2018.
24. Masters G. A Rasch model for partial credit scoring. Psychometrika. 1982;47: 149–74.
25. Armstrong RA. When to use the Bonferroni correction. Ophthal Physiol Opt. 2014;34:502–8.
26. Walton DM, Wideman TH, Sullivan MJL. A Rasch analysis of the pain catastrophizing scale supports its use as an interval-level measure. Clin J Pain. 2013;29:499–506.
27. Parkitny L, Henry J, Walton D, Oliveira L, Costa P, Refshauge KM. Rasch analysis supports the use of the depression, anxiety, and stress scales to measure mood in groups but not in individuals with chronic low back pain. J Clin Epidemiol. 2012;65:189–98.
28. Smith EV Jr. Detecting and evaluating the impact of multidimensionality using item fit statistics and principal component analysis of residuals. J Appl Meas. 2002;3:205–31.
29. Andrich D, Kreiner S. Quantifying response dependence between two dichotomous items using the Rasch model. Appl Psychol Meas. 2010;31:181–92. 30. Tennant A, Pallant J. Introductory Rasch analysis: a workbook. Leeds, UK:
Department of Rehabilitation Medicine, University of Leeds; 2011. 31. Linacre JM, Wright BD. Chi-square fit statistic. Rasch Measure Trans. 1994;8:360. 32. Wright BD. Interpreting reliabilities. Rasch Meas Trans. 1998;11:602. 33. Vincent JI, MacDermid JC, King GJW, Grewal R. Rasch analysis of the
patient-rated elbow evaluation questionnaire. Health Qual Life Outcomes. 2015;13:84. 34. Bond T, Fox C. Applying the Rasch model: fundamental measurement in
the human sciences. 3rd ed. Mahwah: Routledge; 2015.
35. Lautenbacher S, Kunz M, Strate P, Nielsen J, Arendt-Nielsen L. Age effects on pain thresholds, temporal summation and spatial summation of heat and pressure pain. Pain. 2005;115:410–8.
36. Cole LJ, Farrell MJ, Gibson SJ, Egan GF. Age-related differences in pain sensitivity and regional brain activity evoked by noxious pressure. Neurobiol Aging. 2010;31:495–503.
37. Alexander NB, Galecki AT, Grenier ML, Nyquist LV, Hofmeyer MR, Grunawalt JC, Medell JL, Fry-Welch D. Task-specific resistance training to improve the ability of activities of daily living-impaired older adults to rise from a bed and from a chair. J Am Geriatr Soc. 2001;49:1418–27.
38. Kenny GP, Yardley JE, Martineau L. Physical work capacity in older adults: implications for the aging worker. Am J Ind Med. 2008;51:610–25. 39. Bianchi SM, Milkie MA, Sayer LC, Robinson JP. Is anyone doing the
housework? Trends in the gender division of household labor. Soc Forces. 2002;79:191–228.
40. Dzaja I, MacDermid JC, Roth J, Grewal R. Functional outcomes and cost estimation for extra-articular and simple intra-articular distal radius fractures treated with open reduction and internal fixation versus closed reduction and percutaneous Kirschner wire fixation. Can J Surg. 2013;56:378–84. 41. Koo KO, Tan DM, Chong AK. Distal radius fractures: an epidemiological
review. Orthop Surg. 2013;5:209–13.
• We accept pre-submission inquiries
• Our selector tool helps you to find the most relevant journal
• We provide round the clock customer support • Convenient online submission
• Thorough peer review
• Inclusion in PubMed and all major indexing services
• Maximum visibility for your research
Submit your manuscript at www.biomedcentral.com/submit