DOI: 10.30954/0974-1712.06.2018.1
©2018New Delhi Publishers. All rights reserved
ENVIRONMENTAL SCIENCE
Adsorption of Two Basic Dyes Methylene Blue and Malachite
Green onto Low Cost Adsorbent Rice Husk Ash: A Batch Study
Soumitra Banerjee
*1, Anupam Debsarkar
2and Siddhartha Datta
31Jadavpur University, Kolkata-32, West Bengal, India
2Department of Civil Engineering, Jadavpur University, Kolkata-32, West Bengal, India 3Department of Chemical Engineering, Jadavpur University, Kolkata-32, India
*Corresponding author: [email protected] (ORCID ID: 0000-0002-7886-9844)
Paper No. 697 Received: 07-03-2018 Accepted: 03-05-2018
ABSTRACT
In the present study, rice husk ash an agricultural waste material was used as a low cost adsorbent for the removal of mixture of two basic dyes, widely used in the textile industries, methylene blue (MB) and malachite green (MG) from the aqueous solution. Batch study was conducted to investigate into the effect of different experimental parameters such as contact time, adsorbent dose, initial concentration and shaker speed for the removal of mixture of two dyes. Batch study showed that up to 90.95% removal of two dyes at dye concentration of 25mg/L and dose 48mg/L. An increase in concentration resulted in a greater dye removal from the aqueous solution. It was established from the kinetic study that the adsorption data followed the pseudo-second-order-kinetic model in a better way than the pseudo-first-order kinetic model. Isotherm study was conducted by using Langmuir, Freundlich and Temkin isotherm equation. Langmuir isotherm model described the experimental data quite well with high correlation coefficient and it was also supported by the five error functions. The results showed that rice husk ash has the potential to be used as an effective adsorbent for the removal of mixture of two basic dyes.
Highlights
mAdsorptive removal of basic dyes in a mixture using low cost adsorbent.
Keywords: Adsorption, adsorbent, adsorbate, batch study, rice husk ash, methylene blue, malachite green
Colour is the distinct indicator of water pollution. The discharge of coloured wastewater from the textile and other dye using industries not only affects the aesthetic nature of the receiving stream or flowing water body but also makes hindrance to penetrate sunlight and thus reduces the photosynthetic activity (Wu et al. 2013). Several physical, chemical and biological methods including adsorption, chemical flocculation, ozonization, reverse osmosis and membrane filtration are available for the treatment of dye bearing wastewater (Khonde et al. 2012). However, most of these techniques except adsorption are not so useful for this heat and light stable dyes (Sotelo et al. 2012). The adsorption process is the most widely used and effective method of treatment of dye bearing
422 Print ISSN : 1974-1712
on adsorptive removal of dye mixture. The main objective of this paper is to study the removal of mixture of two basic dyes, widely used in the textile industries, methylene blue (MB) and malachite green (MG), using low cost adsorbent rice husk ash, to address the real life problem.
MATERIALS AND METHODS
Raw rice husk was collected from the local agricultural field, washed with distilled water and then dried in an oven at 50°C for 8 hrs. It was then burnt at nearly 600°C temperature in the muffle furnace. The particle size distribution was conducted by sieve analysis which is given in the Table 1. E. Merck grade MB and MG were used as the adsorbate. Stock solutions were prepared by dissolving two dyes in equal proportions (1:1) by weight in distilled water to give a concentration of 1000 mg/L and diluting as and when required. The concentration of colour within the collected effluent was estimated colour imetrically at a visible spectrophotometer (Systronics: Model 610). The λmax for the dye mixture was observed at 619.9 nm. The entire experimental programme for the present investigation is given in the Table 2.
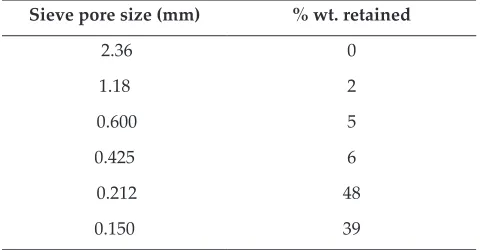
Table 1: Particle size distribution of RHA
Sieve pore size (mm) % wt. retained
2.36 0
1.18 2
0.600 5
0.425 6
0.212 48
0.150 39
Table 2: Experimental details for batch study
Parameters Range of values studied
Temperature 303 + 1
Adsorbate concentration
(mg/L) 25, 40, 50, 75, 100, 150 Adsorbent dose
(g/L) 9.6, 11.02, 12.8, 16, 20, 24, 32, 48 Contact Time
(mins) 10, 30, 60, 75, 90, 120, 135, 165, 190, 210, 240, 300 Shaker speed
(rpm) 30, 50, 60, 75, 90, 110, 120, 130
RESULTS AND DISCUSSION
SEM analysis
The surface morphology and the physical properties of the adsorbent can be determined by scanning electron microscope (SEM) study (Sen T.K et al. 2011). The adsorbent shape, porosity and size distribution can also be determined by this study. SEM photographs of raw RHA and after adsorption of MB and MG dyes in mixture are showed in the Fig. 1 (a) and (b). It appears from Fig. 1(a) that RHA had considerable numbers of pores where there was a good possibility of two dye molecules to be trapped and adsorbed on to those pores. The dark spot (within the SEM study) of RHA after adsorption indicated the effective adsorption of dye molecules in the cavities and pores of the RHA (Fig. 1(b)).
Fig.1 (a): RHA before
adsorption Fig. 1(b):adsorption RHA after
Effect of adsorbent dosage
The effect of adsorbent dose on the adsorption of mixed dyes was observed as shown in the Fig. 2(a). The amount of adsorbent RHA was taken between 0.05 to 12 gm with a fixed initial concentration of 25 mg/L and shaker speed of 120 rpm. The result showed that when the adsorbent dosage increased from 15.83% to 88.76 % and then reached a plateau. The larger adsorption surface caused higher adsorption of dyes (Rafatullah et al. 2010) and thus, the optimum dose for RHA was selected as 16 gm for the present adsorption study.
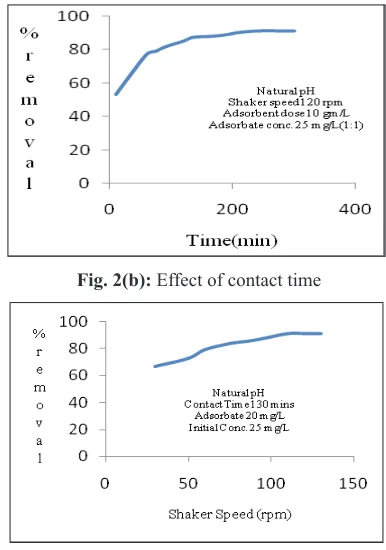
Effect of contact time
that for the initial 10 to 135 mins the percentage removal was achieved rapidly from 53.07% to 87.53% and thereafter no noticeable change was observed in the adsorptive removal. This may be caused by strong attractive forces acting between the molecules of dyes and the adsorbent.
Effect of initial dye concentration
In the fig. 2(c), the effect of initial concentration on the adsorptive removal of two dyes is shown for a fixed amount of adsorbent dose of 4 gm where the initial concentrations were varied from 25 to 150 mg/L. The percentage removal of dyes under fixed other operating conditions decreased from 88.53% to 58.53% as the initial concentration was increased from 25 to 150 mg/L.
Effect of shaker speed
The effect of shaker speed on the percentage removal of dyes was studied (Fig 2(d)) under various other fixed operating conditions. It was observed that initially the percentage removal got increased from 66.48% to 90.95% as the shaker speed was increased from 30 rpm to 110 rpm, and beyond that it reached a constant value, because of the non-availability of the surface required for adsorption.
Adsorption isotherm
It is important to design an adsorption system under optimal condition and to establish a correlation for the equilibrium curves. In this work, different isotherm equations like Langmuir, Freundlich and Temkin were studied (Temkin, M.J et al. 1940). In Langmuir isotherm theory (Dukkanci M et al. 2010), the basic assumption is that the sorption takes place at specific homogeneous sites within the adsorbent.
The linear form of Langmuir equation is,
1
e e
e L m m
C C
q = K q +q …(1)
Where, qe is the amount of dye adsorbed on RHA at equilibrium, Ce the equilibrium concentration on dye solution, KL the equilibrium constant and qm is the maximum adsorption capacity. The essential characteristic of the Langmuir isotherm can be expressed by the dimensionless constant R L , called equilibrium parameter and defined as,
0 1 1 L
L
R
K C
=
+ …(2)
where, KL and C0 are the Langmuir constant and
Fig. 2(a): Effect of adsorbent dose Fig. 2(b): Effect of contact time
424 Print ISSN : 1974-1712
initial dye concentration (mg/L) respectively. KL values indicate the nature of isotherm to be irreversible (RL=0), favourable (0<RL<1), linear (RL=1) or unfavourable (RL>1). The different constants and KL values have shown in the Table 3.
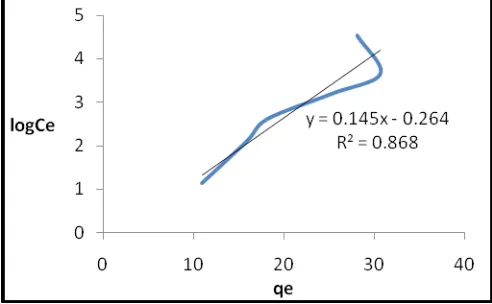
The Freundlich isotherm is described with the assumption that a heterogeneous surface with a non-uniform distribution of heat of adsorption over the surface (Anirban et al. 2009). The expression for Freundlich isotherm equation is,
1
logqe=logKF +nlogCe …(3)
Where KF is adsorption capacity (mg/L), i/n is intensity of adsorption and its value indicates the nature of adsorption to be irreversible (1/n=0), favourable (0<1/n<0), unfavourable (1/n>1). The values of different constants and 1/n have given to the Table 3.
Table 3: Calculated values of various isotherm parameters
Adsor-bent Langmuir isotherm Freundlich isotherm isothermTemkin
RHA qm RL KL R2 K
F 1/n R2 KT b1 R2 29.41 0.18 0.185 0.942 6.47 0.417 0.994 6.182 17.82 0.868
Temkin and Pyzhev considered the effects of some indirect sorbate/adsorbate interactions on adsorption isotherms and suggested that because of these interactions the heat of adsorption of all the molecules in the layer would decrease linearly with coverage, i.e. it implies that uniform distribution of binding energies (Hsu et al. 2009). The linearized form of the equation is,
1 1
log log
e T e
RT RT
q K C
b b
= + …(4)
where, R is the gas constant (8.314 J/mol/K), T is the absolute temperature (K).
From the Table 3 it is inferred that Langmuir and Freundlich isotherm equations were best fit linear equations. Calculated value of RL obtained as 0.18 (0<RL<1), indicating favourable adsorption.
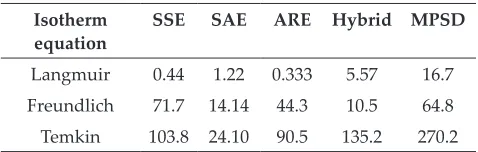
Error analysis
Due to the inherent biasness occurring during
the linearization of isotherm equations, statistical analyses were employed to optimize the appropriate isotherm equation. These statistical equations are basically error functions where experimental data are put together (Sen et al. 2011). In course of this investigation five different error functions were utilized. The deviations from the actual values derived from the different error functions were presented in the Table 4.
Table 4: Calculated values of error functions for different isotherm models
Isotherm
equation SSE SAE ARE Hybrid MPSD
Langmuir 0.44 1.22 0.333 5.57 16.7
Freundlich 71.7 14.14 44.3 10.5 64.8 Temkin 103.8 24.10 90.5 135.2 270.2
Chi-square analysis was employed to evaluate the significance of the effects of the parameters for the removal of present dyes and residual dyes in concentrations at equilibrium. It is, in fact, the sum of the squares of the differences between the experimental data and the data obtained from the models, with each squared difference being divided by the corresponding data obtained from models (Anirban et al. 2009). It is given as,
(
)
2
1
2 n
i iz
i iz
q q
q
χ
=
−
∑
X2-value for Langmuir, Freundlich and Temkin
isotherm equations for RHA adsorbent were calculated as 0.10, 11.2 and 661.14 respectively. The small chi-square value means a smaller deviation between derived data and experimental values or vice-versa. Therefore, smaller value for Langmuir isotherm model would be considered the optimal isotherm model.
Adsorption kinetics
Pseudo-first-order equation is represented as,
(
)
2 q
e t t
d
k q q
d = − …(5)
where, qe is the amount of dye adsorbed (mmol/g), qt the amount of dye adsorbed at time t (mmol/g) and K1 is the equilibrium rate constant (1/min). Integrating both sides of the equation (5),
(
)
( )
1log log
2.303
e t t
k
q −q = q − t …(6)
The straight line plot of log(qe-qt) versus t for the adsorption of MB and MG on to RHA at different concentrations (25-150 mg/L) was also tested to obtain the rate parameters. The K1 qe and correlation coefficients (R2) calculated were presented in the
Table 6against Pseudo-second-order equation. The adsorption kinetic may be described by the pseudo-second-order model as,
(
)
22 t
e t t
dq
k q q
d = − …(7)
where, k2 (g(mgmin)-1) is the rate constant of
adsorption.
Integrating both sides,
2 2
2 2
t e t
t
t
q = k q +q …(8)
The plot t/qt versus t showed a linear relationship and values of K2 and equilibrium adsorption capacity qe were calculated from the intercept and slope of the plot for the different concentrations of 25 to 150 mg/L.
Table 5: Analysis of experimental data with pseudo-first and pseudo-second order kinetics
C0
Pseudo-first-order
model Pseudo-second-order model qe
Exp. qe
cal K1 R2
qe Exp.
qe
cal K2 R2
25 4.01 23.43 0.05 0.287 23.80 23.43 3.71×10⁻³ 0.994
50 5.72 46.27 0.03 0.851 47.61 46.27 9.12×10⁻³ 0.999
100 9.83 90.58 0.03 0.810 90.90 90.58 3.43×10⁻⁴ 0.986
150 8.94 144.82 0.02 0.711 142.85 144.96 1.53×10⁻⁴ 0.970
Fig. 3(a): Langmuir model using rice husk ash adsorbent Fig. 3(b): Freundlich model using rice husk ash adsorbent
426 Print ISSN : 1974-1712
The results for pseudo-first and pseudo-second order kinetics were presented collectively in the Table 5. The second-order model showed that the calculated data fitted well with the experimental data with high values of coefficient of regression (R2>0.97). It was also observed that the experimental
and calculated data were very close to each other. Hence, pseudo-second-order model provided better correlation with the experimental results than the first-order model.
CONCLUSION
In the present investigation, batch study was conducted for the removal of two basic dyes MB and Mg from the aqueous mixture, using RHA as an alternative low cost adsorbent. Detailed performance analysis revealed that the percentage removal of two dyes increased with a decrease in initial dye concentrations; increase in adsorbent dose, contact time and shaker speed. The optimum dose of RHA was obtained as16 g/L. An equilibrium time of 135 min and optimum shaker speed of 110 rpm were recorded. The maximum percentage removal of dye mixture was 90.95%. Isotherm study indicated that the adsorption of two dyes followed Langmuir and Freundlich isotherm model. Feasibility studies confirmed that Langmuir and Freundlich isotherm models were favourable as per as experimental run. Error analysis followed Langmuir isotherm and to some extent Freundlich isotherm model equation. Kinetic study established that the data followed pseudo-second-order kinetic model. The entire study proved that RHA is a potential adsorbent for the removal mixture of two basic dyes from the aqueous solution.
REFERENCES
Anirban, K.C., Anupam, D. and Amitavo, B. 2011. Rice husk as a low cost adsorbent for the removal of methylene blue and congo red in aqueous solution, Clean, 37: 581-591. Bandosz, T.J., Jagiello, J., Contescu, C. and Schwarz, J.A. 1993.
Characterization of the surfaces of activated carbons in terms of the acidity constant distribution carbon, 31: 1193–1202. Chen, L., Ramadan, A., Lv, L., Shao, W., Luo, F. and Chen,
J. 2011. Biosorption of methylene blue from aqueous solution using lawny grass modified with citric acid, J. Chem. Eng. Data, 56: 3392–3399.
Dukkanci, M., Gunduz, G., Yilmaz, S. and Prihod’ko, R.V. 2010. Heterogeneous Fenton-like degradation of Rhodamine 6G in water using CuFeZSM-5 zeolite catalyst prepared by hydrothermal synthesis, J. Hazard. Mater. 181: 343–350.
G.L. Dotto, L.A.A. Pinto, 2011. Adsorption of food dyes acid blue 9 and food yellow 3 onto chitosan: stirring rate effect in kinetics and mechanism, J. Hazard. Mater., 187: 164–170. Hsu, N.H., Wang, S.L., Lin, Y.C., Sheng, G.D. and Lee, J.F.
2009. Reduction of Cr(VI) by crop-residue-derived black carbon, Environ. Sci. Technol., 43: 8801–8806.
J. Song, W. Zou, Y. Bian, F. Su, R. 2011. Han, Adsorption characteristics of methylene blue by peanut husk in batch and column modes, Desalination, 265: 119–125.
Khonde, R.D. and Pandharipande, S.L. 2012. “Artificial Neural Network modeling for adsorption of dyes from aqueous solution using rice husk carbon”, International Journal of Computer Application, 41(4): 1-5.
Pérez RO, Daiem MMA, Utrilla, J.R. et al 2012. Modeling
adsorption rate of organic micropollutants present in
landfill leachates onto granular activated carbon. J Colloid
Interface Sci., 385: 174–182.
Rafatullah, M., Suliman, O., Hashim, R. and Ahmad, A. 2010. Adsorption of methylene blue on low-cost adsorbents: a review, J. Hazard. Mater. 177: 70–80.
Roy, A., Chakraborty, S., Kundu, S.P., Adhikhari, B. and Mazumder, S.B. 2012. Adsorption of anionic Azo dye from aqueous solution by ligno-cellulose-biomass jute fiber: equillibrium, kinetics, and thermodynamics study, Ind. Eng. Chem. Res. 51: 12095–12106.
Sen, T.K., Afroze, S., Ang, H. 2011. Equilibrium, kinetics and mechanism of removal of methylene blue from aqueous solution by adsorption onto pine cone biomass of Pinus radiata. Water Air and Soil Pollution, 218: 1–17.
Senthil Kumar, P., Ramalingam, S., Senthamarai, C., Niranjanaa, M., Vijayalakshmi, P. and Sivanesan, S. 2010. Adsorption of dye from aqueous solution by cashew nut shell: studies on equilibrium isotherm, kinetics and thermodynamics of interactions. Desalination, 261: 52–60. Sotelo J, Ovejero G, Rodríguez A. 2012. Removal of atenolol
and isoproturon in aqueous solutions by adsorption in a fixed bed column. Int Eng Chem Res., 51: 5045–5055. Temkin, M.J. and Pyzhev, V. 1940. Recent modification to
Langmuir isotherms. Acta Physiochemical USSR, 12: 217–222.