Science Journal of Public Health
2013; 1(1) : 24-31Published online March 10, 2013 (http://www.sciencepublishinggroup.com/j/sjph) doi: 10.11648/j.sjph.20130101.14
Nutritional status and associated factors among adult
HIV/AIDS clients in Felege Hiwot Referral Hospital, Bahir
Dar, Ethiopia
Molla Daniel
1, Fekadu Mazengia
2, Dereje Birhanu
3,*1Amhara National Regional State Health Bureau, Nutrition officer, Bahir Dar, Ethiopia
2University of Gondar, College of Medicine and Health Sciences, Department of Public Health, Gondar, Ethiopia 3Bahir Dar University: College of Medicine and Health Science, Department of Public Health; Bahir Dar, Ethiopia
Email address:
molla_daniel96@yahoo.com (M. Daniel), mazengiafek23@gmail.com (F. Mazengia), firedereje@gmail.com (D. Birhanu)
To cite this article:
Molla Daniel, Fekadu Mazengia, Dereje Birhanu. Nutritional Status and Associated Factors Among Adult HIV/AIDS Clients in Felege Hiwot Referral Hospital, Bahir Dar, Ethiopia. Science Journal of Public Health. Vol. 1, No. 1, 2013, pp. 24-31.
doi: 10.11648/j.sjph.20130101.14
Abstract:
Background: HIV/AIDS and malnutrition effects are interrelated and exacerbate one another in a vicious cycle. HIV specifically affects nutritional status by increasing energy requirements, reducing food intake, and adversely affecting nutrient absorption and metabolism. In Ethiopia since its detection, has claimed lives of millions. Even in the era of ART, it could not be tackled since the dispute of malnutrition is unanswered. Therefore the study aimed to assess nutritional status and associated risk factors among adult HIV/AIDS clients in Bahir Dar, Ethiopia. Method: was facility based cross sectional survey in Felege Hiwot referral Hospital. On average 50-60 Pre-ART and/or on ART care clients were visiting the Hospital daily. Taking the first patient as case one, every 4th of daily attendances were interviewed using interviewer administered questionnaire and anthropometric measurements. SPSS version 16 statistical software was used to enter and analyze the data. Binary logistic regression was used to assess effect of factors on HIV/AIDS clients’ nutritional status. P value ≤0.05 was considered statistical significant. Results: 408 HIV/AIDS clients were interviewed, of them 104 (25.5%) were chronic energy deficient (BMI<18.5kg/m2); 36.5% from pre-ART, 63.5% from on ART care. Proportion of mildly, moderately, and severely malnourished participants were 64.4%, 19.2%, and 16.4% respectively. Females were most affected (56.7%). HIV/AIDS related symptoms 2weeks prior to the survey (AOR=1.93, 95% CL: 1.18-10.0); eating difficulty (AOR=1.80, 95% CL: 1.10-2.04); Pre ART clients (AOR=1.77, 95% CL: 1.08-2.90); and on ARV drugs < 12months (AOR=1.7, 95% CL: 1.04-3.78) were the predictors associated to malnutrition. Conclusions: Chronic energy deficiency was prevalent in PLWHA. HIV related symptoms, feeding difficulties and duration on ART were the predictors for malnutrition. Only increasing access to ART can’t solve problem of malnutrition, therefore nutrition therapy and support as an adjunct to the initiation of ART should be considered.Keywords: Malnutrition, Nutritional Status, HIV, Antiretroviral Therapy
1. Introduction
Back ground: - More than 33.2 million people are living with HIV throughout the world. The greatest burden of the disease is concentrated in developing countries, the least able to cope. In these regions, HIV/AIDS has deepened poverty and exacerbated food insecurity [1, 2].
HIV/AIDS and malnutrition effects are interrelated and exacerbate one another in a vicious cycle. HIV specifically affects nutritional status by increasing energy requirements, reducing food intake, and adversely affecting nutrient ab-sorption and metabolism. Asymptomatic and symptomatic
adults have energy requirements by 10% and 30% respec-tively to maintain body weight and physical activity [3-5].
Evidence has shown that adequate nutrition for a person living HIV (PLHIV) is necessary to maintain and improve the overall health and nutritional status. Promising devel-opments have been seen in recent years in global efforts to address AIDS epidemic by increasing the access to effective treatment and prevention programmes. Globally, the number of people accessing ART has been increasing; as a result more people living HIV are leading healthier and productive life [6-7].
Science Journal of Public Health 2013, 1(1) : 24-31 25
preventing opportunistic infections like tuberculosis and pneumonia, which are considered the hallmarks of AIDS patients [11, 12]. Ethiopia is one of the countries hit hardest by HIV epidemic alongside of malnutrition and it occurs in severe forms and affects many people either before or within the era of ART [14-16]. There is little evidence in Ethiopian context in general and in the study area in particular re-garding to the nutritional condition of peoples’ living HIV/AIDS whether they are in pre ART or ART care. Therefore the purpose of this study aimed to assess the nu-tritional status and associated risk factors for malnutrition of adult HIV/AIDS clients in pre-ART and on ART care in Felege Hiwot Referral Hospital, Bahir Dar, Ethiopia.
2.
Methodology
2.1. Study Design and Period
Facility based cross-sectional study was conducted from 16 Sept. to 16 Oct 2009.
2.2. Study Area and Setting
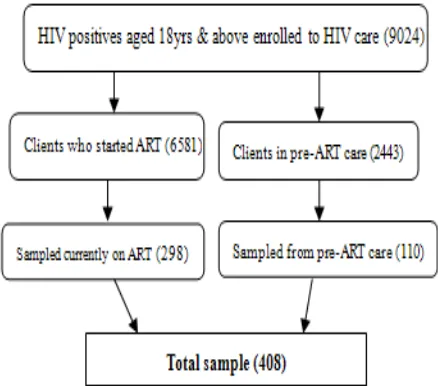
The study was carried out at Felege Hiwot Referral Hos-pital in Bahr Dar Ethiopia, the caHos-pital city of Amhara Re-gional State situated 565 Km Northwest of Addis Ababa. It was the only Hospital in the town. The Hospital was built in 1983 to serve about 25,000 people but now it is serving more than 5 million people. A total of 9024 adult HIV/AIDS patients have been enrolled to HIV/AIDS chronic care in Felege Hiwot Referral Hospital, of which 2443 were in pre-ART care, and 6581 were on ART care.
2.3. Source and Study Population
The source populations were the total cohort of HIV/AIDS patients who were enrolled to ART care clinic in Felege Hiwot referral Hospital and the study populations were people aged 18 years and older who were actively taking ARV drugs, and/or those who followed HIV/AIDS chronic care but not yet started ART.
2.4. Inclusion and Exclusion Criteria
Those who were actively following HIV/AIDS chronic care in Felege Hiwot Referral Hospital and aged 18years and older were included in the study while patients who were seriously ill and/or with spinal deformity were excluded.
2.5. Sampling Size Determination and Sampling Proce-dure:- Sample Size Determination
The required sample size was determined using single population proportion formula n= (z2* P (1-P)/ d2), where n
is the sample size, z is the standard normal score set at 1.96, d is the desired degree of accuracy and p is the estimated proportion of the target population. By taking p=40% (proportion of malnourished people living HIV/AIDS) [22], z= 1.96 and w=5%, the computed sample size was 369 and by taking 10.5% non response rate, the total sample size
computed was 408.
2.6. Sampling Procedure
From the total 9020 HIV/AIDS patients who were in pre-ART and on ART chronic care, 6581 were on ART and 2443 were on Pre-ART care. Therefore in order to select 408 participants from on ART and Pre-ART cases proportio-nately, we used mathematical equation. That means n1 = (N1*nf)/Nt. At the same time, n2= (N2/nf)/Nt, where n1 was the required sample size from ART care cases, n2 was the required sample size from Pre-ART care cases, nf was the total required sample size, N1was the total number of ART care cases, N2 was the total number of pre-ART care cases, and Nt was the total number of both on ART and on Pre-ART care cases. I.e., n1= (6581*408)/9020=298, and n2= (2443*408)/9020=110 cases were selected proportio-nately. Since nf= n1+n2, then a total of 298 cases from on ART care, and a total of 110 cases from Pre-ART care were recruited making the final sample size 408. According to the Hospital report, on average 50-60 Pre-ART and on ART clients were visiting the Hospital daily. Using the office hours and taking the first client as case one, every fourth of the daily attended during the data collection period were included and interviewed.
Fig. 1. Thematic presentation participant selection.
2.7. Data Collection Tool and Procedure
The data was collected from 16 Sept -16 Oct 2009 using semi structured interviewer administered questionnaire. Three data collectors (two ART adherence counselors, and one HIV/AIDS nurse specialist) and one supervisor were recruited and two days training was given. The data collec-tion process was followed daily by the supervisor and prin-cipal investigators.
26 Molla Daniel et. al: Nutritional status and associated factors among adult HIV/AIDS clients in Felege Hiwot Referral Hospital, Bahir Dar, Ethiopia
0.1KG.
Height measurement of participants was taken using the standard measuring scale. Participants’ takeoff their shoes, stand erect, and look straight in horizontal plain. The occipit, shoulder, buttocks, and heels touched measuring board and height was recorded to the nearest 0.01cm.
2.8. Data Quality Issues
The questionnaire was adapted and modified in to our context from previous literatures. It was prepared first in English and then translated into the local language Amharic, and then retranslated back to English by an expert who was fluent in both languages to maintain its consistency. Training was given for data collectors and supervisor. Pre testing of the questionnaire was made on 20 pre-ART and/or on ART care clients in the nearby Health Center a week prior to the actual survey. Data collection process was strictly followed day to day by the supervisor and principal investigators.
2.9. Data Processing and Analysis
Questionnaires were checked for completeness, coded, and entered into SPSS version 16 statistical package. Lo-gistic regressions analysis was computed to assess the as-sociations of the various factors against the level of malnu-trition. Variables with a p-value of less than 0.2 in the biva-riate analysis were entered into the final model. P value ≤0.05 at 95% CI was considered statistically significant. Strength of association between predictor and outcome variables was assessed using odds ratio.
2.10. Ethical Considerations
Prior to data collection, ethical approval was obtained from ethical review committee of University of Gondar, College of Medicine and Health Sciences, Department of Public Health. Permission was obtained from Amhara Re-gional Health Bureau and from Felege Hiwot Referral Hospital administrators. Verbal consent was taken from each participant after the purpose of the study was explained. They were told to withdraw at any time and/or to refrain from responding to questions they were not interested to respond. Participants were also informed that all the data obtained from them would be kept confidential using codes instead of any personal identifiers.
3. Result
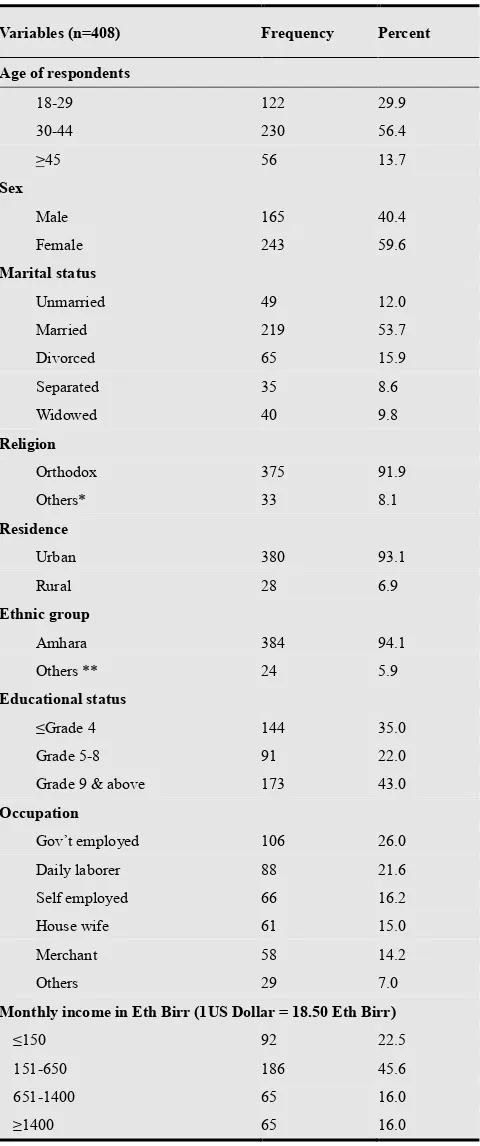
3.1. Socio-Demography Characteristics of Respondents
A total of 408 HIV/AIDS clients responded to the ques-tionnaire making the response rate 100%. Females ac-counted 243(59.6%), the majority 375(92%) were orthodox Christian and 384 (94.1%) from Amhara ethnic group. Most were urban dwellers 380(93.1%); and nearly half of the respondents (45.6%), monthly income range 151- 650 ETB (Table 1).
Table 1. Socio demographic characteristics of respondents at Felege Hiwot Hospital, Bahir Dar, Ethiopia, 2009
Variables (n=408) Frequency Percent
Age of respondents
18-29 122 29.9
30-44 230 56.4
>45 56 13.7
Sex
Male 165 40.4
Female 243 59.6
Marital status
Unmarried 49 12.0
Married 219 53.7
Divorced 65 15.9
Separated 35 8.6
Widowed 40 9.8
Religion
Orthodox 375 91.9
Others* 33 8.1
Residence
Urban 380 93.1
Rural 28 6.9
Ethnic group
Amhara 384 94.1
Others ** 24 5.9
Educational status
≤Grade 4 144 35.0
Grade 5-8 91 22.0
Grade 9 & above 173 43.0
Occupation
Gov’t employed 106 26.0
Daily laborer 88 21.6
Self employed 66 16.2
House wife 61 15.0
Merchant 58 14.2
Others 29 7.0
Monthly income in Eth Birr (1US Dollar = 18.50 Eth Birr)
≤150 92 22.5
151-650 186 45.6
651-1400 65 16.0
≥1400 65 16.0
Regarding to the nutrition and HIV/AIDS related cha-racteristics of participants; more than 2/3rd were in clinical stage III. One third had CD4 count <200 cells/µL, were
Science Journal of Public Health 2013, 1(1) : 24
Table 2. Nutritional status and socio demographic characteristics of adul HIV/AIDS clients in Felege Hiwot Referral Hospital, 16 Sept
Bahir Dar Ethiopia
Variables/ Response Frequency HIV related symptoms (n=408)
Yes 120
NO 288
Clinical stage (n=408)
Stage I 45
Stage II 61
Stage III 269
Stage IV 33
CD4 count(n=408)
<200 137
200-500 208
>500 63
Eating difficulty (n=112)
Loss of appetite 42
Appetite loss/vomiting 23
Vomiting 19
Swallowing difficulty 16
Others 12
Dietary counseling (n=408)
Yes 381
No 27
Change feeding style after knowing HIV status
Quality food 136
Frequency 101
Feeding cooked food 74
Others 6
Nutritional support (n=408)
Yes 74
No 334
Disclosure their status(n=408)
Yes 390
No 18
Regarding to respondent’s nutritional status
BMI was 20.5kg/m2±2.9. The proportion of chronic energy deficiency (BMI<18.5Kg/m2) was found
total participants, the age group 30-44 years
(56.4%) and the age group 18-29 accounted 29.9%. From the total 104 malnourished, the age group 30
most affected, 60 (57.7%) followed by the age group 18 years 31 (28.8%). Considering sex, from the total ticipants, females were 59.9%. From the total participants 59 (23.0%) and from the total ipants, 45 (27.3%) were malnourished 104 malnourished, females were more
(56.7% vs.43.3%) respectively. Considering participants residence, from the total 408 who participated in
380 (93.1%) were urban residents and from
were malnourished but from the total 104 malnourished, 99 (95.2%) were urban residents. From the total
participants, nearly half 186 (45.6%) were with an average income of 151-650 Ethiopian Birr, and from them 45(24.2%) were malnourished. From the total 408 participants, 92 (22.5%) were with an average monthly income of ≤150 Eth. Birr, and from them 29(31.5%) were malnourished. than two third of the malnourished were with
Science Journal of Public Health 2013, 1(1) : 24-31
Nutritional status and socio demographic characteristics of adult HIV/AIDS clients in Felege Hiwot Referral Hospital, 16 Sept-16 Oct 2009,
Frequency Percent
29.4 70.6 11.0 15.0 65.9 8.1 33.6 51.0 15.4 37.5 20.5 16.9 14.5 10.7 93.0 7.0
status (n=317) 43.0 32.0 23.2 1.8 18.1 81.9 95.6 4.4
respondent’s nutritional status, the mean he proportion of chronic energy found 25.5%. From the 44 years accounted 230 29 accounted 29.9%. From , the age group 30-44 were the followed by the age group 18-29 from the total 408
par-the total 243 female and from the total 165 male
partic-malnourished, but from the total females were more affected than males Considering participants participated in the study, from them 99 (26.1%) were malnourished but from the total 104 malnourished, 99 From the total 408 study participants, nearly half 186 (45.6%) were with an average 650 Ethiopian Birr, and from them 45(24.2%) were malnourished. From the total 408 participants, 92 (22.5%) were with an average monthly income of ≤150 Eth. were malnourished. More than two third of the malnourished were with an average
monthly income of ≤ 650 Ethiopian Birr (Table 3).
Table 3. Nutritional status and socio demographic characteristics of adult HIV/AIDS clients in Felege Hiwot Referral Hospital,
Bahir Dar Ethiopia
Variable n=408 Nutritional status Malnourished Age of respondents
18-29 31
30-44 60
>45 13
Sex
Male 45
Female 59
Marital status
Unmarried 12
Married 48
others * 44
Religion
Orthodox 94
Others** 10
Residence
Urban 99
Rural 5
Ethnic group
Amhara 99
Others *** 5
Educational status
≤grade 4 24
grade 5-8 41
Grade 9+ 39
Occupation
Gov’t employee 25
Daily laborer 25
Self employee 18
House wife 16
Merchant 15
Others 5
Monthly income
≤150 29
151-650 45
651-1400 16
> 1400 14
key * divorced/separated/widowed, ** Muslim /Agew
From the total 104 (25.5%) malnourished, 66 (63.5%) were those from
respectively and the (BMI17.0-18.4kg/m2), moderately and severely (BMI <16.0kg/m
67(64.4%), 20(19.2%) and 17(16.4%) respectively.
Figure 2. proportion of malnutrition among pre
HIV/AIDS patients in Felege Hiwot Referral Hospital , Bahir Sept 16 to Oct 16 2009
0% 50%
100% 36.5%
27
650 Ethiopian Birr (Table 3).
Nutritional status and socio demographic characteristics of adult HIV/AIDS clients in Felege Hiwot Referral Hospital, 16 Sept-16 Oct 2009,
Nutritional status
Frequency % alnourished Normal
91 122 29.9
170 230 56.4
43 56 13.7
120 165 40.4
184 243 59.6
37 49 12.0
171 219 53.7
96 140 34.3
281 375 91.9
23 33 8.1
281 380 93.1
23 28 6.9
285 384 94.1
19 24 5.9
67 91 22.3
132 173 4.2
105 144 35.3
81 106 25.9
63 88 21.6
48 66 16.2
45 61 14.9
43 58 14.2
24 29 7.1
63 92 22.5
141 186 45.6
49 65 15.9
51 65 15.9
widowed, ** Muslim/protestant,*** Oromo/Tigre,
104 (25.5%) malnourished, 38 (36.5%) & those from pre-ART and on ART care and the Proportion of mildly moderately (16.0kg/m2-16.9kg/m2 kg/m2) malnourishedclients were 67(64.4%), 20(19.2%) and 17(16.4%) respectively.
proportion of malnutrition among pre-ART and on ART adult HIV/AIDS patients in Felege Hiwot Referral Hospital , Bahir Dar Ethiopia
63.5%
28 Molla Daniel et. al: Nutritional status and associated factors among adult HIV/AIDS clients in Felege Hiwot Referral Hos
Descriptively those who were in Pre moderately and severely malnourished more than were on ART care but most of the participants who were
Figure 3. percentage of severity of malnutrition among adult 2009
Figure 4. Proportion of malnutrition in adult HIV/AIDS chronic care among Pre from 16 Sept. to 16 Oct. 2009.
From the total malnourished, females were more than males (56.7% vs.43.3%), even from pre
rished clients, more than 2/3rd (71%) were females, but the proportion of malnutrition among on ART care clients was relatively comparable between Females
(52%).
0% 10% 20% 30% 40% 50% 60%
70% 64.4%
19.2% 16.4%
57.8%
68.2%
21.1% 21.1%
0% 10% 20% 30% 40% 50% 60% 70% 80%
Pre AT
female 71%
Pre-ART
Nutritional status and associated factors among adult HIV/AIDS clients in Felege Hiwot Referral Hospital, Bahir Dar, Ethiopia
n Pre-ART care were and severely malnourished more than those who most of the participants who were on
ART care were mildly malnourished more than were in Pre-ART care but were
percentage of severity of malnutrition among adult clients in Pre ART and on ART, Felege Hiwot Referral Hospital, Bahir Dar
tion in adult HIV/AIDS chronic care among Pre-ART and on ART at Felege Hiwot Referral Hospital Bahir Dar, Ethiopia,
, females were more affected than males (56.7% vs.43.3%), even from pre-ART
malnou-(71%) were females, but the among on ART care clients was emales (48%) and Males
Figure 5. Nutritional status of chronic HIV/AIDS care clients considering sex of respondents at Felege Hiwot Referral Hospital, Bahir Dar, Ethiopia from 16 Sept to 16 Oct 2009
Factors affecting the nutritional status of HIV/AIDS clients who were in pre-ART and on ART care wer
using binary logistic regression. The analysis showed that HIV related symptoms within two weeks prior to data co lection; feeding difficulty, ART status, and duration on ART 16.4%
proportion of malnutrition
68.2%
18.2% 13.6%
On ART
male 29%
Female 48%
On-Nutritional status and associated factors among adult HIV/AIDS clients in
malnourished more than those who were not statistically significant.
ot Referral Hospital, Bahir Dar 16 Sept to 16 Oct
Hiwot Referral Hospital Bahir Dar, Ethiopia,
l status of chronic HIV/AIDS care clients considering Felege Hiwot Referral Hospital, Bahir Dar, Ethiopia
Factors affecting the nutritional status of HIV/AIDS ART and on ART care were assessed using binary logistic regression. The analysis showed that HIV related symptoms within two weeks prior to data col-lection; feeding difficulty, ART status, and duration on ART
proportion of malnutrition
Mild
Moderate
Severe
male 52%
Science Journal of Public Health 2013, 1(1) : 24-31 29
were found to have significant association on nutritional status of HIV/AIDS clients who were on chronic care. Odds
ratio with their corresponding 95% confidence level were summarized in table 4 below.
Table 4. Associated risk factors for malnutrition in HIV/AIDS clients in pre-ART and on ART care in Felege Hiwot Referral Hospital, 16 Sept to 16 Oct 2009, Bahir Dar Ethiopia. Variable/ Response
Nutritional status 95% CI
Malnourish Normal COR AOR
Sex
Female 59 184 0.86(0.55-1.34) 0.54(0.52-0.95)**
Male 45 120 1 1
Monthly income in ETB
≤150 29 63 1.48 (0.94-7.46) 1.74 (0.98 -11.0)
˃150 75 241 1 1
Symptoms 2wks prior to survey
Yes 41 79 1.85 (1.16-2.96)* 1.93(1.18-10.0)**
No 63 225 1 1
Eating difficulty
Yes 37 73 1.97(1.08-2.82)* 1.80(1.10-2.04)**
No 67 261 1 1
ART status
Pre-ART 38 72 1.86(1.16-3.0)* 1.77(1.08-2.90)**
ART 66 232 1 1
ART duration
≤ 12 month 20 44 1.86(1.0-3.45)* 1.70(1.04-3.78)**
>12months 46 188 1 1
Current CD4 count
>200 62 209 0.67(0.42-1.06) 0.67(0.42-1.08)
≤200 42 95 1 1
4. Discussion
Malnutrition and HIV/AIDS effects are interrelated and exacerbate one another in a vicious cycle. Both HIV/AIDS and malnutrition independently cause progressive damage to the immune system and increased susceptibility to infection. Since the introduction of ART, the prevalence of malnutri-tion has diminished but not yet disappeared. In this study the prevalence of malnutrition in HIV/AIDS clients who attend chronic care was 25.5%. The prevalence was much lower than a study done in India (72%) [17], Malawi (57%) [18]
But is higher than a study done in Boston (18%) [19], SSA (10.3%) [20], Lusaka Zambia (15.8%) [21], and in Addis Ababa 18% [22]. The difference may be due to residence, socio culture, economic and/or year of study.
The prevalence of malnutrition varied based on client’s ART status (ART and on ART). In this study, the pre-valence of malnutrition was higher in pre ART (34.5%) than on ART (21.1%) clients. The pre-ART finding is in agree-ment with [22, 23, 24], but the proportion of malnutrition among on ART care clients was higher than other studies [22, 23, 24]; the difference may possibly be due to poor adhe-rence to ART and/or to the counseling services.
Malnutrition could occur in different forms and degrees. When we consider the degree of malnutrition, it varies in different settings and circumstance. In our study for example, from the total malnourished; 64.4%, 19.2%, and 16.4% were in mild, moderate and severe malnutrition respectively. In other studies the proportion of the degree of malnutrition was 27% mildly, 31% moderately and 42% severely [17]; 22% mildly, 14% moderately, and 21% severely [18]; 31.7%
mildly, 25.9% moderately and 42.4% were severely mal-nourished [25]. From the above descriptive results, we looked differences in the distribution of degree of malnutri-tion. What so ever the difference in degree of malnutrition is; what clearly seen is HIV/AIDS related malnutrition is the major problem to HIV/AIDS patients.
30 Molla Daniel et. al: Nutritional status and associated factors among adult HIV/AIDS clients in Felege Hiwot Referral Hospital, Bahir Dar, Ethiopia
are the most responsible to prepare, feed, and care for the whole family. In addition in our society, factors that could lead to malnutrition such as alcohol consumption, cigarette smoking, are not practiced by females as compared to males. With regard to HIV/AIDS related symptoms, those who develop disease symptoms two weeks prior to the survey, were almost two times more malnourished than those who were free of symptoms, AOR=1.93, 95% CL (1.18 - 10.0).
Implying that, clients in chronic care should be strongly advised to take preventive actions and to seek medical care as soon as possible.
It is known that infection could affect nutritional status, either through loss of appetite, oral/throat sore, and/or due to other gastroenteritis problems. In this study clients who suffered from eating difficulties prior to the survey were nearly two times more malnourished than those who didn’t have eating difficulty, AOR= 1.80, 95% CL (1.10-2.04)
implying that counselors should take action in educating what to do when clients are complaining difficulty of feed-ing so that preventive actions and early management of symptoms would be carried which could reduce occurrence of malnutrition.
From the total malnourished, those who were on pre- ART care were malnourished 1.5 times more than those who were on ART care, AOR= 1.77, 95% CL (1.08 - 2.90), this could possibly be due to the fact that those who were on Pre-ART care may not give much attention on what to eat, how fre-quent to eat, what precaution to take regarding on feeding as they may consider themselves healthy as other community groups and also counselors may not tell them what to and not to do to pre-ART clients than those who were on ART care. But who were on ART were those enrolled to take ARV drugs as they were with low CD4 count, could improve their nutritional status as they may adhere better to ART treatment and to the counseling they were given by counselors. Therefore, counseling should focus to Pre-ART care clients as what is being done regularly to on ART care cases and possibly the enrollment criteria may need also be seen and revised so that problem of malnutrition could be better ad-dressed and reduced.
In this study, those who were on ARV drugs less than 12 months were 1.7 times more malnourished than those who took the drug more than a year, AOR=1.7, 95% CL (1.04 - 3.78), this showed thatadherence to ARV treatment conten-tiously and consistently throughout the life of an individual would help to improve the nutritional status of individuals. Educational status, Occupation, WHO clinical stage, monthly income, and disclosure status didn’t show any significant effect on clients’ nutritional status.
5. Limitation of the Study
Cross-sectional design by its very nature can’t establish cause and effect relationship. The survey didn’t assess the degree of malnutrition using body weight loss calculated by reference to the usual body weight.
6. Conclusion
A quarter of participants were in chronic energy defi-ciency, of which nearly 2/3rd of the malnourished were in mild malnutrition.
Sex of respondent, HIV related symptoms, ART status, duration of ART, and eating difficulty were the predictors to malnutrition.
Due attention should be given to the mildly malnourished cases because they think they are healthy
HIV related symptoms and eating difficulty should be prevented and treated as early as possible.
ARV treatment should be accompanied by nutrition sup-port through governmental & non-governmental organiza-tions.
Abbreviations
AOR, Adjusted Odds ratio; AIDS, Acquired Immunode-ficiency Syndrome; ANRS, Amhara National Regional state; ARV, Antiretroviral; ART, Antiretroviral Treatment; BMI,
Body Mass Index; Center for Diseases Control;CSA,
Cen-tral statistic Authority; FBO, Faith Based Organization; FMOH, Federal Minister of Health; HAART, Highly Active Antiretroviral Treatment; HBC, Home Based Care; HIV, Human Immunodeficiency Virus; NGO, Non Governmental Organization; OI, Opportunistic Infection; PLHIV, People Living HIV; PLWHA, People Living With HIV/AIDS; PMTCT, Prevention of Mother to Child Transmission; SPSS, Statistical Package for Social Studies; SSA, Sub Saharan Africa; UN, United Nation; WHO, World Health Organiza-tion;
Competing interests
The authors declare that we have no competing of interests.
Authors’ Contributions
All authors (DB, MD, and FM) contributed to the design of the study, MD contributed to data collection and data entry. DB, MD and FM performed the data analysis. DB drafted the manuscript. All authors critically revised and approved the final manuscript.
Acknowledgement
We are highly indebted to Amhara Regional Health Bu-reau, Bahir Dar Ethiopia, for sponsoring this research project. We would like to extend our thanks to Felege Hiwot Referral Hospital Administrators for permitting us to con-duct the study. We would also like to extend our appreciation to the study participants, supervisors and data collectors.
References
Science Journal of Public Health 2013, 1(1) : 24-31 31
AIDS epidemic Update December 2007, pp1-214. Switzer-land Geneva
[2] The United States President’s Emergency Plan for AIDS Relief Report on Food and Nutrition for People Living with HIV/AIDS, 05, May, 2007.pp25-30
[3] Stephen D. WORLD AIDS DAY the role of nutrition in living with HIV/ AIDS.01-Dec-2008.pp 12-15
[4] Daniel J. Raiten, Steven G. and Stephen A. Nutritional con-siderations in Resource-limited settings Consultation on Nutrition & HIV/AIDS in Africa: Evidence, lessons & recommendations for action 10-13 April 2005.
[5] Bonnard, Tony C., Bruce C., Leslie E., Sandra R. and Caro-line NUTRITION and HIV/AIDS: Evidence, Gaps, and Priority Actions Academy for Educational Development (AED) prepared by Ellen Piwoz of the Support for Analysis and Research in Africa (SARA) project with inputs from Patricia 2006.
[6] The International Bank for Reconstruction and Develop-ment/the World Bank. HIV/AIDS, nutrition, and food secu-rity: what we can do. A Synthesis of international guidance, 2007).
[7] UNAIDS Report. Millennium Development Goals, Six things you need to know about the AIDS response today. 2010).
[8] Rachael M. Duke University Positive Living: Nutritional Realities and Interventions for People Living with HIV. May 2008.
[9] Emily W., MD and Rachel R. Malnutrition HIV in Site Knowledge Base Chapter University of California San Francisco, October 2006
[10] Asgeir J., Ezra N., Bernard J et al. Predictors of mortality in HIV-infected patients starting antiretroviral therapy. In Tanzania Ural hospital. 22 April 2008.
[11] Food and Nutrition, Technical, Assistance Project (FANTA). Food and Nutrition Implications of Antiretroviral Therapy (ART) in Kenya A Formative Assessment February 2005.pp45-46
[12] Dale Ames Kline, MS, RD, CNSC, LD. Prevalence and pattern of HIV-related malnutrition among women in sub-Saharan Africa HIV/AIDS. HIV/AIDS: Immune Func-tion & NutriFunc-tion, July 2008.pp3-5.
[13] Tang A., Jacobson DL, Spiegel man D et al. Increasing risk of 5% or greater unintentional weight loss in a cohort of HIV infected patients, 1995 to 2003.
[14] Daniel J. Raiten, Steven G. and Stephen A. Consultation on Nutrition and HIV/AIDS in Africa: Evidence, lessons and recommendations for action, April, 2005.pp35-36
[15] The International Bank for Reconstruction and develop-ment/World Bank Nutrition, and food Security: what we can do. A Synthesis of international guidance 2007:
[16] The Federal Democratic Republic of Ethiopia Ministry of Health National Nutrition and HIV/AIDS Implementation Reference Manual. Ministry of Health Sept. 2008.
[17] Sati B, Garg DK, Purohit SD, Rathore R, Haag A, Mora C; Prevalence of malnutrition among HIV infected individuals in Rajasthan, India. Jul: 2004 abstract no. MoPeB3267.
[18] R.Zacharia, M.P.Spiemann, A.D.Harries and F.M.L.salanponi moderate to sever malnutrition in a patient with tuberculosis is a risk factor associated with early death; National Tuberculosis control program of Malawi commu-nity health science unit private; 2002, page 65,
[19] Olalekan A Uthman. Prevalence and pattern of HIV-related malnutrition among women in sub-Saharan Africa: me-ta-analysis of demographic health surveys, July, 2008
[20] Mangili A, Murman DH, Zampini AM et al. Nutrition and HIV infection: review of weight loss and wasting in the era of highly active antiretroviral therapy from the nutrition for healthy living cohort. Clinical Infectious Diseases, 2006, 42: 836-842.
[21] Kelly, P.; Summerbell, C.; Ngwenya, B.; Mandanda, B.; Hosp, M.; Fuchs, D.; Wachter, H.; Luo, N. P.; Pobee, J.O.M.; Farthing, M.J.G.Systemic immune activation as a potential determinant of wasting in Zambians with HIV-related diarr-hea. Qjm. 89(11):831-837, November 199625.
[22] MOH and HAPCO, Monthly HIV Care and ART Update, by site as end of December 9, 2008 pp-2
[23] WHO, Department of Nutrition for Health and Development, Nutritional considerations in the use of ART in re-source-limited settings Consultation on Nutrition and HIV/AIDS in Africa: Evidence, lessons and recommenda-tions for action Durban, South Africa 10−13 April 2005, World Health Organization 2005
[24] Scevola D, Barbarini G, Bottari G, et al. International Con-ference on AIDS, Prevalence, etiology and management of AIDS in malnutrition, Jun 1991, Abstract no.W.B.2169.