Copyright © 2016 by Academic Publishing House Researcher
Published in the Russian Federation
European Journal of Economic Studies
Has been issued since 2012.ISSN: 2304-9669 E-ISSN: 2305-6282
Vol. 16, Is. 2, pp. 345-352, 2016
DOI: 10.13187/es.2016.16.345
www.ejournal2.com
UDC 332.1
The Influence of the Program of Preparation for the Olympic Games on the Indicator of Quality of Life in Sochi city
Andrey S. Kopyrin a , *
a. Sochi state university, Sochi, Russian Federation
Abstract
The problem of quality of life measurement of the population is especially actual for the analysis of "megaevents" consequences – large investment projects on carrying out actions of nation-wide importance. The purpose of this work is to conduct research of current trends of change of an standard of living indicator in the city of Sochi. In issue the method of calculation of an integrated indicator of a quality of life is presented and the analysis of dynamics of this parameter in the course of preparation for a megaevent (the winter Olympic Games) and after it is carried out.
Keywords: standard of living, quality of life, integrated index.
1. Introduction
Measuring the population standard of living is an important task for public managers at both the municipal and regional level. Growth rate of economy, volumes of GDP and GRP are abstract numbers. For the planning of policies and the correcting economic actions it is especially important to know what impact this actions will exert on the population and their welfare. This problem is particularly relevant for the analysis of consequences of "mega-events" - large investment projects for the activities of national importance. In modern conditions in Russia there take place several similar events - the Universiade in Kazan 2011, the APEC summit in Vladivostok 2012, the Winter Olympics in Sochi 2014, preparations for the 2018 FIFA World Cup.
The purpose of this paper to conduct a study the change in the standard of living indicator in the city of Sochi before implementation of the program of preparation for the winter Olympic Games in Sochi, during it and after it.
For realization of the specified purpose it is necessary to solve the following tasks:
to analyze approaches to the definition of "standard of living" and "quality of life" of the population;
to define the methodology for calculating the integral index;
to collect statistics on main indicators characterizing socio-economic system of the city in terms of population welfare;
to build a model;
* Corresponding author
to draw conclusions.
The object of study - the socio-economic system of Sochi
Subject of research - the socio-economic interrelations and indicators reflecting quality of life of the population of the municipality
Information and documentary base for the study were the statistical data of the Federal State Statistics Service. Research was performed on the example array of statistical information characterizing the development of the macroeconomic system of Russia and Sochi-city.
2. Study Area
Quality of life and standard of living differ both terminologically and substantially, first of all on "dimensions". The standard of living is the indicator reflecting welfare of the population and the degree of satisfaction of basic needs (income level, a possibility of satisfaction of basic needs citizens for food, housing, drugs etc.). It depends on the rates of economic development of society.
"Quality of life" is much wider concept, which operate with the representatives of several sciences: economists, geographers, sociologists, demographers and others. It includes a whole series of indicators. In this setting, integrated from a variety of statistics rather complex multi-formula, it is possible with the maximum objectivity to estimate the level and dynamics of social development both certain regions, and the countries in general (Andreeva, 2013).
At measurement of quality of life by scientists three main approaches are offered (Malyugina, 2013): objective (statistical or quantitative), subjective (qualitative) and combined.
Objective, or quantitative, approach is the most common among all techniques of research. When using this method the quality of life is measured through parameters of the objective conditions and processes of life, expressed in absolute and relative statistics.
This approach has several advantages. Firstly, low cost of the project. The study and analysis of statistical data are quite accessible and cheap way of research. Secondly, the availability of analysis materials. Almost all statistics are easily got in state statistics bureaus and do not require almost no material and physical costs. Thirdly, the possibility of comparison of other regions and the countries with given data. However, there are disadvantages of this approach. Using an objective method completely eliminates the human factor The quality of life is, above all, the satisfaction of the conditions of human existence and their compliance with the objective conditions of life of the individual subjective needs. Despite this drawback, governments often use this approach for monitoring the quality of life of their regions
The second approach consists in studying of satisfaction of basic components of quality of life with sociological methods. It is called subjective or qualitative method. This method allows to study the public opinion on the conditions of its existence, the degree of satisfaction with standard of living, completeness and quality of the consumed goods and services. The quality of life of the individual depends on a set of factors: the economic well-being, the safety of life, the conditions for the mental and cultural development of the individual etc. It is known that needs of the personality for each case are individual and the degree of their satisfaction is also individual. The study of public opinion on the satisfaction of the basic components of quality of life by methods of mass sociological polls allows to consider the opinions of people of different social groups, different income, education and age.
Besides, unlike statistical data, the real assessment of the quality of life of people able to reflect not only the level of consumption of material, cultural and other benefits, but also the degree of their satisfaction with the quality, completeness and timeliness of these benefits. Despite the fact that this method has significant advantages, it should be noted some shortcomings. Firstly, this method is quite costly. Usually during the sociological research on the quality of life using a questionnaire method, the costs depend on the size of the population is polled. The organization of this kind of field research requires considerable monetary and physical costs. Secondly, the organization of research demands special preparation not only organizers of research, but also all performers. Thirdly, in spite of the fact that this method allows to determine quite precisely "temperature" of social and economic health of society, nevertheless it can not give an assessment of real costs of requirements satisfaction of society.
(statistical) and qualitative (got by methods of sociological poll) data. The scheme of calculation of the integrated indicator is submitted in fig. 1.
Fig. 1. The mixed approach to calculation of an indicator "Quality of life"
This method allows to consider a problem comprehensively - both from objective living conditions, and from the point of view of satisfaction with them of the people who are in these conditions. Despite the researches of expense demanded for carrying out, it is possible to claim about correctness of these expenses from the point of view of completeness of the obtained data (Belyaeva, 2009).
3. Discussion
The most developed approach to a problem of criteria of level and quality of life is the quantitative method of research. The significant contribution to research of the specified categories and development of a calculations technique were brought by the UN (Talalushkina, 2013). In 1960 the working group of the UN prepared the report on the principles of definition and measurement of a standard of living on a global scale. It was the first attempt to create complex system of indicators of a population standard of living. In 1970 the summary index was offered by the Research institute of social development of the UN. This index received the name "index of social development" and included 16 of the major (9 social and 7 economic) interdependent indicators. The statistical commission of the UN suggests to consider a standard of living of the population of various countries through a prism of conditions of population activity, consumption level, employment and freedom.
In 1978 the calculation procedure was corrected and included the following groups of indicators:
1) birth rate, mortality and other demographic characteristics of the population; 2) sanitary and hygienic living conditions;
3) consumption of foodstuff; 4) housing conditions; 5) education and culture;
6) working conditions and employment; 7) income and expenses of the population; 8) cost of life and consumer prices;
9) vehicles;
12) freedom of the person.
In 1990 the UN offered the new concept of measurement of economic development called by the concept of human development. Human development is understood "as process of expansion of freedom of people to lead long, healthy and creative life, on implementation of other purposes which, in their opinion, have value; to participate actively in ensuring justice and stability of development on the planet".
As reflection of this concept within the Development program of the UN the human development index (HDI) was offered. The index represents the integrated indicator characterizing longevity, education and literacy, and also a standard of living.
Thus the most recognized systematization of indicators of a standard of living includes four main sections:
1. basic indicators of a standard of living with subsections: income, cost of life and consumption, ratio of the income and cost of life, poverty level;
2. indicators of population living conditions (characteristic of security, the social sphere, etc); 3. demographic parameters;
4. climatic conditions.
The fullest and objective comparison of a population standard of living in regions provides their comparison on all set of the indicators characterizing the level and living conditions, with carrying out quantitatively removed versatile estimates.
In this work the technique of calculating the integral index of quality of life is used. It is based on an index method of multidimensional association of indicators. It is accepted that the vast majority of the selected indicators has unambiguous, positive or negative interpretation, i.e. higher numerical value of an indicator testifies to a qualitative increment (in the best or the worst) the party of the characteristic of a certain aspect of economic and social situation of the population in the region.
Indicators are divided into three groups: demographic, social (indicators of living conditions) and economic. As research assumes comparison of indicators of one region during the different periods of time, indicators of the climatic section can be removed.
For calculating the index of quality of life demography indicators, economic indicators of a standard of living, the social sphere, a consumer commodity market and services, security of the population with housing, security of the population with automobiles and crime rate were used. Let's list them:
1. Demographic group
1.1. Mortality per 1000 (a negative indicator). 1.2. Birthrate per 1000.
2. Economic group
3.1. An average monthly salary.
3.2. Ratio of wages to the subsistence minimum 3.3. Retail trade turnover per capita.
3.4. Area of housing per capita.
3.5. Provision of population with cars per 1000 2. Social group
2.1. Number of schools per 100000 2.2. Provision of physicians per 10000 2.3. Provision of hospital beds per 10000 2.4. Number of reported crimes per 100000
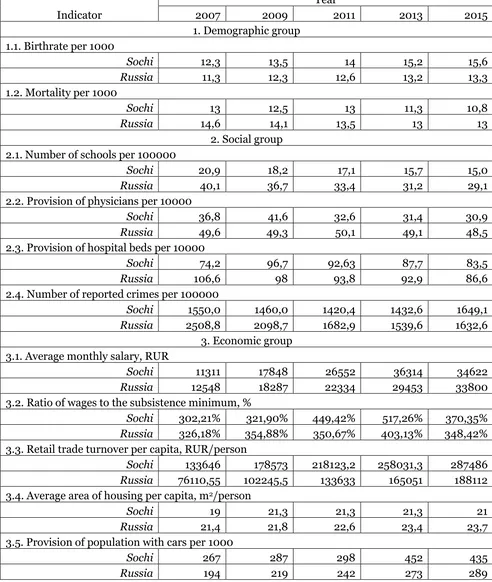
Table 1. Statistical indicators of Sochi-city
Indicator
Year
2007 2009 2011 2013 2015
1. Demographic group 1.1. Birthrate per 1000
Sochi 12,3 13,5 14 15,2 15,6
Russia 11,3 12,3 12,6 13,2 13,3
1.2. Mortality per 1000
Sochi 13 12,5 13 11,3 10,8
Russia 14,6 14,1 13,5 13 13
2. Social group 2.1. Number of schools per 100000
Sochi 20,9 18,2 17,1 15,7 15,0
Russia 40,1 36,7 33,4 31,2 29,1
2.2. Provision of physicians per 10000
Sochi 36,8 41,6 32,6 31,4 30,9
Russia 49,6 49,3 50,1 49,1 48,5
2.3. Provision of hospital beds per 10000
Sochi 74,2 96,7 92,63 87,7 83,5
Russia 106,6 98 93,8 92,9 86,6
2.4. Number of reported crimes per 100000
Sochi 1550,0 1460,0 1420,4 1432,6 1649,1
Russia 2508,8 2098,7 1682,9 1539,6 1632,6
3. Economic group 3.1. Average monthly salary, RUR
Sochi 11311 17848 26552 36314 34622
Russia 12548 18287 22334 29453 33800
3.2. Ratio of wages to the subsistence minimum, %
Sochi 302,21% 321,90% 449,42% 517,26% 370,35%
Russia 326,18% 354,88% 350,67% 403,13% 348,42%
3.3. Retail trade turnover per capita, RUR/person
Sochi 133646 178573 218123,2 258031,3 287486
Russia 76110,55 102245,5 133633 165051 188112
3.4. Average area of housing per capita, m2/person
Sochi 19 21,3 21,3 21,3 21
Russia 21,4 21,8 22,6 23,4 23,7
3.5. Provision of population with cars per 1000
Sochi 267 287 298 452 435
Russia 194 219 242 273 289
%
100
%
100
*
x
x
x
y
, (1)%
100
%
100
*
x
x
x
y
, (2)y - normalized index, x - an indicator characterizing the analyzed region,
x
- an indicator ofthe national average. Thus, after the normalization procedure, all the indicators are positive criteria reflecting the percentage value of the factors relative to the average level.
To build a unified assessment criteria for the group their geometric mean was calculated (formula (3)). To find a single integrated assessment of the quality of life in the conditions of the hypothesis of equal indicators value the arithmetic mean was calculated (formula (4)).
n
n
y y
y
y 1* 2*...* , (3)
y
- group integral index, yi – indicator of the group3
e s d
y
y
y
QL
, (4)QL – Quality of life index, ys – social index, yd – demographic index, ye – economic index. The resulting calculations are summarized in Table 2.
Table 1. Integral indicator of quality of life
Indicator
Year
2007 2009 2011 2013 2015
1. Demographic group 109,90% 110,55% 107,34% 114,11% 117,11%
1.1. Birthrate per 1000 108,85% 109,76% 111,11% 115,15% 117,29%
1.2. Mortality per 1000 110,96% 111,35% 103,70% 113,08% 116,92%
2. Social group 78,11% 85,71% 78,52% 75,53% 74,77%
2.1. Number of schools per 100000 52,15% 49,69% 51,17% 50,41% 51,40% 2.2. Provision of physicians per
10000 74,19% 84,38% 65,07% 63,95% 63,71%
2.3. Provision of hospital beds per
10000 69,61% 98,67% 98,75% 94,40% 96,42%
2.4. Number of reported crimes per
100000 138,22% 130,43% 115,60% 106,95% 98,99%
3. Economic group 112,33% 114,60% 123,61% 130,09% 117,30%
3.1. Average monthly salary, RUR 90,14% 97,60% 118,89% 123,29% 102,43% 3.2. Ratio of wages to the
subsistence minimum, % 92,65% 90,71% 128,16% 128,31% 106,29%
3.3. Retail trade turnover per capita,
RUR/person 175,59% 174,65% 163,23% 156,33% 152,83%
3.4. Average area of housing per
capita, m2/person 88,79% 97,71% 94,25% 91,03% 88,61%
3.5. Provision of population with
cars per 1000 population 137,35% 130,81% 123,14% 165,51% 150,62%
QUALITY OF LIFE 100,11% 103,62% 103,16% 106,58% 103,06%
Quality of life
70,00% 80,00% 90,00% 100,00% 110,00% 120,00% 130,00% 140,00%
2006 2007 2008 2009 2010 2011 2012 2013 2014 2015 2016
year
%
1. Demographic group 2. Social group 3. Economic group QUALITY OF LIFE
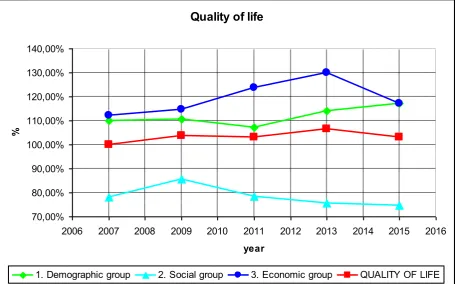
Fig. 2. The dynamics of the estimated indicators
From the submitted graphs it is visible that indicators of various groups of factors show opposite dynamics. The economic index during the preolympic period had a weak tendency to growth that was reached generally by the increased income of the population in the period of large-scale investments and construction. However after the termination of the investment program the relative income dropped more than by 20 % and with them also all economic index sharply decreased.
The social index on the contrary shows almost monotonous recession. Practically all indicators making it either fall, or do not grow. It is connected with this obstacle: infrastructure investments do not grow, and the population of the city increases that considerably lifts load of the available social infrastructure.
The demographic index has a steady tendency to growth. And both the mortality indicator, and birth rate have the best dynamics than the average Russian indicators. This circumstance allows to have since 2009 in the city a steady natural increase which along with migratory provided growth of the population of the city more than for 17 % for the eight-year period (from 401,4 to 477,5 thousand people in average annual calculation).
4. Recommendations and Conclusions
Proceeding from the results of modeling given above, it is possible to formulate conclusions: 1. Indicators a standard of living and quality of life are not identical each other. The first reflects economic parameters of welfare, the second includes wider range of factors.
2. The general quality of life in Sochi corresponds to an average value about the country with an insignificant tendency to increase
3. Influence of the megaevent on quality of life of the population of the city is ambiguous. Factors of the social sphere decrease, demographic – increase. Economic indicators showed growth during the preolympic period, but after end of the Olympic Games sharply worsened.
When carrying out further researches it is expedient to expand a technique of creation of an integrated indicator of quality of life due to inclusion of quality standards, and also to carry out the comparative analysis of influence of megaevents on other cities of the country, for example, Kazan and Vladivostok
References
Andreeva, 2013 – Andreeva O.N. (2013). The system of indicators of the living and quality of life of the population. Oykumena. Regionovedcheskie issledovaniya. №1 (24).
Belyaeva, 2009 – Belyaeva L.А. (2009). Standard and quality of life. Problems of measurement and interpretation, Social Investigations, № 1.
FSSS, 2016 – FSSS. Population (2016). http://www.gks.ru/wps/wcm/connect/
rosstat_main/ rosstat/ ru/statistics/population/
Kopyrin, 2009 – Kopyrin A.S. (2009). Influence of implementation of the Program of preparation for XXII Winter Olympic games on social and economic system of the region of Sochi. Regionalnaya ekonomika. Teoriya i praktika. №9
Malyugina, 2013 – Malyugina A.N. (2013). The concept of quality of life and living standart: key approaches to performance assessment. Issues of XVII International science conference «Reshetnevskie chteniya», Krasnoyarsk, SibGAU.
Municipal database, 2016 – Database municipal indicators. http://www.gks.ru/free_doc/ new_site/ bd_munst/ munst.htm
Passport of Sochi, 2010 – Sochi. Passport – Krasnodar (2010). Krasnodarkraystat.
Report, 2013 – Report on the implementation of the Programme of socio-economic development of Sochi in 2013 (2013). http://www.sochiadm.ru/gorodskaya-vlast/administration-city/deyatelnost/ekonomika/reestr/32857/
Report, 2015 – The report of the Head of the Sochi-city about achieved values of the performance of local governments for 2015 and the planned values in the 3-year period (2015). http://www.sochiadm.ru/gorodskaya-vlast/administration-city/deyatelnost/ekonomika/65383/