Int. J. Curr. Res. Biosci. Plant Biol. 2015, 2(1): 16-29
News Letter
Financing Public Health Care:
Insurance, User Fees, or Taxes?
Welfare Comparisons in Tanzania
Deograsias P. Mushi*
University of Dar es Salaam, Mlimani, Dar es Salaam, Tanzania.
and Senior Research Fellow at the EcomResearch Group, Dar es Salaam, Tanzania.
*Corresponding author
A b s t r a c t
C o n t e n t s
This study is part of the efforts seeking to carry out a comprehensive analysis of the community insurance scheme and user fees for public health care in Tanzania. The paper begins with a background that provides a summary of the controversies and achievements of user fees in poor countries, and Tanzania in particular. The discussion focuses on two issues: one is whether user fees are better than insurance schemes in public health care financing; and the second is whether one can charge for public health services, and at the same time achieve universal access to these services.
The results of this study show that the Community Health Fund (CHF) is more expensive than the user fees currently in place at the primary level facilities in Iringa and Kilosa district councils. The main barrier to joining the fund is the annual premium fee that is considered too high and non-affordable by majority of households. There is a clear indication that a reduction in the premium fee is more socially desirable at the community level than abolition at the moment. The concern that the poor would suffer significantly from fees when accessing primary health facilities is not borne out in this study. Though we do not rule out possibility of extreme cases. Much concern arises from the amount that has to be paid rather than the inability to do so, per se. Setting lower rates to start with would gradually pave the way to realistic user charges.
THE RESEARCH PROBLEM AND QUESTIONS
LITERATURE REVIEW
THE APPROACH TO THE STUDY
METHODOLOGY AND DATA Theoretical Arguments
Framework for Empirical Analysis Hypotheses
Sources of Data
RESULTS AND DISCUSSIONS
Descriptive Observations Illness and Poverty
Payment Options For Primary Health Care And Welfare
CONCLUSIONS AND EMERGING POLICY ISSUES
INTRODUCTION
For about two decades now, debates on the impacts of user fees on the public health sector have not clearly been conclusive. While Uganda, for example, recently decided to abandon these fees, Tanzania is looking to extend user fees to the sub-district primary health facilities. Welfare concerns feature as major controversial issues in community contributions towards the improvement of public health services; leading to the question: what is the best way to finance public health services? This paper is part of those efforts seeking to carry out a comparative analysis of the community insurance scheme and user fees for public health care in Tanzania. The paper begins with a background that provides a summary of the controversies and achievements of user fees in poor countries, and Tanzania in particular, before outlining the problem context of this study. The rest of the paper is organised in three sections: Methodology of the Study, Results and Discussion, and Conclusion and Emerging Policy Issues.
International Journal of Current Research in
Biosciences and Plant Biology
Int. J. Curr. Res. Biosci. Plant Biol. 2015, 2(1): 16-29
THE RESEARCH PROBLEM AND QUESTIONS
Efforts to address resource gaps in public expenditure on health care in Tanzania began a long time ago. To date, short-term sources of funds appear to have alleviated the problem, and therefore issues of sustainability remain critical. As the government s revenue performance, measured by the ratio of tax to GDP, remains inelastic (retain it) and one of the lowest in sub-Saharan Africa, non-tax contributions from communities stand as the only viable and sustainable means of complementing budgetary allocations to the provision of health care services. Thus, given this country s fiscal performance, the concern of whether to charge or not should not be emphasized; who should pay, how much he or she should pay and how to pay is the real challenge in question. Are user fees better than insurance schemes for financing health care?
Since fees for health care imply an increase in its price of access, dealing with the resulting negative effects is another challenge as well. How does one charge a fee for public services and at the same time ensure universal access, which is of great interest to the public?
LITERATURE REVIEW
Towards the late 1980 s, concerns as to whether the government of Tanzania could sustain its ever expanding public health sector started to surface (Mbelle, 1991). At the same time, these concerns had emerged in many other countries. The general trend was that the financial shortfalls in the public health sector were ever increasing. Although there had not been a concrete consensus that user fees could form part of the solution to the financial shortfalls in the health sector, many countries had already started to revisit their health sector policy by the year 1990.
Parallel to the health sector policy review, health care utilization studies in developing countries by Lewis (1985) had concluded that price would not be a deterrent to accessing public health care services. Many other studies had similar conclusions. Meyer s (1985) results from a study in Mali suggested that there would be little or no change in the expenditure pattern if prices were raised and all else held constant. Similar results were observed in the Philippines and Malaysia. Gather and Van dergaag (1990) found that user fees could be introduced even when demand is elastic. Also, a number of studies in other countries found that demand for health care is price inelastic. (Heller, 1982; Akin et al., 1985; Griffin and Shaw, 1995; Mwabu et al., 1986; Griffin, 1999; Bethnel el al., Kanji, 1989; Yonder, 1989; Waddington and Enyimayew, 1990).
Looking at the persistent resource shortages in the public health sector on one hand, and the emerging conclusions that fees would work with a minimal or zero impact on utilization of public health care services; a number of countries introduced reforms targeted to mobilise additional resources for the health sector. Tanzania was one of those countries that introduced reforms to improve its public health services in the early 1990 s.
Knowing that people might have a different opinion about user fees in the public health services, the government of Tanzania in 1990 commissioned a study on the potentials of user fees and public opinion in regard to their willingness to pay the fees. The study suggested that 80% of people in Tanzania were prepared to contribute towards improving services in the health sector (Mujinja and Mabala, 1992; Smith and Rawal, 1992). Similar studies in other countries had indicated similar positive results. (Weaver and Smith, 1993; Forsberg, 1994; etc.)
Based on the conclusions from studies on the potential of user fees, and the then popular debate that the fees would alleviate financial gaps in the health sector; the government of Tanzania introduced user fees in public hospitals in 1993. Since then, there have been a number of studies that seek to survey the impacts of user fees on health services. In general, the studies indicate that dropouts from public hospitals increased as a result of the introduction of user fees (Hussein et al, 1997; Mushi, 1996; Mhamba and Kamuzora, 1998; Tibandebage et al., 1999; Mushi, 2001; etc.). However, there are parallel arguments that the dropouts included cases of frivolous visits to public hospitals that were necessary to control for more effective use of the health sector resources. Similar studies in other countries also observed that utilization of public health services declined with the introduction of user fees (Mwabu et al; 1995; Booth et al; 1995; Hongoro and Chandiwana, 1994; Staton et al; 1989; etc).
Int. J. Curr. Res. Biosci. Plant Biol. 2015, 2(1): 16-29
The study observed some improvement in health services as a result of the user fees though most respondents opined that the exemptions and waivers were not granted to those most in need.
Parallel to user fees in public hospitals, the government of Tanzania introduced pilot Community Health Fund schemes to a few selected districts in 1999. Under the CHF, households may join the fund by paying a pre-determined fixed annual premium for free access to public health facilities by a maximum of ten members from each participating household. Alternatively, users may choose to pay a fixed user fee of 1,000 Tshs per each episode of illness attended to in public health facilities.
To date, CHF schemes in Tanzania have had varying impacts. It has been observed that membership of the CHF is generally low and its contribution to total collections from fees is around only 20% (Abt Associates Inc., 2002). Kapinga and Kiwara (1999) show that CHF and user fees had increased remarkably in Igunga and drug shortages had been resolved. However, compliance with CHF was observed to be low, 5% and 4.1% for the Igunga and Singida districts, respectively.
Looking at the performance of user fees in Tanzania for both the hospital and dispensary levels, we observed that drugs availability had improved, but access to public health services had recorded a decline, at least at the hospital level. We also noted that fees in the health sector in Tanzania are of three forms: User fees, the CHF and the newly introduced health insurance scheme for civil servants. An ordinary household in a CHF pilot district has two options: to either join the CHF or pay the annual premium, or to pay 1,000 Tshs for each episode of illness attended to at public health facilities. Otherwise an exemption or a waiver, as stipulated in the user fees implementation manual, must apply.
Three scenarios of public health care financing emerge in Tanzania: user fees, insurance and budgetary allocations. This paper sets out to make welfare comparisons between user fees and insurance, and also between the two and the option for free public provision of health services. As a result, the study needed to be carried out in areas where user fees and the CHF are in place.
THE APPROACH TO THE STUDY, METHODOLOGY AND DATA
Theoretical Arguments
Proponents of fees in public health services are convinced that, up to a point, poor quality of health services triggers public willingness to pay towards some improvement of the services. A social planner, therefore, wishes to choose a fee,
p
, such that social welfare for health care is maximised. This is true if we assume a social welfare function which is quasi concave in the fees. This assumption is valid if we assume further that the fee increases quality and access to government health care services (e.g. by reducing travelling costs, full utilization possibilities, quick recovery etc.).
While the social planner chooses
p
(the fee) to maximize social welfare, individuals choosex
h (amount of public careconsumed by individual
h
) to maximize welfare. We will assume an initial equilibrium in which individuals make their choices, given the other constraints they face. We will then consider a change in one of the equilibrium variables and determine the resulting chain reaction that creates a new equilibrium. The sum of the marginal effects in welfare determines the deviation from the old equilibrium; it is negative or positive by setting the old equilibrium at zero change. Let s consider an individual,h
, with the following increasing strictly quasi-concave and twice continuously differentiable welfare function:)
,
(
h h, h hx
y
s
V
U
(1)
can trade off his/her expenditure between private and public good consumption or between non-health care
private consumption (
y
h) and formal health care consumption (x
h) or informal health care (y
h). Think of anintroduction of a small quality improving user fees in public health care. Individual
h
welfare function in (1) becomes:)
,
),
(
),
(
(
h h hh
s
y
p
Q
Q
x
V
U
Int. J. Curr. Res. Biosci. Plant Biol. 2015, 2(1): 16-29
where
Q
is quality. Consider the fee as a lump sum payment, such as an insurance, which does not vary directly with the consumption ofx
. The reader may wish to consider a budget constraint of the form:h h h
p
ls
m
qy
, (3)
for
q
= price ofy
andm
disposable income andl
is the price ofs
. Ifq,
l
andm
are held constant, changes inx
hand
Q
hare attainable through a trade-off withy
hands
h. Our concern here is to determine the marginal effectsresulting from a change in
p
on the welfare of individualh
rather than his/her maximisation behaviour. To do this, we make three more plausible assumptions:(i) Income is fixed;
(ii) Trading-off within individual
h'
s
consumption bundle is possible; and (iii) The trade-off will take place as long as welfare doesn t fall.We start by considering a fee,
p
,
which has a neutral effect on individualh'
s
welfare, and using (02) we havep
s
s
V
p
y
y
V
Q
x
x
V
p
Q
Q
V
h h h h h h h h h.
.
.
.
(4)A
B
C
D
A
andB
are marginal welfare gains from increased quality and access to public health care, respectively; and;C
andD
are marginal sacrifice in consumption of non-health care and informal health care, respectively. To see how changesin
p
affect welfare of different individuals, we consider the different scenarios where the change in welfare is greater than, or less than zero. This is the same as comparing between the marginal gain from consumption of quality public health care and the sacrifice made in private consumption to generate the quality effect. Letp
s
s
V
and
p
y
y
V
and
Q
x
x
V
p
Q
Q
V
h h h h h h h h h h.
,
.
,
.
.
(5)Hence,
Taking it that quality is a normal good; increases with income, while is decreasing in income but negative. Think
of
s
as an inferior good such that the poor consume more of it than the rich. This would imply that h hs
V
is decreasing in income. And hence implying further that and are relatively small and negative for the well to do households. Hence, for the non-poor, a marginal change in the price of health care for quality improvement will reduce private consumption (both y and s) because the gain in welfare from quality health care more than offsets the negative effect from private consumption. For the poor, is bigger than , and is likely to be positive since a price increase reduces their real incomes. Consequently, the user charge increases consumption of informal care by the poor and that of modern care by the rich. The ultimate effect on social welfare depends on the composition of the targeted population.
Int. J. Curr. Res. Biosci. Plant Biol. 2015, 2(1): 16-29
)
.
.
(
)
.
.
(
p
s
ds
V
p
y
y
V
V
Q
x
x
V
p
Q
Q
V
V
h h
h h
h h h
h h
h h h
h
(6)
Let the left hand side of (6) be equal to Q and the right hand side equal to C so that
Q C
z
, (7)where
z
is the net social marginal effect of the fee. Thus, Q is the social marginal utility of income in quality public healthcare. Analogously, c is the social marginal utility of private consumption. Hence,z
is the net social marginalwelfare for a marginal trade-off between private consumption and the quality of public health-care. It is the social marginal gain resulting from marginal change in the user fee. A feasible fee therefore, is one, which fulfils the following condition:
0
z
, (8)i.e. the fee is at least as good as without it. If the user fee is such that consumption of public health services increases, access to government subsidies will increase. Fees in public health care will increase social welfare as long as their net social marginal benefit is positive and sufficiently adequate to offset the fall in welfare that arises from the effect of the fee on government tax revenue and private consumption. For individual
h
,
implies that he/she is not willingto pay the user fee; individual direct payments reduce his/her welfare. This implies further that
0
p
x
hand his/her
access to government health subsidies decreases. Where
0
p
x
h, we have a pure quality effect and access to public care does not change. Hence, the source of a change in welfare is actually whether individual direct payments to the publicly provided health care yield more welfare than tax payments; and in particular, whether one form of payment is better than the other.
Framework for Empirical Analysis
Hypotheses
We consider two scenarios in the practical measurement of price effects in public health care, the first best and the second best.
First-Best Scenario
Under the first-best scenario, we compare the benefits a household receives from consumption of public health care and the tax that it would pay if improvement of health services had not been financed by user fees, i.e.
1
t
g
versus
f
t
g
oInt. J. Curr. Res. Biosci. Plant Biol. 2015, 2(1): 16-29
Where
g
is the value of public health services consumed in the past twelve months,t
o is the tax paid by individualh
in the period to finance public health care,
f
is the fee paid to supplement the public funding andt
1 is the tax thathousehold
h
would have to pay if the additional resources had been raised through additional taxes.However, we have indicated earlier that the tax system in Tanzania is inelastic to the GDP, let alone the high costs that would be incurred to administer such a tax in rural settings. Thus, fees are generally superior to specific taxes. It is needless to say that fees are at least as bad as tax financing, i.e.
f
t
t
1 o (11)Second-Best Scenario
We understand that for every visit or episode of illness attended to at a primary public health facility, a non-CHF patient has to pay 1,000 Tshs. If we let individuals state their reservation fees, the deviations from the current rate of 1,000 Tshs constitute the gain or loss in welfare per visit from the individual s point of view. Let
r
be the amount householdh
iswilling to pay per every episode of illness attended to. Also, let
x
h represent the frequency of visits to public healthfacilities during the period
t
. Then, the social welfare gain from the current user fee of 1,000 Tshs for periodt
is, for example::)
,...
3
,
2
,
1
(
)
1000
(
r
x
w
hh
H
H h
h
, (12)
where
w
his social welfare weight.In the case of CHF, equation (12) is modified to consider pre-payments as follows:
H h
h h
B
w
R
)
(
(13)
Where
R
is the annual amount a householdh
is willing to pay as a CHF premium andB
is the actual fee required, which is 5,000 Tshs in our case.However, equations (12) and (13) are simple indications of the gains from fees, what we do not know yet is who suffers the most from user fees. The poor segments of the population are the real challenge in question, even if the two equations yield positive gains. Thus, computations by different income groups, and the poor in particular, would give an indication of the welfare effects. A comparison of user fees and an insurance premium would bring out the preferred method of financing. We start by stating the following hypothesis:
An insurance scheme is superior to user fees, i.e. h
h
r
B
(14)
Int. J. Curr. Res. Biosci. Plant Biol. 2015, 2(1): 16-29
A community insurance scheme cares for the poor much better than user fees, i.e. from the previous derivations we have
p
x
B
x
H h
h H
h h
(15)
Thus, comparison by income groups should give indications of the effects. Alternatively, social welfare weights can be used to compute the effects.
Sources of Data
The implied data from both the research problem and the hypotheses of this study constitute information from household profiles and health care providers. Considering that CHF is still in its pilot stage in Tanzania, we selectively carried out provider and household surveys in Iringa and Kilosa CHF pilot districts. The household survey was administered in selected wards of the two districts. The selection of sample wards was based on the differences in socio-economic characteristics, particularly income.
Random interviews were then carried out at the village level. Five hundred households were covered by interviews in the two districts. The provider survey targeted to collect matching facility data for the communities captured in the household survey.
RESULTS AND DISCUSSIONS
Descriptive Observations
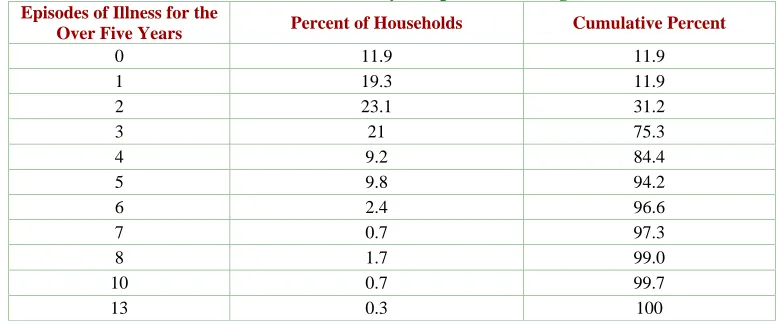
The Ministry of Health cost sharing implementation manual states clearly that children of age five and below are statutorily exempted from fees for health services in Tanzania (URT, 1994 & 1997). Since this paper is concerned with fees structure, compliance rates and welfare, the analysis selectively covers the over-five-years, who are included in the cost sharing policy. The focus is on episodes of illness in households; how they were attended, payments for treatment and the implication on household choices and welfare. Thus, the core relevant sample in our analysis is the over five-years group who fell sick during the last four weeks or last twelve months inclusively, at the time of the survey.
The survey data from Iringa (R) and Kilosa show that 56.6% of the members of households interviewed in the survey reported at least one episode of illness during the last twelve months. Of those reporting illness, 52% were over five years in age. We note further from Table 1 that many households in the survey had between 1-5 episodes of over five-year illness during the last twelve months.
Table 1: Distribution of illness for over five years persons during the last twelve months.
Episodes of Illness for the
Over Five Years Percent of Households Cumulative Percent
0 11.9 11.9
1 19.3 11.9
2 23.1 31.2
3 21 75.3
4 9.2 84.4
5 9.8 94.2
6 2.4 96.6
7 0.7 97.3
8 1.7 99.0
10 0.7 99.7
Int. J. Curr. Res. Biosci. Plant Biol. 2015, 2(1): 16-29
Illness and Poverty
The survey data included information on household consumption, which is similar to that used in the computation of adult equivalent monthly consumption in standard household budget surveys (HBS). From the data, same equivalent consumption was computed and poverty profiles were established as per the standard format in the HBS reports.
The results show that 16% of the sample from the two districts is poor. Of those poor, 46% reported illness during the last twelve months. And of all reporting illness from the sample, 13% were poor. Analogously, 59% of the non-poor reported illness during the last twelve months. Further analysis of the distribution around the sample mean per capita consumption shows similar patterns of reporting behaviour; the above-average income group reports higher morbidity rates compared to their counterparts (i.e. 63.6% versus 54.1%).
We note that the reported morbidity rates for the non-poor are higher than those of the poor, indicating that the poor may have a relatively lower degree at which a health problem is perceived as an illness requiring medical consultation. Consequently, health care consultations by the poor are lower regardless of the costs of access. This implies further that the poor are doubly disadvantaged in user fee health care regimes; they are poor and by implication they consume less care; and; they perceive less illness and therefore consult for health care less often than the non-poor.
Payment Options for Primary Health Care and Welfare
Choice of Provider of Health Care
Of all the persons reporting illness during the last twelve months, 21% did not seek consultations at formal primary health care facilities. We do not find significant differences between income groups, although by implication, the poor consulted health facilities less often than the non-poor, due to their perception of the illness as a health problem requiring medical attention.
We also find in Table 2 that about 20% of the patients bought medicine directly from pharmacies. Public health facilities, particularly primary service outlets, are the main source of medical care. Also, we do not find significant differences between the poor and the non-poor in regard to the choice of provider.
Table 2a. Choice of the provider of medical care.
Type of Medical Facility Percentage of Non-poor Consulting
Percentage of Poor Consulting
Percentage of All Consulting
Private hospital 6.7 4.4 6.5
Regional hospital 13.5 9.4 13
Government district hospital 3.3 2.5 3.2
Government regional hospital 3.8 1.9 3.6
Government dispensary 27.8 32.5 28.4
Public referral hospital 0.1 0.1
Traditional/witch doctor 1 0.6 0.9
Pharmacy 19.6 21.9 19.9
Int. J. Curr. Res. Biosci. Plant Biol. 2015, 2(1): 16-29
Table 2b. Reasons for not seeking medical care.
Stated Reason Percent of Non-poor Stating
Percent of Poor Stating Percent of All Who Didn t Seek Care
Minor illness 40.6 75 43.8
No one to accompany the sick
10.6 9.7
Could not afford to pay for medical services
3.8 12.5 4.5
Lack of money to pay for transport
24.4 6.3 22.7
Chronic diseases 8.7 6.3 8.5
Other reasons 11.9 10.8
Payment Options and Welfare
Basically, there are three forms of payments that are currently in operation at public health facilities in Tanzania, either as pilot projects or countrywide programmes. The user-fee scheme in public hospitals is the oldest, followed by the Community Health Fund which is now being piloted in selected districts. The government has also recently introduced a health insurance scheme for civil servants.
Under the CHF scheme in Iringa and Kilosa, households may join the fund and pay a fixed annual premium of 5,000 Tshs for free access to public health services for a maximum of ten members of the household. Non-CHF members have to pay a fixed user fee of 1,000 Tshs for each episode of illness attended to at public service outlets.
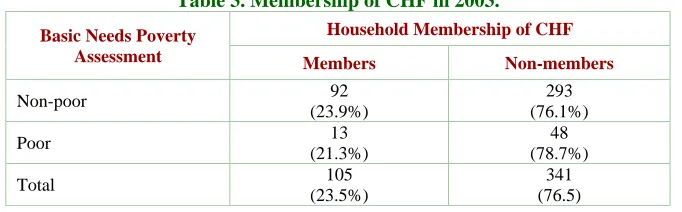
Table 3. Membership of CHF in 2003.
Household Membership of CHF Basic Needs Poverty
Assessment Members Non-members
Non-poor 92
(23.9%)
293 (76.1%)
Poor 13
(21.3%)
48 (78.7%)
Total 105
(23.5%)
341 (76.5)
Assessment of membership to CHF in 2003 shows a general compliance rate of 23.5% (Table 3). CHF is marginally more popular to the non-poor than to their counterparts. However, we observe that majority of households in the sample are not members of the fund; and by default, they opt for the user-fee scheme.
The observed low membership to CHF suggests that either the fund is more expensive/unpopular than the user fee scheme, or simply that it is not affordable, or both. To bring out the explanation, we analyse the payment options made by households in settling their medical bills during the last twelve months. We then find out potential comparable costs if a different payment scheme had been opted for.
Fig. 1 shows savings from payment options for public medical care. The horizontal axis shows frequency of episodes of illness by categories of households as reported for the last twelve months. The vertical axis indicates mean savings/user fees under the different payment options for each category of household. The graph shows interesting results.
Int. J. Curr. Res. Biosci. Plant Biol. 2015, 2(1): 16-29
Fig. 1: Potential and actual household expenditure on medical consultations.
Last year's episodes of adult ilness in households
13 .00 10
.00 8.00 7.00 6.00 5.00 4.00 3.00 2.00 1.00 .00
M
ea
n
s
av
in
gs
/
u
se
r
fe
es
i
n
T
sh
s
15000 10000 5000 0 -5000 -10000
SAVINGS FROM CHF
Potential userfees
if all sick consult
Potential savings if
all consult as CHF
Actual saving by non
members last year
Second, we observe from Fig. 1 that under the current structure of fees, households with five or less episodes of illness, which are the majority in the sample, would substantially lose by joining the CHF compared to the user fee scheme. However, households indicating more than five episodes of illness would benefit by joining the CHF.
Third, and more interesting, is the actual saving from user fees by non-CHF members as indicated for the last twelve months. About 99% of households who had sick members spent less than what they would have paid under the CHF.
The results from Fig. 1 imply that the CHF is more expensive than the user fee scheme. Thus, the low compliance rate observed in Table 2 is mainly a result of too high premium rates for the CHF. As indicated later in this paper, most households would prefer to pay less than the current rate of 5,000 Tshs per annum.
Table 4: CHF Compliance and drop-outs by income groups.
Particulars % of Non-poor % of Poor % of All
CHF membership 23.9 21.3 23.5
Drop outs from CHF 8.8 4.9 8.3
Never been CHF members 67.3 73.8 68.2
Int. J. Curr. Res. Biosci. Plant Biol. 2015, 2(1): 16-29
Table 5: Household size and poverty
Percent of Households Household Size
Non-poor Poor All
1-5 64.1 27.9 59.2
6-10 34.3 67.3 38.7
Over 10 1.6 4.8 2.1
Gain in Welfare by Non-CHF Households
Considering that bulk of the costs of the provision of public health services are borne by the government, and the observed persistent drug shortages in primary health facilities, non-CHF households appear to benefit more by opting for the user-fee scheme.
Table 6. Welfare gains from opting out of the CHF.
Percentage Gain in Adult Equivalent Consumption Percentage of Non-CHF Households Benefiting
Less than zero 1.1
0 17.2
0.001 to 1 64
>1 17.7
Table 6 reveals that non-CHF households increased their per capita consumption as a result of savings from opting out the CHF. The table shows that 17.2% of non-CHF households did not suffer any loss in consumption from not joining the CHF. Likewise, 64% of the households increased their per capita consumption by between 0.0001 to 1%. And 17.7% had a more than 1% increase in per capita consumption. These results confirm further that there are no incentives for joining the CHF from the household welfare point of view. In fact, there are gains in welfare as households opt out of the CHF. Of course medical services at the health facility are the same regardless of the method of payment. And therefore, the gain does not imply substitutability between consumption and medical expenses, but rather pure saving from paying via the user fee scheme.
However, there are many reasons why people do not join the CHF. As observed from the results in Table 7, many households indicated that they opt out of the CHF because of the lack of money or it was too expensive to pay the annual premium. The indications provide further evidence that the CHF is too expensive. In particular, the poor find it difficult to pay for the CHF (Table 7). Included in the reasons for not joining the CHF is bad management and poor services. For example, it has been observed that CHF members are attended second after those with cash at hand, this creates a disincentive to join the fund, and therein a shift from it to the user fee scheme.
Basically, the user fee scheme gives flexibility of choice of the provider between public and private, and between the two and pharmacies, and soon. The CHF scheme gives such options at costs over and above the entry annual premium. Thus, by implication, poor services at public health facilities is a serious disadvantage to the CHF member households.
Table 7. Reasons for not joining the CHF.
Reason % of non-poor
indicating % of poor indicating % of all
Lack of money or too
expensive to pay 59.6 77.7 61.8
Poor management 11.1 19.4 12.1
Not aware of CHF 4.1 0 3.6
Poor services 21.9 2.8 19.6
Other reasons 3.3 0.1 2.9
Would a Reduction in the CHF Premium Increase Compliance?
Int. J. Curr. Res. Biosci. Plant Biol. 2015, 2(1): 16-29
general indications that the fees are significantly popular if the rates are carefully re-considered. But more interesting is the analysis of the indications of willingness to pay the CHF by the non-members (Table 8). We note from the table that compliance with the current CHF premium (5,000 Tshs) by the non-members is 25%. Thus, it is an indication that majority would want a lower rate, particularly a rate that is not more than 3,000 Tshs. We do not observe significant differences between the poor and the non-poor in regard to the amount that should be paid out as CHF annual premium fee.
Table 8: Willingness to Pay for CHF by Non-members
Stated Amount Percentage of Non-poor Stating
Percentage of Poor
Stating Percentage of All Stating
0 1.2 0 1
200-1,000 16.9 23.5 17.7
1,500-2500 33.9 29.5 33.4
2,600-3000 19.7 23.5 20.1
3,500-3,000 25.1 23.5 25
Over 5,000
3.2 0 2.8
By implication, the results suggest that compliance would be more than doubled if the premium fee would be set at a rate between 2,000-3,000 Tshs.
CONCLUSIONS AND EMERGING POLICY ISSUES
The CHF is more Expensive than the User Fee
This study found out that the CHF is more expensive than the normal user fees currently in operation at the primary facility level in Iringa and Kilosa districts. The main barrier to joining the fund is the annual premium fee that is considered too high and not affordable by the majority of households. There is a clear indication that a reduction in the premium fee is more socially desirable at the community level than abolition
The Impact on the Poor is Small
The concern that most of the poor would suffer significantly from fees in primary health facilities was not borne out in this study. Possibilities of extreme cases cannot be ruled out, however. Much concern arises from the amount that has to be paid rather than inability to do so per se. Setting lower rates to start with, would gradually pave the way to realistic fees.
Wider Geographical Coverage Would I increase Compliance and Reduce Poverty
But more critically, one would argue that given the spatial distribution of the current public health facilities, and the accompanying transport costs in accessing these facilities, free public health services have serious equity implications. Arguably, those who have to pay transport costs to access health services are double disadvantaged; they incur costs in addition to the normal medical care costs; and also, they spend a lot of time to travel to health facilities, particularly when an illness has to be re-attended several times. Earlier on, we observed that the poor consult when they are seriously sick, and by implication, the attendance rates for them are relatively higher, and thus implying additional costs over and above the travelling costs of the non-poor. Furthermore, when local health services are poor, people will have to travel longer distances in search of appropriate medical care, thus incurring even more transport costs and time. This has implications for the household s economic activities and welfare. Thus, cutting down the travelling costs and time would potentially increase compliance and significantly reduce poverty. This would be possible if government funds were used to ensure the availability of very basic health services at the nearest location, and at the same time strengthened community contributions to address quality gaps in the short term.
Inefficiencies at Public Facilities Creates Additional Costs for CHF Members
Int. J. Curr. Res. Biosci. Plant Biol. 2015, 2(1): 16-29
disadvantage to CHF members. Ensuring that the quality of health services corresponds with the level of fees is a strong pre-condition for the success of CHF schemes.
User Fees Should Precede the CHF
In my opinion, implementing an insurance scheme in a regime or community where even user fees have never been would be difficult. Small affordable user fees could be introduced first, in order to accustom people and communities with the user pays service systems. Then people would speculate on the gains from purchasing a health insurance.
CHF Could Be the Best Option
It is also observed that if compliance were guaranteed, CHF would be the best in financing health care as it shifts the incidence of the burden of financing away from the patient. However, without proper synchronization of the user fees and the insurance schemes that are currently in operation in Tanzania, people will still opt for direct payments rather than CHF.
REFERENCES
Ahmed S. et al., (2003). Changing health-seeking behaviour in Matlab, Bangladesh: do development interventions matter? Health Policy and Planning; 18(3): 306-315. Oxford: Oxford University Press.
Bocar K., et al. (2004). Differential willingness of household heads to pay community-based health insurance premia for themselves and other household members. Health Policy
and Planning; 19(2): 120-126. Oxford: Oxford University
Press.
Bonu. S., M. Ran and D. Bisha, (2003). Using Willingness to pay to investigate regressiveness of user fees an health facilities in Tanzania . Health Policy and Planning;
18(4): 370-382. Oxford: Oxford University Press, UK.
Booth, D., et al. (1994), Coping with Cost Recovery . A study of the Social Impact of and Responses to Cost Recovery in Basis Service (Health and Education) in Poor Communities in Zambia. A Report to SIDA Commissioner through the Development of Social Anthropology, Stockholm University.
Frederic, I., (1998). Health in Rural Tanzania: The determinants of health status, health care demand and health care choice'', Discussion Paper Series (DPS) 98.03. Leuven: Departement Economie, Katholieke Universiteit. Gertler, P. and Van de Gaag, (1990). The Willingness-to-pay
for Medical Care: Evidence from Two Developing Countries. Baltimore and London: Johns Hopkins University Press.
Gilson, L. (1997). The Lessons of User Fee Experience in Africa , Health Policy and Planning, 74(12):751-757. Oxford: Oxford University Press, UK.
Griffin, C. (1992). ``Welfare Gains from User Charges for Government Health Services''. Health Policy and
Planning, 7 (2): 177-180. N. P.: N. P.
Hongoro, C. and S. Chandiwana, (1994). The Effects of
Enforcement of User Fees on the Health care Delivery System in Zimbabwe. A study financed by UNICEF
Harare, Harare Blair Research Laboratory and Ministry of Health and Child Welfare.
Husein, A. K. and P. G. M. Mujinga, (1997). Impact of user charges on government health facilities in Tanzania. East
African Medical Journal, 74 (12): 751-757. N. P.: N. P.
Kamuzora, P. and R. Mhamba, (1998). Health Services Provision at Local Level in the Context of Health-Sector Reform in Tanzania . A research report submitted to the joint research committee, ENRECA, University of Dar es Salaam.
Kanji, N. (1989). Charging for Drugs in Africa: UNICEFs Bamako Initiative . Health Policy and Planning 4(2): 110-20. N. P.: N. P.
Litvack, J. and C. Bodart, (1993). User Fees plus Quality Equals Improved Access to Health Care: Results of a Field Experiment in Cameroon . Social Science and Medicine,
37:369-83. N. P.: N. P.
Lohr, K., et al. (1986). Effects of Cost Sharing on Use of Medically Effective and Less Effective Care . Journal of
Medical Care, 24: S31-S38. N. P.: N. P.
Mbelle, A. (1991). Implications of Imposing Realistic User Charges for Public Sector Services on the Household in Tanzania. A Paper presented at a SIDA Socio-Economic Group Discussion in May 1991.
Mbugua, J.K. Bloom G. H. And Segall M. M. The Impact of User Charges on Vulnerable Groups: The Case of Kibwezi in Rural Kenya . Social Science and Medicine 1995;
41(6): 829-835. N. P.: N. P.
Mushi, D. P. (1996). Cost Sharing in Health Services in Tanzania: Preliminary Impact on Quality, Affordability and Accessibility. A Case Study of Selected Regions . Research report submitted to CDR-Copenhagen and the Economic Research Bureau, University of Dar es Salaam. _________ User Fees and Quality of Health Services: Quid
Pro Quo or Deterrence , The African Journal of Finance
and Management, Vol. 12 No2, 2004. N. P.: N. P.
_________ (Forth coming) User financing of public Health care: Does willingness Imply Ability to Pay?, Journal of
Population and Development.
_________2004. Fees at the Dispensary Level in Tanzania: Is Universal Access Compromised? Project Brief No.5 on Formative Research on Local Government in Tanzania.
REPOA, CMI and NIBR Publication Series.
Int. J. Curr. Res. Biosci. Plant Biol. 2015, 2(1): 16-29
Submitted to the Ministry of Health Tanzania, November 2003.
_________Demand and welfare in health care: Effects of asymmetric information and user charges. PhD Thesis. Oxford University, UK.
Mwabu, G., J. Mwanzia, and W. Liambila, (1995). User Charges in Government Health Facilities in Kenya: Effects on Attendance and Revenue . Journal of Health Policy
and Planning, 10 (2): 164-70. N. P.: N. P.
Nyonator F. and J. Kutzin. Health for Some? The Effects of User Fees in the Volta Region of Ghana Health Policy
and Planning, 1999; 14(4) 127-134. N. P.: N. P.
Obrien, B. (1989). The Effects of Patient Charges on the Utilization of Prescription Medicines . Journal of Health
Economics: 110-130. N. P.: N. P.
Reddy, S. and J. Vandemoortele, (1996). User Financing of
Basic Social Services; A Review of Theoretical Arguments and Empirical Evidence, New York: Office of Evaluation
and Planning, UNICEF.
Russell, S., J. Fox-Rushby, and D. Arhin, (1995). Willingness and Ability to Pay for Health Care: A Selection of Methods and Issues , Journal of Health Policy and
Planning, 10 (1): 94-101. N. P.:N. P.
Shaw, P. and C. Griffin, (1995). Financing Health Care in
Sub-Saharan Africa through User Fees and Insurance.
Washington, D.C.: The World Bank.
Smith, B. and P. Rawal, (1992). Health Sector Financing Study
for the Government of Tanzania. Report on the Potential
for Cost Sharing - First Report.
Staton, B. and J. Clemence, (1989). User Fees for Health care in Developing Countries: A Case Study of Bangladesh .
Journal of Social Science and Medicine, 29: 1199-1205. N.
P.: N. P.
Stoddart, G. and M. Baker, (1981). Analysis of Demand and Utilization through Episodes of Medical Services in Van der Gaag, J., and M. Perman, (eds.), Health, Economics,
and Health Economics. Amsterdam. N. P.
Waddington, C. J. and K. A. Enyimayew, A Price to Pay Part Two: The Impact if User Charges in Volta Region of Ghana , International Journal of Health Planning and
Management 1990; 5:287-312. N. P.: N. P.
URT, Ministry of Health. Assessment of the impacts of cost sharing in public hospitals. Various.