http://www.sciencepublishinggroup.com/j/sjph doi: 10.11648/j.sjph.20170504.17
ISSN: 2328-7942 (Print); ISSN: 2328-7950 (Online)
Effect of Storage and Exposure to Sunlight on the Quality
of Sachet Water Sold in Ibadan Metropolis
Ikpeazu Joy Chinenye
1, Oluwayiose Oladele Amos
21Environmental Health Department, Abia State College of Health and Management Technology, Aba, Nigeria
2
Environmental Health Sciences Department, University of Ibadan, Ibadan, Nigeria
Email address:
[email protected] (I. J. Chinenye)
To cite this article:
Ikpeazu Joy Chinenye, Oluwayiose Oladele Amos. Effect of Storage and Exposure to Sunlight on the Quality of Sachet Water Sold in Ibadan Metropolis. Science Journal of Public Health. Vol. 5, No. 4, 2017, pp. 321-328. doi: 10.11648/j.sjph.20170504.17
Received: April 18, 2017; Accepted: May 8, 2017; Published: July 3, 2017
Abstract:
Inadequate pipe borne water supply has led to rapid proliferation of sachet water companies in Nigeria. Recently, another dimension added to public health concerns on water quality is the storage and handling of sachet water by distributors and vendors. This study assessed the effect of storage and exposure to sunlight on the quality of sachet water in Ibadan, Nigeria. An experimental design was adopted. Two hundred sachets of water from ten brands were collected upon production from various factories. Water samples were divided into two groups: storage indoor (room temperature) and storage with exposure to sunlight for four weeks. Physicochemical and bacteriological analyses were carried out on the sachet water samples at baseline and after three days and weeks one to four of storage. The data obtained were analysed using SPSS (20.0). The bacteria isolated were E. coli,S. aureus, K. pneumonia and P.vulgaris. Total bacterial counts decreased in the order: 0 to 1.5x10⁴cfu/100 mL (day 3) > 0 to 9.5x 10² cfu/100 mL (day 7) upon exposure to sunlight, however, there was continuous increase of bacteria count from day seven. Bacteria counts of water stored indoor increased throughout the study period. E. coliwas present in all water samples by day 21. There was a significant difference in nitrite concentration between the two storage conditions across study period. This study revealed that storage duration and exposure conditions affect the quality of sachet water for drinking. Quality improvement of sachet water through exposure to sunlight was most effective on third day of exposure, while the maximum time of effectiveness was one week, beyond which the quality deteriorates fast irrespective of the storage condition. Hence, prolonged water storage beyond one week before drinking is discouraged.
Keywords:
Water Quality, Sachet Water, Storage, Nitrite, E. coli1. Introduction
Good quality water is odourless, colourless, tasteless, and free from faecal pollution [1]. Drinking water or potable water is water that is considered safe enough to be consumed by humans or used with low risk of short term or long term harm. In most developing countries, the water supplied to households, commerce and industry do not meet drinking water standards.
In the past, the general practice in many developing countries including Nigeria was that a large proportion of people in the urban areas had access to piped water supply to the neglect of those in the rural areas; but now, the situation has changed. In Ibadan, Nigeria, the Water Corporation of Oyo State supplies 107 million litres of water per day for a
population of 3.6 million through the Eleyele and Asejire dams this quantity is adequate for only 20% of the population [2]. The outcome of this inadequacy is that most people in the city resort to water from other sources such as boreholes, wells, and water from several vendors without knowing the source.
Water related diseases continued to be one of the major health problems globally as water consumers are frequently unaware of the potential health risks associated with exposure to water-borne contaminants which have often led to diseases like diarrhoea, cholera, dysentery, typhoid fever, legionnaire’s disease and parasitic diseases [3].
factory-packaged sachet drinking water popularly called ‘Pure water’ has outnumbered bottled water because of its easy accessibility and affordability [5]. Although, potable and affordable, the problems of its purity and other health concerns have begun to manifest. The integrity of the hygienic environment and conditions where the majority of the water in sachets are produced has been questioned [6]. Apart from environmental contaminants, contamination from improper vendor handling also poses threats to the health of the ignorant consumers who often times drink without any proper cleaning of the sachets, sachet water have been reported to contain bacteria such as Bacillus sp., Pseudomonas sp., Klebsiella sp., Streptococcus sp., and oocysts of Cryptosporidia sp [4].
Method of preservation of a potable water impacts not only on its quality, but also its safety. [7] stated that the quality of sachet water is still questionable, because many who are engaged in its production do not follow strictly the standard set by National Agency for Food, Drug Administration and Control (NAFDAC), World Health Organisation (WHO) and Standard Organization of Nigeria (SON) for safe drinking water. [8] also explained that, sachet water as a product has specific temperature conditions under which it must be kept and failure to do so, can cause serious health problems. Poor preservation of water generally may lead to health problem, since water is one of the vehicles for transmission of pathogenic organisms [9].
In the city of Ibadan however, vendors are often seen storing and displaying sachet water in metal cages which are open to sunlight and on platforms directly in the sun with no roof or covering. Some vendors even cover directly with tarpaulin, which may protect it against rain but not the rays of sunlight. These bags of sachet water may be there for weeks until they are all sold. Sachet water factories typically have open vans (pickups) with which they transport their products to the wholesalers and retailers. Some other vendors buy bags of sachet water in their hundreds and store in shops until gradually sold which may take several weeks.
At the household level, lack of proximity to vendors and economic factors make it necessary to buy sachet water in large quantity and may be stored for a long period before consumption. Hence, this study was conducted to examine the effects of storage and exposure to sunlight on the quality of sachet water sold in Ibadan, Oyo State, Nigeria.
2. Materials and Methods
2.1. Study Design
This study adopted an experimental design to investigate the effect of storage conditions on sachet water sampled within Ibadan metropolis
2.2. Study Area
The study covers Ibadan metropolitan city, which is the largest indigenous city in Africa, is the capital of Oyo state. Ibadan lies at latitude 7˚ 23' N and Longitude 3˚ 56'E. It is
located at the transition zone between the forest and grassland areas of the country. The population of central Ibadan which is made of five Local Government Areas is 1,338,659 according to census result of 2006 covering an area of 128 Km2. Ibadan is the largest metropolitan geographical area accommodating over 3 million inhabitants.
2.3. Sample Collection
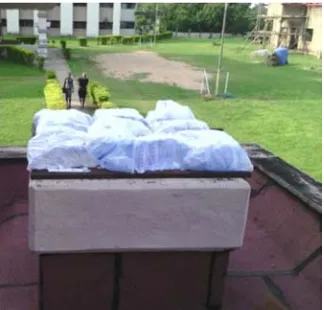
This study was carried out between August and September 2014 and a simple random sampling technique was used to select ten sachet water brands from the registered factories in Ibadan metropolis, Nigeria. Two hundred sachets of water from the ten brands [10] were purchased at the point of production directly from the factory and transported immediately to the laboratory where the samples were labelled and analysed for baseline physicochemical and bacteriological characteristics. Samples were taken from each of the ten brands for analysis in triplicates. The sachet water samples were dispensed according to recommended standards of [11]. The remaining water sachets were divided into exposed (Figure 1) and unexposed (Figure 2) experimental groups. The exposed group was stored outdoor where sunlight could reach it while the unexposed group was stored indoor at room temperature for a period of four weeks, during which physicochemical and bacteriological analyses were carried out on samples from the two groups at intervals.
Figure 1. Sunlight exposed samples.
2.4. Laboratory Analyses
Physico-chemical like pH, Temperature, Total dissolved solids (TDS), Dissolved oxygen, Turbidity, Alkalinity, Chloride, Calcium hardness Total hardness, and Magnesium Hardness of the sachet water were determined using standard methods described by [11]. Nitrite and nitrate were determined according to [12] and analysed with UV spectrophotometer at wave length of 550nm. Quality control was maintained by adequate washing and sterilization of containers and apparatus, appropriate labelling and sterile environment for microbial analysis. Bacteria were isolated under aseptic conditions using pour plate method. This was done by the preparation of McConkey differential agar according to manufacturer’s instruction; sterilization of agar; inoculation; microbial colony morphological preliminary identification and biochemical test for confirmation of bacterial strains. The biochemical tests carried out were motility, catalase, coagulase, oxidase, indole, urease, citrate, glucose, maltose, lactose, sucrose and mannitol.
2.5. Data Analysis
The data from the laboratory was properly recorded and entered into SPSS 20.0 data spread sheet. The data was analysed using SPSS 20.0. Descriptive statistics (mean and standard deviation) was used to summarize the data. Tables, bar chart and line graphs were used for data presentation. ANOVA (Analysis of variance) and t-test were used to compare mean values of the parameters at p <0.05.
3. Results and Discussion
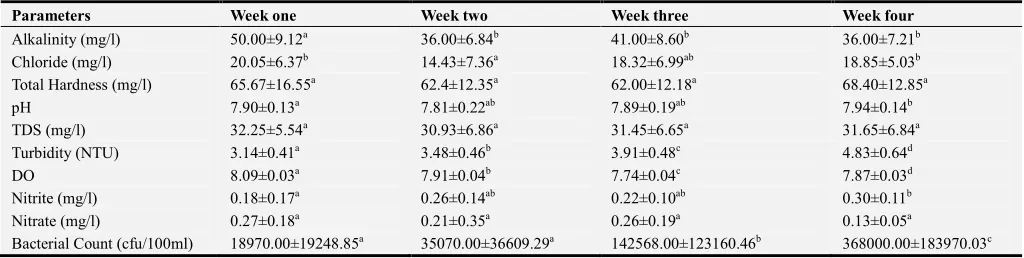
Table 1 shows the physicochemical and bacteriological characteristics of the Sachet water at intervals stored at room temperature (unexposed to sunlight) for four weeks. Alkalinity, chloride, total hardness, Total Dissolved Solids (TDS), turbidity, dissolved oxygen, nitrate, nitrite and bacterial counts for four weeks ranged from 36.00 to 50.00 (mg/l); 14.43 to 20.05 (mg/l); 62.00 to 68.4 (mg/l); 7.81 to 7.94; 30.93 to 32.25 (mg/l); 3.14 to 4.83 (NTU); 7.74 to 8.09; 0.18 to 0.30 (mg/l); 0.13 to 0.27(mg/l) and 18970.00 to 368000.00cfu/100ml respectively. Physicochemical and bacteriological examination of samples showed a variable level (p < 0.05) of pH, turbidity, chloride, nitrite and bacteria count with their highest values in week four which were all within permissible limits except nitrite, turbidity and bacteria counts. The highest pH observed at the end of the storage period corresponds with the findings of [13]. The high nitrite level in sachet water may predispose the consumers to methemoglobinaemia which has been linked to increased concentration of nitrite in drinking water especially in bottle-fed infants when such contaminated water is used for their formula [14, 15]
Bacteria count increased gradually from week one (1.9x10⁴cfu/100ml) to week four (3.7x10⁵cfu/100ml) in all the brands tested up to week four showing a growth pattern typical of microorganisms growing in closed system [16].
This is in accordance with the result of Sunday et al., 2011 who discovered a steady increase in bacteria counts of sachet water stored indoor for a period of eight weeks. Dissolved oxygen showed a gradual decrease from week one to week four which is similar with the findings of [17],who observed a general decrease in dissolved oxygen content of sachet water samples throughout his investigation period. However, no particular trend was observed in the values of alkalinity, total dissolved solids, total hardness and nitrate across the four weeks of storage.
Table 2 however, presents the physicochemical and bacteriological characteristics of the Sachet water at intervals exposed to sunlight for four weeks. Alkalinity, Chloride, Total Hardness, total dissolved solids (TDS), turbidity, dissolved oxygen, nitrate, nitrite and bacterial counts for four weeks ranged from 36.00 to 48.00 (mg/l); 15.24 to 19.85 (mg/l); 60.00 to 66.80 (mg/l); 7.55 to 8.27; 30.58 to 31.15 (mg/l); 2.89 to 5.07 (NTU); 7.69 to 8.10; 0.004 to 0.47 (mg/l); 0.069 to 0.38(mg/l) and 800.00 to 44470.93cfu/100ml respectively.
In the samples exposed to sunlight, there was no significant difference (p > 0.05) in the chloride, total Hardness and total dissolved solids concentration across the four weeks. pH alkalinity, turbidity, dissolved oxygen, nitrite, nitrate and bacterial count had significant differences (p < 0.05) in their values across the four weeks. The pH value increased gradually from week one (7.55±0.12) to week four (8.27±0.36), the findings are comparable to that of the study in Ghana [18] which reported that a slight increase was recorded in the pH values of the sachet water samples exposed to sunlight compared to those stored indoor throughout the study period. Turbidity values increased significantly across the weeks from week one (3.78±0.57) to week four (6.38±1.29). This contradicts the findings of [18].
According to [19], high levels of turbidity can make methods of disinfection less effective. The importance of level of turbidity in sachet water is to determine the effectiveness of the treatment process especially in terms of bacteria growth. With regard to this study on exposure of sachet water to sunlight, according to (USEPA, 2012) high level of turbidity reduces the amount of light penetrating the water which could make the solar disinfection process ineffective. The dissolved oxygen of the sachet water samples across the four weeks decreased form week one to week three and increased in week four. The decrease may be due to the oxygen demand of the microorganisms present and the increase in temperature caused by the increase in turbidity in the sachet water samples. Warm water generally has lesser dissolved oxygen than cold water [20].
(SODIS), the increase might be due to the increase in turbidity across the week which prevents penetration of
sunlight into the sachet water and the decrease observed in the levels of dissolved oxygen.
Table 1. Physicochemical and bacteriological properties of the sachet water stored indoor at intervals.
Parameters Week one Week two Week three Week four
Alkalinity (mg/l) 50.00±9.12a 36.00±6.84b 41.00±8.60b 36.00±7.21b
Chloride (mg/l) 20.05±6.37b 14.43±7.36a 18.32±6.99ab 18.85±5.03b
Total Hardness (mg/l) 65.67±16.55a 62.4±12.35a 62.00±12.18a 68.40±12.85a
pH 7.90±0.13a 7.81±0.22ab 7.89±0.19ab 7.94±0.14b
TDS (mg/l) 32.25±5.54a 30.93±6.86a 31.45±6.65a 31.65±6.84a
Turbidity (NTU) 3.14±0.41a 3.48±0.46b 3.91±0.48c 4.83±0.64d
DO 8.09±0.03a 7.91±0.04b 7.74±0.04c 7.87±0.03d
Nitrite (mg/l) 0.18±0.17a 0.26±0.14ab 0.22±0.10ab 0.30±0.11b
Nitrate (mg/l) 0.27±0.18a 0.21±0.35a 0.26±0.19a 0.13±0.05a
Bacterial Count (cfu/100ml) 18970.00±19248.85a 35070.00±36609.29a 142568.00±123160.46b 368000.00±183970.03c
Mean values with different lowercase letters show significant different at p<0.05 across the rows; TDS – Total dissolved solids; DO – Dissolved Oxygen
Table 2. Physicochemical and bacteriological properties of the sachet water at intervals exposed to sunlight.
Parameters Day three Week one Week two Week three Week four
Alkalinity (mg/l) 42.00±8.90ab 48.00±7.69b 36.00±8.16a 45.00±16.00b 36.20±8.72a
Chloride (mg/l) 18.79±6.17a 19.44±7.16a 15.24±6.85a 17.64±7.97a 19.85±5.78a
Total Hardness (mg/l) 60.00±10.83a 64.00±14.35a 61.60±12.38a 60.00±14.74a 66.80±12.03a
pH 7.55±0.12a 7.76±0.11a 8.16±0.49b 8.17±0.57b 8.27±0.36b
TDS (mg/l) 30.70±6.87a 30.96±6.73a 30.58±6.79a 31.15±6.75a 30.44±6.55a
Turbidity (NTU) 2.89±0.35a 3.78±0.57b 4.51±0.86c 5.07±0.84c 6.38±1.29d
DO 8.04±0.07ab 8.10±0.03a 8.00±0.11c 7.69±0.08d 7.82±0.15e
Nitrite (mg/l) 0.004±0.008a 0.40±1.64bc 0.38±0.14bc 0.31±0.20b 0.47±0.25d
Nitrate (mg/l) 0.069±0.077a 0.26±0.11c 0.38±0.19d 0.12±0.08ab 0.17±0.09b
Bacterial Count (cfu/100ml) 2200±4499.77ab 800.00±1924.35a 4020.00±4018.72ab 14935.47±21688.72b 44470.93±32968.22c
Mean values with different lowercase letters show significant difference at p<0.05 across the rows; TDS – Total dissolved solids; DO – Dissolved Oxygen
Table 3 shows the bacterial Isolate of sachet water samples at day three. Staphylococcus aureus was isolated from samples ES; Escherichia coli was isolated from samples CS, GS, IS and JS while no sample was contaminated with
Klebsiella pneumonia and Proteus vulgaris.
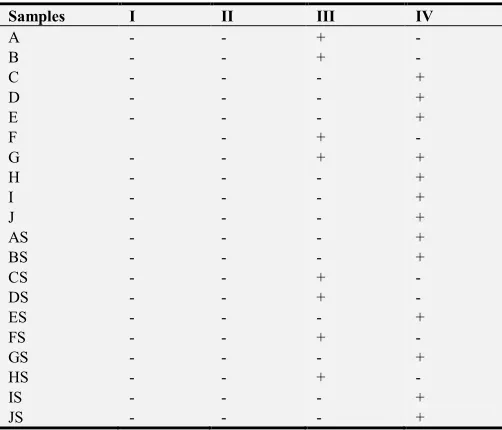
Bacterial isolate of sachet water samples at week one is shown in Table 4. Staphylococcus aureus was isolated from only one sample stored indoor; Escherichia coli was isolated from seven of the samples stored indoor and only two of the samples exposed to sunlight while no sample was contaminated with Klebsiella pneumonia, Proteus vulgaris
was isolated from three of the samples exposed to sunlight and only two of the samples stored indoor.
Table 5 presents the bacterial isolate of sachet water samples at week two. Escherichia coli was isolated from four of each of the samples stored indoor and exposed to sunlight.
Proteus vulgaris was isolated from six of the samples exposed to sunlight and seven of the samples stored indoor.
Staphylococcus aureus and Klebsiella pneumonia was not isolated from any of the samples in the two groups.
Table 6 shows the bacterial isolate of sachet water samples at week three. Staphylococcus aureus was isolated from three of the samples exposed to sunlight and only one from the samples stored indoor. Escherichia coli was isolated from eight and seven of the samples stored indoor and outdoor respectively. Proteus vulgaris was isolated from three of the samples exposed to sunlight and none from the samples
stored indoor. Klebsiella pneumonia was not isolated from any of the samples.
Bacteria isolate of sachet water samples at week four is presented in Table 7. Klebsiella pneumonia was isolated from four of the samples exposed to sunlight while none was isolated from samples stored indoor. Six of each of the samples from the two conditions had Escherichia coli.
Proteus vulgaris was not isolated from samples exposed to sunlight but was isolated from five of samples stored indoor. None and two of the samples exposed to sunlight and those stored indoor respectively had Staphylococcus aureus.
Among the four bacteria isolated in this study, E. coli and
Klebsiella pneumoniae were the most and least isolated respectively across the study periods and the two storage conditions. E. coli being mostly isolated suggests that most sachet do not undergo appropriate sterilization techniques and also do not conform to either NAFDAC or WHO standards for potable water as supported by the work of [21], who found out that some microorganisms were associated with drinking water. According to [22], the presence of E.coli
Table 3. Bacterial Isolate of sachet water samples at third day.
Samples I II III IV
AS - - - -
BS - - - -
CS - - + -
DS - - - -
ES + - - -
FS - - - -
GS - - + -
HS - - - -
IS - - + -
JS - - + -
I: S. aureus; II: K. pneumonia; III: E.coli; IV: P.vulgaris +: Isolated; -:Not isolated
Table 4. Bacterial Isolate of sachet water samples at Week one.
Samples I II III IV
A - - - +
B - - + -
C - - + -
D - - + -
E - - + -
F + - - -
G - - - +
H - - + -
I - - + -
J - - + -
AS - - - -
BS - - - -
CS - - + -
DS - - - -
ES - - + -
FS - - - -
GS - - - +
HS - - - -
IS - - - +
JS - - - +
I: S. aureus; II: K. pneumonia; III: E.coli; IV: P.vulgaris +: Isolated; -:Not isolated A-J: Unexposed samples; AS-JS: Exposed samples
Table 5. Bacterial Isolate of sachet water samples at Week two.
Samples I II III IV
A - - + -
B - - + -
C - - - +
D - - - +
E - - - +
F - + -
G - - + +
H - - - +
I - - - +
J - - - +
AS - - - +
BS - - - +
CS - - + -
DS - - + -
ES - - - +
FS - - + -
GS - - - +
HS - - + -
IS - - - +
JS - - - +
I: S. aureus; II: K. pneumonia; III: E. coli; IV: P.vulgaris +: Isolated; -:Not isolated
A-J: Unexposed samples; AS-JS: Exposed samples
Table 6. Bacterial Isolate of sachet water samples at Week three.
Samples I II III IV
A - - + -
B - - + -
C - - + -
D - - + -
E - - + -
F - + -
G - - + -
H - - + -
I - - + -
J + - - -
AS - - + +
BS - - + +
CS + - - -
DS - - + -
ES + - - -
FS + - - -
GS - - + -
HS - - + -
IS - - + +
JS - - + -
I: S. aureus; II: K. pneumonia; III: E.coli; IV: P.vulgaris; +: Isolated; -:Not isolated; A-J: Unexposed samples; AS-JS: Exposed samples
Table 7. Bacterial Isolate of sachet water samples at Week four.
Samples I II III IV
A - - + -
B - - - +
C - - + -
D + - - -
E - - - +
F - - + -
G + - - -
H - - + +
I - - + +
J - - + +
AS - + - -
BS - - + -
CS - - + -
DS - + - -
ES - + - -
FS - - + -
GS - - + -
HS - - + -
IS - + - -
JS - - + -
I: S. aureus; II: K. pneumonia; III: E.coli; IV: P.vulgaris +: Isolated; -:Not isolated
A-J: Unexposed samples; AS-JS: Exposed samples
32.25±5.54 mg/l; 3.78±0.57, 3.14±0.41 NTU; 8.10±0.03, 8.09±0.03; 0.40±1.64, 0.18±0.17 mg/l and 0.26±0.11, 0.27±0.18 mg/l respectively.
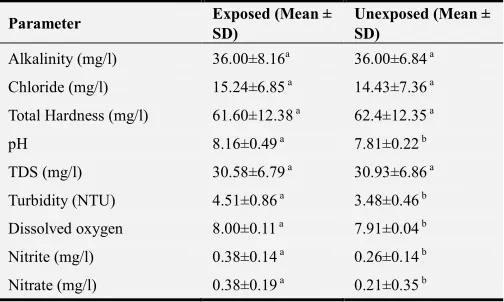
Table 9 shows the comparison of physicochemical parameters between the two storage conditions at week two. The alkalinity; chloride; total hardness; pH; total dissolved solid; turbidity; dissolved oxygen; nitrite and nitrate for both exposed and unexposed conditions were, 36.00±8.16, 36.00±6.84mg/l; 15.24±6.85, 14.43±7.36mg/l; 61.60±12.38, 62.4±12.35 mg/l; 8.16±0.49, 7.81±0.22; 30.58±6.79, 30.93±6.86 mg/l; 4.51±0.86 ±3.48±0.46NTU; 8.00±0.11, 7.91±0.04; 0.38±0.14, 0.26±0.14 mg/l and 0.38±0.19, 0.21±0.35 mg/l respectively.
Table 10 shows the comparison of physicochemical parameters between the two storage conditions at week three. The alkalinity; chloride; total hardness; pH; total dissolved solid; turbidity; dissolved oxygen; nitrite and nitrate for both exposed and unexposed conditions were, 45.00±16.00, 41.00±8.60mg/l; 17.64±7.97, 18.32±6.99mg/l; 60.00±14.74, 62.00±12.18 mg/l; 8.17±0.57, 7.89±0.19; 31.15±6.75, 31.45±6.65 mg/l; 5.07±0.84±5.07±0.84 NTU; 7.69±0.08, 7.74±0.04; 0.31±0.20, 0.22±0.10 mg/l and 0.12±0.08, 0.26±0.19 mg/l respectively.
Table 11 shows the comparison of physicochemical parameters between the two storage conditions at week four. The alkalinity; chloride; total hardness; pH; total dissolved solid; turbidity; dissolved oxygen; nitrite and nitrate for both exposed and unexposed conditions were, 36.20±8.72, 36.00±7.21mg/l; 19.85±5.78, 18.85±5.03mg/l; 66.80±12.03, 68.40±12.85 mg/l; 8.27±0.36, 7.94±0.14; 30.44±6.55, 31.65±6.84 mg/l; 6.38±1.29 ±4.83±0.64 NTU; 7.82±0.15, 7.87±0.03; 0.47±0.25, 0.30±0.11mg/l and 0.17±0.09, 0.13±0.05 mg/l respectively.
There was a significantly difference (p < 0.05) in the values of pH, turbidity and nitrite for the samples exposed to sunlight and stored indoor at week one. The mean pH value of the samples stored indoor was higher than those exposed to sunlight while higher turbidity and nitrite values were recorded in samples exposed to sunlight. The values for pH and turbidity were still within the guideline limit of WHO and NAFDAC for both storage conditions while nitrite concentration exceeded the NAFDAC guideline limit for the samples exposed to sunlight.
At week two and three, the difference observed in the values of pH, turbidity, dissolved oxygen, nitrite and nitrate were all statistically significant (p < 0.05) in the two storage conditions. It was observed that the higher value for each of the parameters was recorded in the samples exposed to sunlight. The higher pH values in the exposed group is in accordance with the work of [18] who reported a slight increase in pH of samples stored outdoor than those stored at room temperature. Nitrite concentration was higher than NAFDAC guideline limits in both storage conditions while turbidity values was higher than both WHO and NAFDAC guideline limits in the group exposed to sunlight (5.07±0.84) in week three only.
Values of nitrate, nitrite, pH and turbidity at week four
were higher in the exposed group than the unexposed group (p < 0.05). Turbidity (6.38±1.29) and nitrite (0.47±0.25, 0.30±0.11) exceeded the NAFDAC (5.0 NTU and 0.2 mg/L) respectively for the samples exposed to sunlight. The study revealed that most of the parameters in the exposed group were higher than the unexposed group, irrespective of the period of storage.
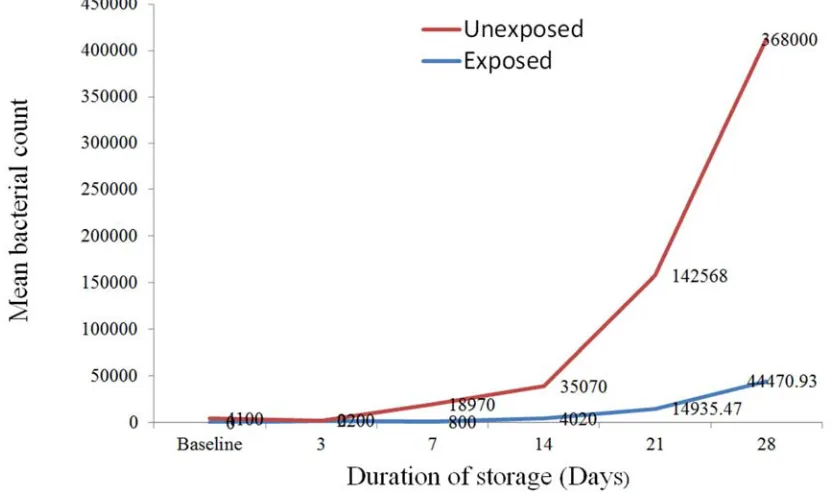
Figure 3 shows the trend in the variation of bacteria count in the two storage conditions across the duration of storage. The samples exposed to sunlight generally had lower bacteria counts than the samples stored indoor. In the samples stored indoor, there was a gradual increase in the bacteria count from day one (baseline) (4.1x10³cfu/100mL) through day twenty eight (3.7x10⁵cfu/100mL). This corresponds to the findings of [24, 25]. However in the samples exposed to sunlight, a decline in the bacteria count from day one (4.1x10³ cfu/100mL) through day three (2.2x10³ cfu/100mL) to day seven (8.0x10² cfu/100mL) was observed. However from day seven there was a rapid increase in bacteria count up till day 28, an evidence of bacteria regrowth which can be corroborated by the findings of [26] who stated that if water was kept in an enclosed state for a prolonged period, growth of anaerobic microbes could be enhanced, making the water unsafe and unfit for potable use.
Table 8. Comparison of physicochemical parameters of sachet water between the two storage conditions at week one.
Parameter Exposed
(Mean ± SD)
Unexposed (Mean ± SD)
Alkalinity (mg/l) 48.00±7.69 a 50.00±9.12a
Chloride (mg/l) 19.44±7.16 a 20.05±6.37 a
Total Hardness (mg/l) 64.00±14.35 a 65.67±16.55 a
pH 7.76±0.11 a 7.90±0.13 b
Total Dissolved solid (mg/l) 30.96±6.73 a 32.25±5.54 a
Turbidity (NTU) 3.78±0.57 a 3.14±0.41 b
Dissolved oxygen 8.10±0.03 a 8.09±0.03 a
Nitrite (mg/l) 0.40±1.64 a 0.18±0.17 b
Nitrate (mg/l) 0.26±0.11 a 0.27±0.18 a
Mean values with different lowercase letters show significant difference at p < 0.05 across the rows
Table 9. Comparison of physicochemical parameters between the two storage conditions at week two.
Parameter Exposed (Mean ± SD)
Unexposed (Mean ± SD)
Alkalinity (mg/l) 36.00±8.16a 36.00±6.84 a
Chloride (mg/l) 15.24±6.85 a 14.43±7.36 a
Total Hardness (mg/l) 61.60±12.38 a 62.4±12.35 a
pH 8.16±0.49 a 7.81±0.22 b
TDS (mg/l) 30.58±6.79 a 30.93±6.86 a
Turbidity (NTU) 4.51±0.86 a 3.48±0.46 b
Dissolved oxygen 8.00±0.11 a 7.91±0.04 b
Nitrite (mg/l) 0.38±0.14 a 0.26±0.14 b
Nitrate (mg/l) 0.38±0.19 a 0.21±0.35 b
Table 10. Comparison of physicochemical parameters between the two storage conditions at week three.
Parameter Exposed (Mean ± SD) Unexposed (Mean ± SD)
Alkalinity (mg/l) 45.00±16.00a 41.00±8.60 a
Chloride (mg/l) 17.64±7.97 a 18.32±6.99 a
Total Hardness (mg/l) 60.00±14.74 a 62.00±12.18 a
pH 8.17±0.57 a 7.89±0.19 b
TDS (mg/l) 31.15±6.75 a 31.45±6.65 a
Turbidity (NTU) 5.07±0.84 a 3.91±0.48 b
Dissolved oxygen 7.69±0.08 a 7.74±0.04 b
Nitrite (mg/l) 0.31±0.20 a 0.22±0.10 b
Nitrate (mg/l) 0.12±0.08 a 0.26±0.19 b
Bacterial Count 14935.47±21688.72 a 142568.00±123160.46 b
Mean values with different lowercase letters show significant difference at p<0.05 across the rows
Table 11. Comparison of physicochemical parameters between the two storage conditions at week four.
Parameter Exposed (Mean ± SD)
Unexposed (Mean ± SD)
Alkalinity (mg/l) 36.20±8.72a 36.00±7.21 a
Chloride (mg/l) 19.85±5.78 a 18.85±5.03 a
Total Hardness (mg/l) 66.80±12.03 a 68.40±12.85 a
pH 8.27±0.36 a 7.94±0.14 b
TDS (mg/l) 30.44±6.55 a 31.65±6.84 a
Turbidity (NTU) 6.38±1.29 a 4.83±0.64 b
Dissolved oxygen 7.82±0.15 a 7.87±0.03 a
Nitrite (mg/l) 0.47±0.25 a 0.30±0.11 b
Nitrate (mg/l) 0.17±0.09 a 0.13±0.05 b
Mean values with different lowercase letters show significant difference at p<0.05 across the rows
Figure 3. Variation in bacteria count with duration of storage in samples stored indoor and exposed to sunlight.
4. Conclusion and Recommendation
This study revealed that storage duration and exposure conditions affect the quality of sachet water for drinking. Quality improvement of sachet water through exposure to sunlight was most effective on third day of exposure, while the maximum time of effectiveness was one week, beyond which the quality declined fast, irrespective of the storage condition.
Hence, prolonged water storage beyond one week before drinking is discouraged.
References
[1] Ezeugwunne I. P., Agbakoba N. R., Nnamah N. K., Anhalu I. C. (2009). The prevalence Bacteria in Packaged Sachet Water Sold in Nnewi, South East, Nigeria. World Journal of Dairy and Food Science. 4 (10):19-21.
[2] Itama E., Olaseha I. O., Sridhar M. K. C. (2006). Springs as supplementary potable water supplies for inner city populations: A Study from Ibadan. Urban Water J. 3(4):215-223.
[3] Oladipo I. C., Onyenika I. C., Adebiyi A. O. (2009) Microbial analysis of some vended sachet water in Ogbomoso, Nigeria. African Journal of Food Science. 3(12):406–412.
[4] Omalu C. J., Eze G. C., Olayemi I. K., Gbesi S., Adeniran L. A., Ayanwale A. V., Mohammed, A. Z., Chukwuemeka V. (2010). “Contamination of Sachet Water in Nigeria: Assessment and Health Impact,” The Online Journal of Health and Allied Sciences. 9 4:15.
[5] Stoler, J., J. R. Weeks and G. Fink, 2012. Sachet drinking water in Ghana's Accra-Tema metropolitan area: Past, present and future. J. Water Sanitation Hygiene Dev.: J. Int. Water Assoc., 2: 223-240.
[7] Okpako E. C., Osuagwu A. N., Duke A. E., Ntui V. O. (2008). Prevalence and Significance Of Fungi in Sachet and Borehole Drinking Water in Calabar Nigeria. African Journal of
Microbiology Research. 3(2) online
http://www.academicjournals.org/ajm
[8] Bennie J. (2007). Food and Drug Board raises alarm over sachet water handling: Ghanaian Chronicle online. Assessed
on the 24th of July 2010 from
http://news2/285956/1/modernghana.com/food-and-drugs-board-raisesalarmover- handling-of-,html
[9] Ejima S. O. (2005). Environment and Health Hazards. Implication on students in colleges of education in Ankpa, Kogi State. Teacher Education Journal. 13 (2) 86-91.
[10] Akinde S. B., Nwachukwu M. I., Adindu S, Ogamba A. S. (2011). Storage Effects on the Quality of Sachet Water Produced within Port Harcourt Metropolis, Nigeria. Jordan Journal of Biological Sciences. 4 3: 157–164.
[11] APHA (1998). Standard Methods for the Examination of Water and Wastewater. 20th Edition, American Public Health Association, American Water Works Association, Water Environment Federation. United Book Press, Inc., USA.
[12] Montgomery H. A. C., Dymock J. E. (1961). The determination of nitrite in water. Analyst. 86, 414-416.
[13] Jimoh O. T., Ndamitso M. M., Idris S., Likita M. B., Ajai A. I., Bala A. A. (2013). Physico-chemical and Escherichia coli assessment of selected sachet water produced in some areas of Minna, Niger State, Nigeria. International Journal of Water Resources and Environmental Engineering. 5(3):134-140
[14] World Health Organisation, 2011. Nitrate and nitrite in drinking-water. WHO/SDE/WSH/07.01/16/Rev/1NRDC, (2003). Common tap water contaminants: Health effects, treatment and recommendations. In: What’s on tap? Grading drinking water in U.S.
[15] Aroh K. N., Eze E. M., Ukaji D., Wachuku C. K, Gobo A. E., Abbe S. D., Teme S. C. and Igoni A. H., 2013. Health and environmental components of sachet water consumption and trade in Aba and Port Harcourt, Nigeria. Journal of Chemical Engineering and Materials Science. 4(2):13-22,
[16] Sunday B. A., Michael I. N., Adindu S. O. (2011). Storage
Effects on the Quality of Sachet water Produced within Port Harcourt Metropolis, Nigeria. Jordan Journal of Biological Sciences. 4(3):157-164.
[17] Abudu B. D., Samuel J. C., Mark O. K. (2013). Effect of storage on the quality of sachet-vended water in the tamale metropolis. Ghana journal of environmental protection. 4: 629-637. http://dx.doi.org/10.4236/jep.2013.46072 http://www.scirp.org/journal/jep
[18] World Health Organisation, (2008). Guidelines for Drinking-Water Quality: Incorporating 1st and 2nd Addenda, 3rd Edition, Vol. 1, Recommendations.
[19] USEPA, (2012). Water: monitoring and assessment. Office of water, United States environmental protection agency, Washington DC.
http://water.epa.gov/type/rsl/monitoring/vms5s.cfm
[20] Cruickshank R. (1968). Medical Microbiology, a guide to the Laboratory Diagnosis and control of Infection.E and S Living Stone Ltd. London, England.; 963-978.
[21] Onojah P. K., Odin E. M., Ochala A. U. (2013). Physicochemical studies and bacteriological assay of Sachet Water samples marketed in Kogi state University Compound, Anyigba. International Journal of Analytical and Bioanalytical Chemistry. 3 4: 146-150
[22] Guilot E., Lecters H. (1993). Biological Specificity of Bottled Mineral Water. Journal of Applied Bacteriology. 74: 345-352.
[23] Mberekpe P., Eze N. (2014). Effects of Preservation on the Quality of Sachet Water Consumed by Households in Nsukka Zone. The International Institute for Science, Technology and Education. 6: 7.
[24] Addo, M. G., Woods, C. A., Andoh L. A., and Obiri-Danso, K. 2016. Effect of Varying Storage Temperatures on the Microbiological Quality of Street Sold Water in the Kumasi Metropolis, Ghana. Research Journal of Microbiology, 11: 56-63.