Optical Flow Visualization Using the Modular Background-Oriented
Full-Scale Schlieren Technique
Chung-Hwei Su
1, Chien-Chih Chen
2, Yu-Cheng Hung
3, and Chen-Ching Ting
4, *1Department of Safety, Health and Environmental Engineering, National Kaohsiung First University of
Science and Technology, Taiwan.
2
Graduate Institute of Mechanical and Electrical Engineering, National Taipei University of Technology, Taiwan.
3Graduate Institute of Manufacturing Technology, National Taipei University of Technology, Taiwan.
4Dept. of Mechanical Engineering, National Taipei University of Technology, Taiwan.
Received 12 March 2014; received in revised form 08 April 2014; accepted 22 April 2014
Abstract
Background-oriented full-scale schlieren (BOFSS) with large test sections is a famous technique, specially developed for optical flow visualization. This article presents the technique using a modular background-oriented
light source instead of the retroreflective method. The modular background- oriented light source is convenient to enlarge the area of the light source and providing a larger testing section, thus the test sections become flexible. Moreover, the article also focuses on investigating the BOFSS sensitivity with different percentages of cutoff grid.
The setting composed of fluorescent lamp Philips-865, atomizing films, and linear grating mask. The linear grating mask is alternated with black lines with width of 6 mm. The area of light source and test section are 2 × 2 and 1 × 1 m2,
respectively. The present study applies different percentages of cutoff grid to block light source, and 50, 60, 70, 80, and 90% percentages of cutoff grid are been tested. The test subjects are heat flux from burning candles and Bunsen
burner, acetone gas flow, LPG flow and compressed butane gas. The results show that a cutoff grid with 90% of light blockage presented the best result for conventional Z-arrangement schlieren technique. Whereas, cutoff 60 percent
light shows the best results for full-scale schilieren technique.
Keywords: full-scale schlieren, background-oriented light source, cutoff grid, atomizing film, grating mask
1.
Introduction
Schlieren technique is a well-known and simple optical method for flow visualization in the scientific and engineering
disciplines. The technique is mainly used to capture two-dimensional heat flow distribution allowing the human eye to perceive the phenomena [1–3]. A typical schlieren technique uses a pair of concave mirrors or convex lenses to build parallel light, the
setting provides high sensitivity and is able to avoid three-dimensional effect; however, its test section area is seriously limited by the dimension of the mirrors and lenses. Despite this fact, the schlieren technique is very useful in fluid engineering for qualitative flow characterization. For example, in 1993, Weinstein first used linear light bar as light source to replace expensive
parabolic mirrors [4]. Schweiger in 1983 used schlieren technique to measure the vortex shedding frequency [5].
Moreover, Morris et al., in 1989, used the schlieren technique for valve disk flow field visualization, the result showing that different disks and angles show different flow field properties [6]. Bakhtar et al., in 1993, studied the problems associated
with nucleating flow and turbines under wet steam using a shadowgraph technique showing superheated and nucleating flows [7]. Raud et al., in 1999, observed a low density jet subjected to time varying cross flow with high acceleration and deceleration
levels using the schlieren technique to record the flows [8]. Li et al., in 2003, studied transonic and low supersonic flow losses of two nozzle blades for steam turbines by using the schlieren technique to record the flows [9]. Chandra et al., in 2005, studied
acoustic oscillations induced by supersonic flow at a Mach number of 1.5 in a rectangular duct with variable dimensions using the schlieren technique to show the shock structure at the unstable shear layer along the length of the cavity [10]. Ting et al., in
2013, investigated the influence of the color mask made by an LCD projector for the color schlieren technique. The results showed that the best color mask was one with outside diameter ca. 10 mm and inside diameter ca. 8 mm that had the highest
sensitivity for color schlieren imaging [11]. In the same year, Ting et al. employed the color schlieren method to observe gas leakage trough micro-holes with diameter of 1130, 176, 75, 45.16, 35.32, and 27.5 µm which were made by using the electric-discharge-machining technique. The result shows that the better fuel gas flow visualization image is φ 35.32 µm with 1 torr pressure difference of and φ 27.5 µm with 5 torr pressure difference [12].
Full-scale schlieren technique (FSS) with large test section is a well-known method in flow visualization fields.
Neglecting the three-dimensional effect, FSS technique is suitable for flow visualization, such as, observing heat, ventilation, air conditioning. This technique can easily shows the heat flux distribution with a grand test size. In 1997, Settles et al. first
presented a simple but large schlieren optical system to visualize ventilation airflows from commercial kitchen griddle and exhaust hood, daily rooms, etc. [13]. Settles et al. uses retroreflective light path integrated with white reflective screen, made by
highway-sign material. The projecting light built a shadowgraph image on the retroreflective screen. Finally, the reflected light from the screen was focused on the camera by a convex lens.
In 2001, Settles et al. presented outdoor schlieren and shadowgraph flow visualization methods for outdoor thermal convection, explosion from jet aircraft, and high-speed flight. In 2004, Settles et al. further presented a huge schlieren optical
system, named as full-scale schlieren (FSS) with a huge test area about 2.3 × 2.9 m2. The one most key element of the FSS system is the front illuminated source grid. The source grid assembled on a frame and consists of 12 pieces of aluminum sign
panels, the each panel dimension are 1.2 m × 2.4 m × 2.5 mm and presenting a 5.08 mm wide vertical black grid line spaced 5.08 mm apart. This arrangement can show images of heating and ventilation airflows, thermal plumes of human, aerodynamics of explosion, gas leak, shock wave, and discharge process of firearms [14].
In general, FSS techniques can be divided into two types, one is retroreflective type and the other one is background-oriented type. The retroreflective FSS uses light projector penetrating light through the test section onto a
retroreflective screen. The screen first shows a shadowgraph image and the reflected light focused on camera by convex lenes. The most commonly presented data are captured by using this technique. Background-oriented full-scale schlieren rarely being
presented in studies. The two techniques use the same source grid in front of the light source and uses a cutoff grid on the focal point of a convex lens as a knife edge. In 2005, Settles et al. also presented some interesting FSS images, such as 1 gram of
triacetone triperoxide explosion process and AK-47 submachine gun shot process on shadowgraph [15]. The shadowgraph was projected on 2.4 m square retroreflective screen. The technique sensitivity is depending on the ratio of the distance between the
In addition, the natural-background-oriented full-scale schlieren (NBOFSS) technique, using the natural background as
light source integrating with particle image velocimetry (PIV) technique for quantitative measurements of flow velocity is also developed previously, which is similar to present study. Klinge et al., in 2003, presented some results for wing tip vortex in
transonic wind tunnel [17] by using the NBOFSS technique. Sommersel et al., in 2008, and Biss et al., in 2009, also used the NBOFSS technique to illustrate some explosion objects [18, 19]. Settles et al., in 2010, used the NBOFSS technique with high
speed camera to show muzzle blast and supersonic bullet as well as to integrate with PIV technique for determining a finite pixel shift [20].
In 2010, Settles et al. presented many new flow visualization methods, such as background distortion schlieren for flow visualization of gas evaporation, car engine emission, and shock waves [21]. Moreover, Amercian Society for Testing and
Materials (ASTM), a famous association, uses schlieren and shadowgraph techniques to illustrate the performance of commercial kitchen ventilation system. Brief introduction above emphasize the importance of FSS for flow visualization.
Present study aims to develop models for a BOFSS technique enlarging the area of the light source and providing a larger testing section.
2.
Basic Theory
Schlieren technique is often used to obtain two dimensional refraction index gradient distribution within a transparent
object. Based on the relationship between light intensity (I) and object density (ρ) as shown in Eq. (1), schlieren technique not only can visualize transparent flow, but also can show the object’s density distribution quantitatively [3, 22].
(1)
Applying basic theory of schlieren, that is setting the light to have the shortest optical path, described in Fermats principle in 1657 [2] further being illustrated in Gladstone and Dale’s experimental data as Eq. (2).
(2)
where n stands for index of refraction and ρ is the density of the object [2]. Using Weinstein’s contribution model from Settles in 2011 [14] to determine the sensitivity (εmin) of the full-scale schlieren is as shown below (see figure 1).
(3)
where k is number of line-pairs per mm and ∆E/E = 0.1 for a 10% detection threshold. Figure 1 is schematics of the focusing
system. Equation (3) can therefore rewritten as follows:
(4)
where 1 radian=206265 arcseconds.
min
2
'(
)
E
L
k E L L l
Fig. 1 Schematics of the focusing schlieren system
3.
Experimental Setup
A typical schlieren technique uses white light source and the test section area is limited by the parabolic mirrors size,
used for generating parallel light. Figure 2 shows a Z-arrangement of a typical schlieren setup. Present study also built a conventional Z-arrangement schlieren, using 5 W LED lamp as light source as comparison to FSS.
Fig. 2 Schematic setup of the typical schlieren technique
Present study aimed to develop a modular background-oriented full-scaled schlieren technique (MBOFSS) substituting
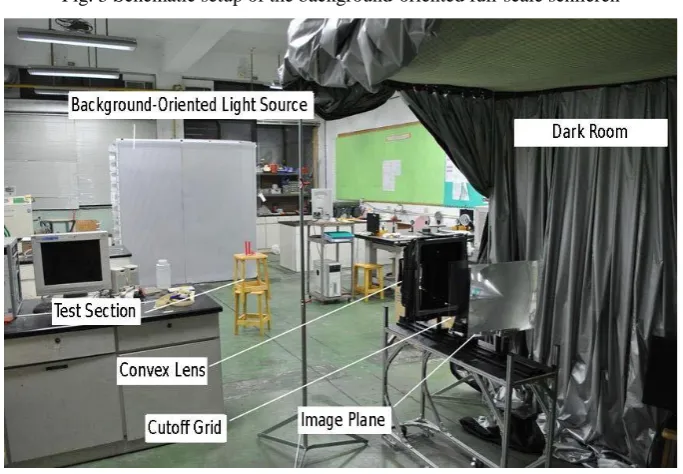
the retroreflective method [16]. Current arrangement composed of modular background-oriented light source and the dark room is the setting. The test section is located at the center between the source grid and the convex lens, so that the light runs through the test section and focused on the camera through a convex lens. Figure 3 shows schematic setup of the MBOFSS and figure 4
Fig. 3 Schematic setup of the background-oriented full-scale schlieren
Fig. 4 Photograph showing the actual setting of the background-oriented full-scale schlieren
3.1. Background-oriented light source
Background-oriented light source composed of modular array light, atomizing film, and source grid. Current setting uses Philips-856 fluorescent lamp as light source and the source grid is setting to be 6 mm wide and lines are 6 mm apart printed on
a transparent film. The area of the light source is 2 × 2 m2. Figure 5 shows schematic constituent arrangement of the background-oriented light source. The atomizing film was made by plastic material for fuzzy image and stopping image. The
atomizing film and the grating source grid are fixed on the acrylic plate and plate is fixed on aluminum structure integrated with the modular array light.
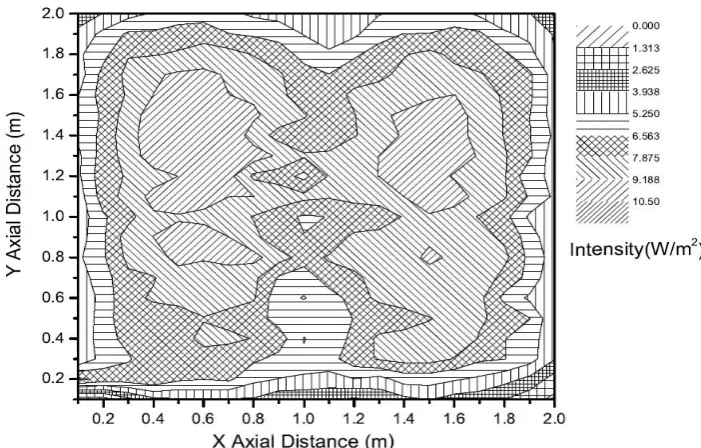
Figure 6 shows the light intensity distribution of the background-oriented light source. The camera is sensitive when the light intensity is larger than 0.4 W/m2. This means, the background-oriented light source in terms of the light intensity distribution in figure 6 is suitable to use in this study.
Fig. 6 Light intensity distribution of the background-oriented light source
3.2. Dark room
The dark room is built for capturing image. The setting composed of a set of convex lenses, the cutoff grid, the image screen and a CCD camera. The Diameter and the focus of the convex lens are φ=10 cm and f=501 mm respectively. Present
study applied different percentages of light blockage as comparison using the cutoff grids, the percentages tested are blockage
of 50, 60, 70, 80, and 90 percent of light source. For instance, the cutoff grid with a width of 0.931 mm at an interval of 0.254 mm deriving images on the transparent film is called ca. 60% cutoff. Figure 7 is a photo of the dark room setting.
Fig. 7 Photo of the dark room setting
4.
Results and Discussion
Present experimental design focuses on results and discussion on visualizing heat flux, gas flow of different molecular
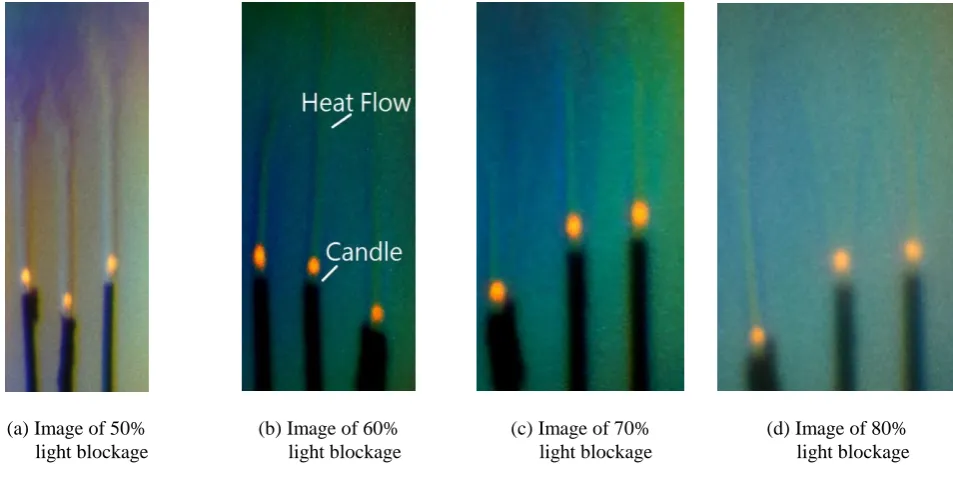
weight, and compressed gas jets. Each condition is being tested in different percentages of light blockage. Figure 8 shows visualizing heat flux from a burning candle by using the conventional Z-arrangement schlieren technique. Figures 8(a)-(e) are
cutoff edge presented the best image contrast of heat flux. In other words, heat flux is being observed the best when 90% of light
is being blocked. Figure 9 shows the histogram chart of different light blockages from figures 8(a)-(e).
(a) Image of 50% light blockage (b) Image of 60% light blockage (c) Image of 70% light blockage
(d) Image of 80% light blockage (e) Image of 90% light blockage
Fig. 8 Visualization photos of heat flux with burning candle in different percentages of light blockage using the conventional Z-arrangement schlieren
Fig. 9 Histogram chart of burning candle in different percentages of light blockage using the conventional Z-arrangement schlieren
Figure 10 shows the visualization of heat flux from a burning candle using modular background-oriented full-scale schlieren. Figures 10(a)-(d) are images presenting from different cutoff grid percentages with 50, 60, 70, and 80%, respectively.
8 and figure 10, figure 10 presented a darker outcome. This is because a modular background-oriented full-scale schlieren uses diffuse light source, whereas the conventional Z-arrangement schlieren uses parallel light source.
Therefore, the focused light on cutoff edge for the conventional Z-arrangement schlieren is brighter. In other words, the percentage of light blockage in the modular background-oriented full-scale schlieren should be smaller for recording the same
brightness of image. The results show that the best image contrast of heat flux in this test is when applying 60% cutoff grid in figure 10(b).
(a) Image of 50% light blockage
(b) Image of 60% light blockage
(c) Image of 70% light blockage
(d) Image of 80% light blockage
Fig. 10 Visualization photos of heat flux with burning candle in different percentages of cutoff grid using the modular background-oriented full-scale schlieren
Figure 11 shows the visualization of heat flux from a Bunsen burner using modular background-oriented full-scale schlieren. Figures 11(a)-(d) are image presenting different percentages of cutoff grid respectively. Figure 11(b) shows a better
sensitivity than the others. The result is being captured with an atomizing film being inserted in front of the image screen to minimize fringe disturbance.
(a) Image of 50% light blockage
(b) Image of 60% light blockage
(c) Image of 70% light blockage
Fig. 11 Visualization photos of heat flux with burning Bunsen burner in different percentages of cutoff grid using the modular background-oriented full-scale schlieren
Figure 12 shows photos of visualizing acetone gas between different molecular weight using the modular
background-oriented full-scale schlieren, where figures 12(a)-(d) are images presented in different cutoff grids setting and atomizing film also being placed in front of the image screen for fringe reduction. Figure 12 clearly shows the acetone gas
downward flowing out of the bottle as its molecular weight is larger than ambient.
(a) Image of 50% light blockage
(b) Image of 60% light blockage
(c) Image of 70% light blockage
(d) Image of 80% light blockage
Fig. 12 Visualization photos of acetone gas flow between different molecular weight in different percentages of cutoff grid using the modular background-oriented full-scale schlieren
Figure 13 shows photos of visualizing compressed LPG being ejected into air using modular background-oriented full-scale schlieren. Figures 13(a)-13(d) are images from different cutoff grids. Figure 13(b) presented the best image contract
within the group.
(c) Image of 70% light blockage (d) Image of 80% light blockage
Fig. 13 Visualization photos of compressed LPG flow ejected into air in different percentages of cutoff grid using the modular background-oriented full-scale schlieren
Figure 14 shows another visualization of compressed butane gas being ejected into air using modular background-oriented full-scale schlieren. Figures 14(a)-(d) are showing images from different light blockages. An atomizing film is being placed in front of the screen.
(a) Image of 50% light blockage
(b) Image of 60% light blockage
(c) Image of 70% light blockage
(d) Image of 80% light blockage
Fig. 14 Visualization photos of compressed LPG flow ejected into air in different percentages of cutoff grid using the modular background-oriented full-scale schlieren
Summarizing all the results, applying 90% cutoff edge in conventional Z-arrangement schlieren and 60% cutoff grid for
modular background-oriented full-scale schlieren presented the best image contrast. The figure 8 shows clear result quality than BOFSS result photos. Due to an atomizing film as image plane is be used of BOFSS and conventional Z-arrangement schlieren without.
5.
Conclusions
Present study uses experimental setting to present images from modular background-oriented full-scale schlieren. The technique is being applied to derive images from heat flux, gas flow among different molecular weight, and compressed gas jet.
different temperatures. Present study also successfully visualizes the interaction between acetone gas and air, presenting images
of different molecular weight having different density distribution. The results show that by applying 90% cutoff edge to conventional Z-arrangement and 60 percent of cutoff grid to modular background-oriented full-scale schlieren presented the
best visualization in this study. In conclusion, modular background-oriented full-scale schlieren provides another way to visualize intangible flows with bigger test section but cheaper which could become a valuable measuring technique in fluid
engineering field.
Acknowledgement
The author would like to acknowledge the financial support from the National Science Foundation of Taiwan under Grant
No. NSC101-2221-E-027-036.
References
[1] Y. Tanida and H. Miyashiro, “Flow Visualization VI,” Proceedings of the Sixth International Symposium on Flow Visualization, Springer Verlag, 1992.
[2] H. Hecht, Optics. Addison-Wesley Publishing Company, 2002. [3] H. Oertel, Optische strömungsmesstechnik. G. Braun Karlsruhe, 1989.
[4] L. M. Weinstein, “Large-field high-brightness focusing schlieren system,” AIAA Journal, vol. 31, no. 7, pp. 1250-1255, 1993.
[5] G. Schweiger, “Regular structures in a plane triple jet,” Journal of Fluids Engineering, Trans ASME, vol. 105, no. 1, pp. 42-46, 1983.
[6] M. J. Morris and J. C. Dutton, “Compressible flowfield characteristics of butterfly valves,” Journal of Fluids Engineering, vol. 111, no. 4, pp. 400-407, 1989.
[7] F. Bakhtar, R. A. Webb, M. H. Shojaee-Fard, and M. A. Siraj, “An investigation of nucleating flows of steam in a cascade of Turbine Blading,” J. Fluids Eng., vol. 115, pp. 128-134, 1993.
[8] N. Raud, Y. Bury, R. Bazile, J. Boree, and G. Charnay, “Experimental Study of the Behavior of Confined Variable Density jets in a time varying crossflow,” J. Fluids Eng., vol. 121, no. 1, pp. 65-72, 1999.
[9] S. M. Li, T. L. Chu, Y. S. Yoo, and W. F. Ng, “Transonic and low supersonic flow losses of two steam turbine blades at large incidences,” J. Fluids Eng., vol. 126, pp. 966-975, 2004.
[10] B. C. Chandra and S. R. Chakravarthy, “Experimental investigation of cavity-induced acoustic oscillations in confined supersonic flow,” J. Fluids Eng., vol. 127, pp. 761-769, 2005.
[11] C. C. Chen and C. C. Ting, “Investigating the effect of color mask on sensitivity for the color schlieren imaging,” International Journal of Engineering and Technology Innovation, vol. 3, no. 2, pp. 114-122, 2013.
[12] C. C. Ting and C. C. Chen, “Detection of gas leakage using micro color schlieren technique,” Measurement, vol. 46, pp. 2467-2472, 2013.
[13] G. S. Settles, “Visualizing full-scale ventilation airflows,” American Society of Heating Refrigerating and Air-Conditioning Engineers, ASHRAE Journal, pp. 19-26, 1997.
[14] G. S. Settles, Schlieren and shadowgraph techniques. Springer Verlag, 2001.
[15] G. S. Settles, T. P. Grumstrup, L. J. Dodson, J. D. Miller, and J. A. Gatto, “Full-Scale High-Speed Schlieren Imaging of Explosions and Gunshots,” Proc. of SPIE, 26th International Congress on High-Speed Photography and Photonics, vol. 5580, pp. 60-68, 2005.
[16] G. S. Settles, T. P. Grumstrup, J. D. Miller, M. J. Hargather, L. J. Dodson, and J. A. Gatto, “Full-Scale
High-Speed ’Edgerton’ Retroreflective shadowgraphy of explosions and gunshots,” Proc. 5th Pacific Symposium on Flow Visualization and Image, PSFVIP-5-251, 2005.
[18] O. K. Sommersel, D. Bjerketvedt, S. O. Christensen, O. Krest, and K. Vaagsaether, “Application of background oriented schlieren for quantitative measurements of shock waves from explosions,” Shock Waves, vol. 18, no. 4, pp. 291-297, 2008. [19] M. M. Biss, J. M. Densmore, K. L. McNesby, and B. E. Homan, “Natural-Background- Oriented Schlieren of Full-Scale
Explosions,” Proc. 27th Army Science Conference, Orlando Florida USA, 2009.
[20] M. J. Hargather and G. S. Settles, “Natural-background-oriented schlieren imaging,” Exp. Fluids, vol. 48, pp. 59-68, 2010. [21] G. S. Settles, “Important Developments in Schlieren and Shadowgraph Visualization during the Last Decade 2010,”