A Comparison of Automotive Waste Heat Recovery Systems
Madhusudan Raghavan
1,*, Yong Sheng He
21
General Motors R&D Center, Pontiac, MI 48340, USA
2
General Motors Global Propulsion Systems, Milford, MI 48380, USA
Received 05 June 2017; received in revised form 09 December 2017; accepted 05 January 2018
Abstract
The purpose of this research study is to assess schemes for recovering energy that is lost via an automobile’s
exhaust. Three systems for waste heat recovery, viz., (1) electric turbo-compounding, (2) organic Rankine cycles,
and (3) thermoelectrics are studied. This involves detailed computer simulations of the waste heat recovery
systems, integrated within a vehicle propulsion system operating over certification driving cycles. The simulations
suggest that fuel economy improvements of 3-5% could be achieved by converting waste heat into useful work.
Keywords: waste heat recovery systems, turbo-compounding, organic Rankine cycle, thermoelectrics
1.
Introduction
Fig. 1 Transportation sector energy use (MMBtu, Million BTUs) per capita
The International Energy Outlook [1] offers the following forecasts regarding population growth and energy
consumption in the future. Global population grows 28% from 6.9 billion in 2010 to 8.8 billion in 2040. Population remains
concentrated in Asia and Africa. Their shares of the global population are 70% in 2010 and 72% in 2040. Most other regions
continue to grow through 2040. Projected GDP rises by an average of 3.6% per year globally from 2010 to 2040, ranging from
a high of 5.7% for China to a low of 0.7% for the Middle East. Total world marketed energy will grow by 56% from 2010 to
2040, from 524 quads to 820 quads (quad = quadrillion Btu) with transportation sector projected usage shown in Fig. 1.
Against this backdrop of increasing population, energy consumption, urbanization, congestion and pollution, we are looking at
ways to improve vehicle fuel economy by minimizing automotive engine fuel consumption. In Raghavan [2], we explored
mechanical hybrid solutions to improving propulsion system efficiency. In the present work we have explored three thermal
schemes for automotive waste heat recovery (a) electric turbo-compounding, (b) organic Rankine cycles, and (c)
thermoelectrics, in the context of vehicle simulations on certification drive cycles. The difference between this work and prior
studies is that in each case we have sized the respective system for vehicle implementation and we evaluate the efficacy of each
system over the various certification drive cycles with numerous transients, as opposed to running each system at its best
steady-state operating point. Our modeling tools are sufficiently detailed that we are able to base our architecture decisions on
the simulation outcomes. We present the results of these studies and offer a comparative assessment of these 3 systems.
2.
Electric Turbo-Compounding
Electric-assisted turbocharging systems were developed previously for diesel engines as described in Hopmann et al., [3],
Millo et al., [4], and Balis et al., [5]. This kind of system consists of an electric machine integrated into the turbocharger shaft.
The electric machine can work as a motor to improve transient response or work as a generator to recover energy. A
turbo-compounding system with an extra downstream turbo-generator to recover waste energy was designed for diesel engines,
see Vuk [6]. Different types of electric turbo-compounding systems (ETC) were compared for turbocharged gasoline energy
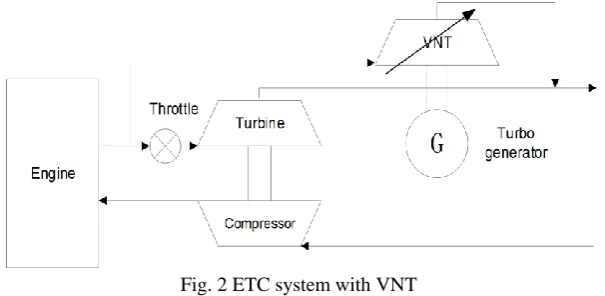
exhaust heat recovery as discussed by Wei et al., [7]. The system that we investigated is shown in Fig. 2. In order to increase
the flexibility of the exhaust energy recovery and minimize the energy loss, the turbo-generator may be driven by a Variable
Nozzle Turbine (VNT).
Fig. 2 ETC system with VNT
At engine low load or high speed operating conditions, the throttle would be partly or fully closed to transfer the exhaust
energy to the turbo-generator. At engine low speed and high load operating conditions, the VNT nozzle would be partly or
fully closed to ensure enough exhaust energy flows through the turbocharger turbine. The performance of the ETC system was
studied on a 1.8-liter in-line four-cylinder turbocharged and intercooled four-stroke gasoline engine (compression ratio of 9:1,
rated power of 125 kW at 5500 rpm and maximum torque of 235 Nm at 2000~4000 rpm). The turbine of the turbo-generator
was designed to meet the engine full-load power requirement, and the turbine geometry was optimized for better engine
part-load efficiency, as discussed in Zhuge et al., [8]. The optimized turbo-generator turbine parameters are as follows: inlet tip
radius 23.5 mm, inlet hub radius 23.5 mm, inlet blade height 4.0 mm, inlet blade angle 0°, exit tip radius 19 mm, exit hub radius
7 mm, exit blade angle 70°, number of blades 12, volute radius 40.5 mm, volute area 245 mm2.
The gasoline engine was modelled using the engine 1D simulation software tool, GT-Power, including gas exchange, fuel
combustion, heat transfer, and waste energy recovery by both the turbocharger for intake compression and the turbo-generator
for electric power generation. The compressors and turbines were modeled with turbo through-flow models based on
compressor two-zone models and the turbine mean-line flow models, instead of using compressor and turbine performance
turbine. This was critical to achieve the optimal performance of the ETC system.
A vehicle model of a typical passenger car was used to evaluate the ETC system performance under US06 and FTP75
drive cycles in GT-DRIVE. Parameters of the vehicle were as follows: vehicle mass 3150 lb, vehicle frontal area 1.997 m2, vehicle drag coefficient 0.348, final drive gear ratio 3.55, final drive efficiency 0.97, tire rolling radius 289.7 mm, tire rolling
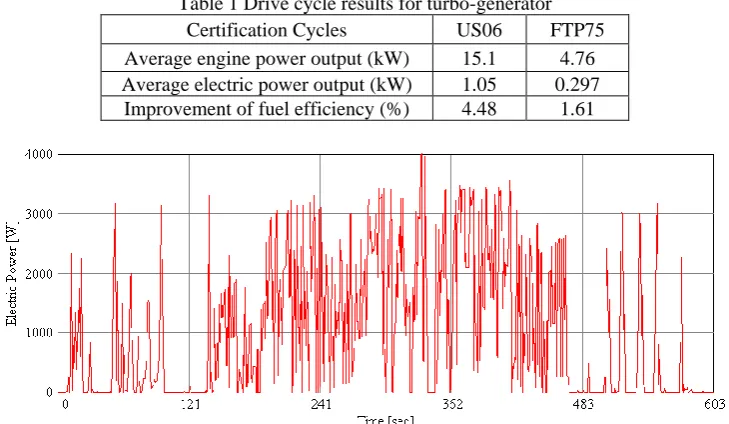
resistance factor 0.0122. Table 1 shows our key simulation results. The mechanical power output from the engine and the
electric power output from the turbo-generator were both considered in evaluating the overall fuel efficiency of the engine with
the ETC system. Fig. 3 shows electric power generated by the turbo-generator during the US06 driving cycle. The key
takeaway from this exercise was that a turbo-compounding system sized for a mid-sized vehicle offered a 1.6% fuel economy
improvement for the FTP75 City Cycle, no improvement on the highway cycle and a 4.48% improvement on the US06 cycle.
These fuel economy improvements were computed by placing the turbo-generator output on the 12V electrical bus so that this
recovered energy could either be stored in a 12V (Li-ion) battery or directly offset the electrical accessory loads by reducing
the electrical generator load.
Table 1 Drive cycle results for turbo-generator Certification Cycles US06 FTP75 Average engine power output (kW) 15.1 4.76 Average electric power output (kW) 1.05 0.297
Improvement of fuel efficiency (%) 4.48 1.61
Fig. 3 Electric power generation [watts] on US06
3.
Organic Rankine Cycles
A simplified schematic of a Rankine cycle power generator is shown in Fig. 4. For a vehicle application, the available heat
energy from the hot exhaust gas of an internal combustion engine (Qin) could be utilized to vaporize the working fluid to drive
a turbine for power generation. The organic Rankine cycle (ORC) uses an organic compound as the working fluid. This class
of fluid, typically a refrigerant, requires much less input energy to boil and is thus potentially better suited to applications
where the quality of the waste heat is variable, as in an automotive application. It also freezes at a much lower temperature,
which is another advantage. Kadota et al., [9], used engine coolant and exhaust heat along with a water-based Rankine system
incoporating an axial piston expander with a Motor/Generator. They claimed a system efficiency of 13%. Ringler et al., [10],
also used coolant and exhaust heat with a vane expander. The working fluid was water and ethanol and they claimed a 16%
system efficiency. Teng et al., [11], used the EGR heat and exhaust heat as the heat source. Their working fluid was ethanol
and they used a turbine for expansion. They claimed an estimated efficiency of 14%. Briggs et al., [12], used exhaust heat as
Fig. 4 Rankine cycle schematic
Under steady-state operating conditions, a Rankine cycle waste heat recovery (WHR) system can achieve relatively high
efficiency levels. Given a fixed temperature differential and sufficient system warm-up time, the efficiency levels quoted are
the highest that can be achieved. However, it is unlikely such levels are possible under transient vehicle operating conditions
and typical usage profiles for light-duty vehicles. To obtain a more realistic assessment of in-vehicle operating efficiency, a
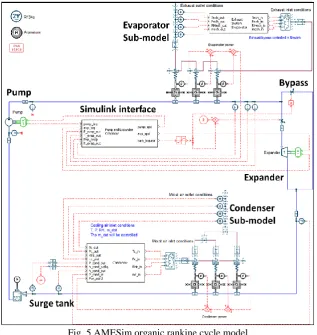
dynamic model of the organic Rankine cycle system was investigated at GM R&D using the AMESim software environment.
The model is shown schematically in Fig. 5. The Rankine system has 6 main components: an evaporator (or boiler), a turbine
expander with a bypass, a condenser, a receiver and pump. The receiver is also commonly referred to as a surge tank.
Fig. 5 AMESim organic rankine cycle model
The AMESim model is a full two-phase flow transient model that allows analysis of component sizing, refrigerant charge
determination, and component behavior including heat exchanger (HEX) effectiveness as a function of temperature, and heat
exchanger wall and fluid temperatures. An example of the model output is shown in Fig. 6, which represents system operation
on the US06 cycle. The expander and condenser power are shown as negative values while the evaporator and pump power are
input to the evaporator is extracted from the engine exhaust gas and transferred to the Rankine cycle working fluid via a
gas-liquid heat exchanger. We decided not to use the heat from the engine coolant to keep the mechanical circuitry simple. The
intermittent nature and variability of the on-cycle exhaust gas heat is evident from the evaporator power input.
Fig. 6 Modeled dynamic ORC WHR operation power
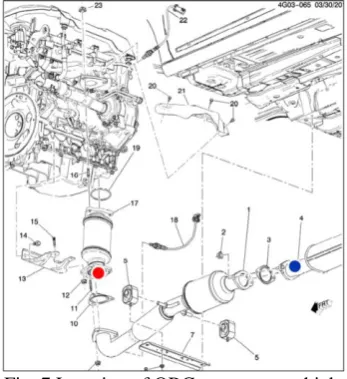
Fig. 7 Location of ORC system on vehicle
Fig. 8 Exhaust gas heat loss schematic
Using actual vehicle experimental data, an exhaust gas model was implemented and tuned to provide a reasonable
estimate for the exhaust gas temperature. The vehicle data was obtained from a Buick Lacrosse equipped with Belt Alternator
Starter (BAS) mild hybrid system. Fig. 7 shows the locations in the vehicle of the Catalyst-out (red dot) and Resonator-in (blue
dot) temperatures used to tune the exhaust model. The location of the WHR system evaporator is assumed to be downstream of
the catalytic converter and resonator, in the approximate location of the blue dot. We anticipate the evaporator heat exchanger
The exhaust temperature model is based on the simple heat loss model shown in Fig. 8. The exhaust gas loses heat to the
exhaust pipe, which in turn loses heat to the environment. Inputs are the exhaust flow rate and the fraction of the exhaust power
reaching the WHR system. Taking a control volume around a section of pipe, the heat transfer is approximated by the equation:
(
)
p gas exhaust pipe pipe gas pipe
mC
T
Q
h
A
T
T
(1)where m is the exhaust gas mass flow, Cp is the exhaust gas specific heat, Qexhaust
is the exhaust gas heat power and hpipe is
the convection coefficient for heat transfer between the gas and the pipe wall. There are two temperature states, the exhaust gas
temperature Tgas and the pipe wall temperature Tpipe. The exhaust mass flow is estimated from the air fuel ratio and fuel rate
reported by the engine subsystem from the vehicle model.
Using estimates of the heat power into the exhaust system derived from the test data, different exhaust temperature model
tunings were developed for the City, Highway and US06 cycles to match the test data trends of the catalyst-out temperature as
much as possible. Our choice of powertrains was influenced by the question of how best to utilize the power generated by a
WHR system. The power is generated mechanically but delivering it directly to a drive shaft introduces some complications which require redesign of the driveline components. Converting the WHR system’s mechanical output to electricity is more
easily accomplished in principle (e.g. via a generator), and this energy may be readily used on the electrical system of a mild
hybrid vehicle. The vehicle model that we used, had an 8kW evaporator, an 85% efficient isentropic expander, R600a as the
working fluid and an 89% electric generator to convert expander shaft power into electricity on a 4000-lb Test Weight Class
(TWC) SUV vehicle. The WHR system added 35 kg to the mass of the vehicle and this was accounted for in our modeling, as
was the thermal inertia of the system. Additionally the condenser was treated as integrated with the radiator in the vehicle, so
no additional cooling capacity was added to support WHR system operation.
Table 2 Drive cycle results for ORC WHR
Certification Cycles FTP City FTP Highway US06
Average Evaporator Temperature (oC ) 157.8 178.0 175.5 Average Exhaust Gas Temperature (oC ) 394.0 453.9 542.2
Fuel Economy Improvement (%) 2.7 5.1 4.6
The resulting WHR system efficiencies and fuel economy improvement over the baseline mild hybrid model are shown in
Table 2. Since the operation of the WHR system actually hinders engine warm up during cold start, a by-pass valve was used
to avoid the WHR system during start up. The integrated WHR/vehicle model provides a more realistic assessment of the
on-cycle fuel economy benefits of an ORC WHR system. In the mild-hybrid vehicle, the engine is on as long as the vehicle is
in motion, providing longer engine-on time. The engine is also running at lower cycle average efficiencies, leading to more
waste heat and higher exhaust temperatures. With higher exhaust temperatures, the average evaporator temperature increases,
leading to higher Carnot and actual system efficiency. The study also showed that the large estimated steady state efficiencies
are difficult to achieve if the vehicle operation is highly transient. Higher efficiencies may be obtainable in off-cycle conditions
like long-distance steady-state high-speed cruising.
4.
Thermoelectrics
A thermoelectric converter (TEC) is shown schematically in Fig. 9. The TEC is constructed of P-type and N-type
semiconductor thermoelectric (TE) materials connected electrically in series and thermally in parallel via hot and cold
junctions. The operating principle is the Seebeck effect by which a temperature differential between the hot and cold junction
results from the voltage potential difference across the TE material induced by the temperature differential. The TEG is a
collection of TECs plus the heat exchangers and other power electronics required to make a working WHR system.
There have been numerous prior studies on waste heat recovery systems based on thermoelectric generators (TEGs) for
potential automotive applications. See for example, Hussain et al., [13], LaGrandeur et al., [14], and Stobart et al., [15]. At GM
R&D, we explored the use of TEG electrical power derived from waste heat to try and achieve a 5% fuel economy gain on the
US06 drive cycle. The amount of electrical power required suggested that a vehicle with some degree of powertrain
electrification would be required to use the power generated to displace fuel. The 5% fuel economy improvement target
required that the cycle average power output from the TEG be 1.6 kW. As a potential target application we selected a mild
hybridized full-size truck (FST), as the large engine offers good opportunities for waste heat harvesting.
Fig. 9 Thermoelectric converter schematic
In this study, a Simulink vehicle model was used to simulate the behaviour of an integrated TEG WHR system to evaluate
fuel economy improvement, in the presence of transient effects, such as unsteady heat input, system warm-up, and thermal
inertia. For the hybrid vehicle, the power bus distributes power between electrical subsystems such as the high voltage energy
storage system and other components on the bus, such as a TEG. The TEG model is connected to the vehicle power bus similar
to other components such as the power steering, the cooling fan, the vacuum pump, the air-conditioner, and the DC/DC
converter. The vehicle model provides instantaneous exhaust power, coolant temperature, and fuel flow rate to the TEG model
subsystems. The fuel flow rate is used to estimate the exhaust mass flow using the approximation that the mass flow rate is
proportional to the air/fuel ratio (AFR). The exhaust mass flow and the exhaust power are inputs to the exhaust gas temperature
estimation model. The TEG physics are modelled in the lumped-parameter TEG subsystem model, which receives exhaust gas
temperature at the TEG inlet, the exhaust mass flow, and the coolant temperature as inputs. It outputs electrical power, which
is optionally scaled by an efficiency factor (value of 0.9) to reflect losses in the electrical power transfer to the bus. The details
of the above model are as follows.
Given an average TEG power output requirement of 1.6 kW for the mild hybrid truck, and a 10% conversion
efficiencyTEG, the average TEG heat power input required is 16.5kW, from the following equation.
TEG Out TEG In TEG
P P
(2)
The TEG system efficiency, TEG, is a function of the TEC module efficiency, the heat exchanger effectiveness and any
power conditioning (PC) efficiencies:
HEX TEC PC TEG
The TEC efficiency is calculated from the following equation, where Th is the hot junction temperature, Tc is the cold junction temperature and the mean temperature T = 0.5*(Th+Tc).
1 1
( )( )
1
h c
TEC
c h
h
T T
ZT
T T
ZT T
(4)
In the above, ZT is the dimensionless thermoelectric figure of merit based on the intrinsic properties of the TE materials.
Assuming a drive cycle average Tc of 100 deg C and Th of 400 deg C, a representative ZT is approximately 0.9 for the TE
material being developed for GM R&D. Thus,TEC = 0.1743. Assuming average power conditioning efficiency (PC) of
95% (DC/DC converters) and heat exchanger effectiveness of 0.6 (i.e., HEX = 60%), the overall TEG efficiency, TEG, is
9.9% which has been rounded to 10%. Thus, for the FST, the average TEG input power required is 16.5 kW, assuming a 10%
TEG level conversion efficiency. The average engine exhaust heat power is approximately 27 kW, assuming 30% of the fuel
energy is dissipated as exhaust heat.
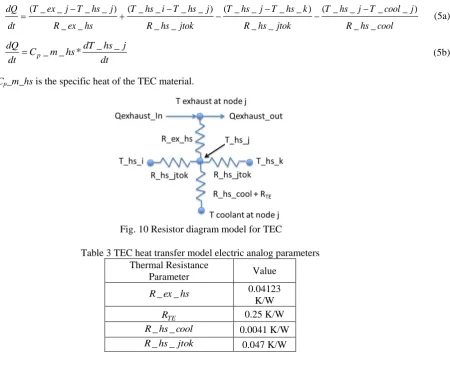
The TEG model is designed to capture spatial temperature distribution effects in the TEG. A TEC array is represented by
a single thermal capacitance node representing the hot sink for the array, again using the electrical analog for the heat transfer
model, shown in Fig. 10. Heat transfer from the exhaust gas heat exchanger to the hot sink is represented by a thermal
resistance R_ex_hs. The heat transfer into the TEC and out to the coolant is represented by R_hs_cool + RTE. Since each array
is thermally connected to adjacent arrays, the heat transfer between adjacent arrays, j, and k, is modeled by thermal resistance
R_hs_jtok. The temperature at the hot sink, T_hs_j, is determined by the state equation (Eq. (5)). The resistance data is given in Table 3.
( _ _ _ _ ) ( _ _ _ _ ) ( _ _ _ _ ) ( _ _ _ _ )
_ _ _ _ _ _ _ _
dQ T ex j T hs j T hs i T hs j T hs j T hs k T hs j T cool j
dt R ex hs R hs jtok R hs jtok R hs cool
(5a)
dt j hs dT hs m C dt dQ
p
_ _ * _ _
(5b)
where Cp_m_hs is the specific heat of the TEC material.
Fig. 10 Resistor diagram model for TEC
Table 3 TEC heat transfer model electric analog parameters Thermal Resistance
Parameter Value
hs ex
R_ _ 0.04123
K/W
TE
R 0.25 K/W
cool hs
R_ _ 0.0041 K/W
jtok hs
hs m
Cp_ _ 1021 J/K
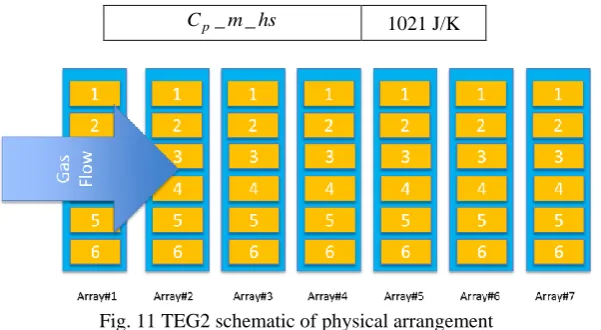
Fig. 11 TEG2 schematic of physical arrangement
The TEG is made up of 7 arrays as shown in Fig. 11. The power output section incorporates experimental data from the
skutterudite material made on the kg scale for the GM R&D project. Curve fits for these data produced the following equations
for the Seebeck coefficient and resistivity:
N-Type Material 7 7 2 10 5601 . 3 3690 . 5 3437 . 3 )
(T e T eT e
n (6a) 7 8 2 12 2490 . 7 6386 . 1 9721 . 6 ) (
RelnT e T eT e P-Type Material 5 7 2 10 2320 . 3 1472 . 6 4724 . 4 )
(T e T eT e
p (6b) 6 8 2 11 4659 . 2 2302 . 2 3142 . 1 ) (
Relp T e T eT e
The TECs’ open circuit voltage is defined by Eq. (7),
Th
c T n h T c T p
OC n T dT n T dT
V ( ) ( ) (7)
where n is the number of TE leg pairs in series, p,n is the temperature dependence of the Seebeck coefficient, and Tc and
Th are the cold and hot junction temperatures, respectively, such that Th - Tc =TJunc. The total electrical resistance of the TE module is calculated from Eq. (8),
2 ) ( Re ) ( Re 2 ) ( Re ) ( Re mod c n h n c p h
p T l T l T l T
l
A nL
R (8)
where L is the TE module leg length and A is the leg’s cross sectional area. For the simulation, n = 32, L = 0.004m and A
= 0.000016m2. In order to calculate Voc, we integrate p
T and n
T from Eqs. (6a) and (6b):h T c T h T c T
OC T e T
e T e T e T e T e V
10 3 7 2 5 10 3 7 2 3.56017
2 3690 . 5 3 3437 . 3 2320 . 3 2 1472 . 6 3 4724 . 4 (9 )
The total power per TEC array is then computed by combining the powers of the various individual modules.
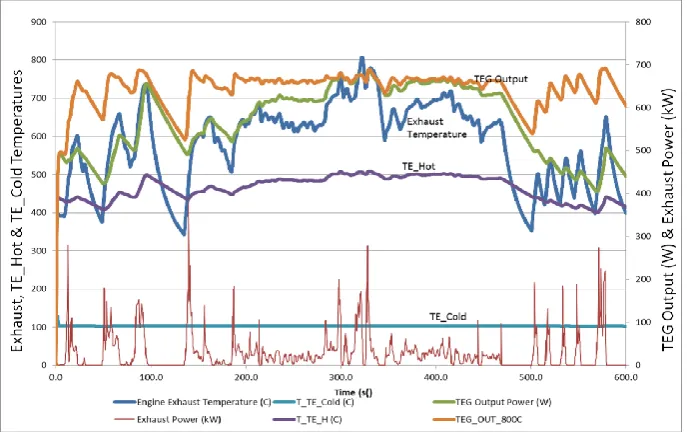
In the vehicle model the power generated by the TEG appears as surplus power which can be used as needed. The model
contains an exhaust bypass control to prevent the peak hot junction temperature from exceeding a preset limit by diverting flow
from going into the TEG. The exhaust backpressure model also causes exhaust to bypass the TEG if the predicted
shown in Fig. 12. Key points to note are as follows. The modelled exhaust gas temperature at the TEG inlet is the blue curve,
the exhaust gas heat power into the TEG is the red curve, and the corresponding TEG output power is in green. The orange
curve shows the TEG output power assuming a constant exhaust gas temperature of 800oC at the TEG inlet. This is an upper bound on the TEG output power. The TEG hot side and cold side temperatures are shown respectively by the purple (TE_Hot)
and teal (TE_Cold) curves. From the green (actual) and orange (max output) lines, we observe that the maximum TEG output
capability is reached between 270 sec and 420 sec on the high-speed portion of the US06 drive cycle. The actual FE gains over
the US06 cycle are shown in Table 4. The FE improvements were close to zero for the FTP City and Highway Cycles. The
US06 result showed a fuel economy improvement of approximately 2% but fell considerably short of the 5% goal.
Fig. 12 Mild hybrid FST with TEG WHR system
Table 4 US06 drive cycle results for TEG
Engine Output (kJ) FE Gain (%)
No TEG (Basesline) 15756 0
TEG 15441 2.0
5.
Conclusions
In this study, three different waste heat recovery systems (electric turbo-compounding, organic Rankine cycle, and
thermoelectrics) were explored and their potential to improve vehicle fuel economy were evaluated.
(1)The Electric Turbo-Compounding system with a turbo-generator driven by a VNT, when applied to a mid-size 3150-lb
vehicle, showed fuel economy gains of 1.6% on the FTP City cycle, 0% on the FTP Highway cycle and 4.5% on the US06
cycle, respectively.
(2)The Organic Rankine Cycle system, with R600a as the working fluid, improved the fuel economy of a mild hybrid 4000-lb
SUV vehicle by 2.7% on the FTP City cycle, 5.1% on the FTP Highway cycle, and 4.6% on the US06 cycle.
(3)The Thermoelectric Generator system, when applied to a mild hybrid 6500-lb full-size truck, provided little or no fuel
economy improvement on the FTP City and Highway cycles, and a 2% fuel economy improvement on the US06 cycle.
While we do not claim that these trends will be the same for all applications (heavy duty trucks may show a different
trend), we are reasonably confident (based on the fidelity of our sub-system models) that the above numbers are representative
and accurate for light duty vehicle applications. Integrated WHR/vehicle system models are essential to providing realistic
assessment of the on-cycle fuel economy benefits of the various WHR systems. Specific introductions of these systems in the
References
[1] “U. S. Energy InformationAdministration(EIA),” http://www.eia.gov/forecasts/archive/ieo13/pdf/0484(2013).pdf, 2013. [2] M. Raghavan, “Propulsion architectures using mechanical energy storage,” Proc. the Institution of Mechanical Engineers,
Part K: Journal of Multi-body Dynamics, vol. 230, no. 3, pp. 242-250, 2016.
[3] U. Hopmann and M. C. Algrain, “Diesel engine electric e-turbo compound technology,” SAE Technical Paper, 2003. [4] F. Millo, F. Mallamo, E. Pautasso, and G. Ganio Mego, “The potential of electric exhaust gas turbocharging for hd diesel
engines,”Politecnico di Torino, SAE Technical Paper, 2006.
[5] C. Balis, C. Middlemass, and S. M. Shahed, “Design & development of e-turbo for SUV and light truck applications,” CONF. DEER 2003: Garrett Engine Boosting Systems, June 23, 2003.
[6] C. T. Vuk, “Electric turbo-compounding - a technology whose time has come,” Proc. DEER, Diesel Engine Emissions Reduction Conference, 2003, August 21-25.
[7] W. Wei, W. Zhuge, Y. Zhang, and Y. He, “Comparative study on electric turbo-compounding systems for gasoline engine exhaust energy recovery,” University of Amsterdam, ASME paper GT2010-23204, 2010.
[8] W. Zhuge, L. Huang, W. Wei, Y. Zhang, and Y. He, “Optimization of an electric turbo-compounding system for gasoline engine exhaust energy recovery,” The University of Hong Kong, Department of Mechanical Engineering, SAE Technical Paper, 2011.
[9] M. Kadota and K. Yamamoto, “Advanced transient simulation on hybrid vehicle using rankine cycle system,” SAE International Journal of Engines, vol. 1, no. 1, pp. 240-247, 2008
[10] J. Ringler, M. Seifert, V. Guyotot, and W. Hubner, “Rankine cycle for waste heat recovery of ic engines,” SAE International Journal of Engines , vol. 2, no. 1, pp. 67-76, 2009
[11] H. Teng, J. Klaver, T. Park, G. L. Hunter, and B. van der Velder, “A rankine cycle system for recovering waste heat from hd diesel engines - WHR System Development,” SAE Technical Paper, 2011
[12] T. E. Briggs, R. Wagner, K. D. Edwards, S. Curran, and E. Nafziger, “A waste heat recovery system for light duty diesel engines,”Oak Ridge National Laboratory, SAE Technical Paper, 2010.
[13] Q. Hussain, D. Brigham, and J. Maranville, “Thermoelectric exhaust heat recovery for hybrid vehicles,” SAE International Journal of Engines, vol. 2, no. 1, pp. 1132-1142, 2009.
[14] J. LaGrandeur, D. Crane, and A. Eder, “Vehicle fuel economy improvement through thermoelectric waste heat recovery,” 2005 Diesel Engine-Efficiency and Emissions Research (DEER) Conference, Chicago, IL, August 2008.