O R I G I N A L R E S E A R C H
Open Access
Accuracy of tumor segmentation from
multi-parametric prostate MRI and
18
F-choline PET/CT for focal prostate cancer
therapy applications
Morand Piert
1,5*, Prasad R. Shankar
1, Jeffrey Montgomery
2, Lakshmi Priya Kunju
3, Virginia Rogers
1,
Javed Siddiqui
3, Thekkelnaycke Rajendiran
3, Jason Hearn
4, Arvin George
2, Xia Shao
1and Matthew S. Davenport
1Abstract
Background:The study aims to assess the accuracy of multi-parametric prostate MRI (mpMRI) and18F-choline PET/CT in tumor segmentation for clinically significant prostate cancer.18F-choline PET/CT and 3 T mpMRI were performed in 10 prospective subjects prior to prostatectomy. All subjects had a single biopsy-confirmed focus of Gleason≥3+4 cancer. Two radiologists (readers 1 and 2) determined tumor boundaries based on in vivo mpMRI sequences, with clinical and pathologic data available.18F-choline PET data were co-registered to T2-weighted 3D sequences and a semi-automatic segmentation routine was used to define tumor volumes. Registration of whole-mount surgical pathology to in vivo imaging was conducted utilizing two ex vivo prostate specimen MRIs, followed by gross sectioning of the specimens within a custom-made 3D-printed plastic mold. Overlap and similarity
coefficients of manual segmentations (seg1, seg2) and18F-choline-based segmented lesions (seg3) were compared to the pathologic reference standard.
Results:All segmentation methods greatly underestimated the true tumor volumes. Human readers (seg1, seg2)
and the PET-based segmentation (seg3) underestimated an average of 79, 80, and 58% of the tumor volumes, respectively. Combining segmentation volumes (union of seg1, seg2, seg3 = seg4) decreased the mean
underestimated tumor volume to 42% of the true tumor volume. When using the combined segmentation with 5 mm contour expansion, the mean underestimated tumor volume was significantly reduced to 0.03 ± 0.05 mL (2. 04 ± 2.84%). Substantial safety margins up to 11–15 mm were needed to include all tumors when the initial segmentation boundaries were drawn by human readers or the semi-automated18F-choline segmentation tool. Combining MR-based human segmentations with the metabolic information based on18F-choline PET reduced the necessary safety margin to a maximum of 9 mm to cover all tumors entirely.
Conclusions:To improve the outcome of focal therapies for significant prostate cancer, it is imperative to recognize the full extent of the underestimation of tumor volumes by mpMRI. Combining metabolic information from18F-choline with MRI-based segmentation can improve tumor coverage. However, this approach requires confirmation in further clinical studies.
Keywords:Prostate cancer, Tumor segmentation, MRI,18F-fluoromethylcholine, PET/CT, Focal therapy
* Correspondence:[email protected] 1
Radiology Department, University of Michigan, Ann Arbor, MI, USA 5Department of Radiology, Division of Nuclear Medicine, University of Michigan Health System, University Hospital B1G505C, 1500 E. Medical Center Drive, Ann Arbor, MI 48109-0028, USA
Full list of author information is available at the end of the article
© The Author(s). 2018Open AccessThis article is distributed under the terms of the Creative Commons Attribution 4.0
Background
The rationale for focal therapy of prostate cancer is based on the concept of minimizing damage to off-target tissues while achieving successful local treatment response. Focal treatment methods include cryotherapy, laser ablation, high-frequency focused ultrasound (HIFU), irreversible
electroporation, and focal brachytherapy [1–4]. The
bene-fit compared to radical treatment is reduced invasiveness that lessens patient morbidity. The key to the success of focal therapies is appropriate patient selection based on
an unequivocal, usually solitary, treatment target [5].
For focal therapies, it is imperative not only to accurately
differentiate significant from indolent prostate cancer [6,7],
but also to precisely identify the tumor borders. In recent
years, multi-parametric prostate MRI (mpMRI) has
emerged as a useful tool for the detection and risk stratifi-cation of primary prostate cancer and recently has been incorporated into American Urological Association (AUA) algorithms for patients with suspected or low-risk prostate
cancer [8–10]. When used optimally, mpMRI can
cost-effectively identify a significantly greater fraction of clinically
significant cancers (Gleason score ≥7 [≥3 + 4]) compared
to standard biopsy alone while minimizing the detection of
low-risk cancer [11–13]. These outcomes are important
be-cause accurate risk stratification of primary prostate cancer historically has been fraught with overdiagnosis and
over-treatment [14–16]. However, mpMRI is not perfect. It
suf-fers from a large false-positive rate [17, 18], only moderate
inter-rater agreement [19], and a steep learning curve [20],
each resulting in unnecessary biopsies that drive complica-tion rates and unwanted deteccomplica-tion of low-risk disease.
It has recently been demonstrated that the addition of
positron emission tomography (PET) with 18F-choline to
mpMRI (PET/MRI) can significantly improve the
identification of Gleason ≥3+4 prostate cancer over
mpMRI alone [21], mainly by improving on the
comparatively low specificity of mpMRI [17]. The purpose
of this study was to determine the precision of tumor boundary detection (segmentation) by visual inspection of mpMRI and by semi-automatic segmentation based on
18
F-choline PET in patients undergoing prostatectomy. Due to prostate deformations, differing slice thicknesses between imaging and histology, and differing spatial orientation between imaging and whole-mount pathology, registration of medical imaging to pathology from
prosta-tectomy specimen is challenging [22]. To overcome these
issues, we first accurately registered in vivo imaging to the prostatectomy specimen using a multi-step approach pre-sented in this paper.
Methods
Patient population
We report on a subset of patients within a Health Insurance Portability and Accountability Act-compliant
registered prospective trial (Clinicaltrials.gov identifier:
NCT01751737) to assess the value of mpMRI and 18
F-choline PET prior to targeted and standard prostate
biopsies [21]. The institutional ethics committee approved
this protocol. Written informed consent was obtained. Ten study subjects with rising PSA values and suspected or known untreated localized adenocarcinoma of the prostate recruited between November 2013 and June 2016 subsequently underwent prostatectomy following the
detection of Gleason≥3+4 cancer at biopsy. The majority
of patients had additional low-grade (Gleason 3+3)
can-cers at final pathology (Table1), but such low-grade
dis-ease was not the subject of this study.
The study participants, 65 ± 5 years of age (range 57–73),
had 1.2 ± 0.6 (range 0–2) biopsy procedures prior to
enter-ing the trial. Three subjects did not have a prior biopsy. Previous biopsies resulted in four Gleason 3+3 cancers, one Gleason 3+4 cancer, and no prostate cancer in the remaining two cases. PSA levels at study entry ranged from 3.0 to 24.4 ng/mL (mean 8.65 ± 8.06).
Multi-parametric prostate MRI
All MR imaging was performed on the same 3 T unit (Ingenia, Philips Healthcare, Andover, MA, USA) with-out an endorectal coil using a 16-channel phased array
coil. Technical details are provided in the literature [21].
Briefly, the following in vivo MRI pelvic examinations with and without contrast material were acquired prior to biopsy: axial 3D T2-weighted (T2w) fast spin echo (FSE) (voxel size 1.0 × 1.0 × 1.0 mm; repetition time 2051 ms; echo time (TE) 333 ms); axial/sagittal/coronal T2w 2D FSE (voxel size 0.7 × 0.9 × 3.0 mm; repetition time 4758 ms; TE 110 ms); axial diffusion-weighted im-aging (voxel size 2.3 × 2.4 × 3.0 mm; b-factors 0, 100, and
800 s/mm2); and axial T1w pre- and dynamic
post-contrast 3D spoiled gradient echo with spectral adiabatic inversion recovery fat saturation (dynamic contrast-enhanced (DCE); in-plane voxel size 0.9 × 0.9 mm). Patients were encouraged to empty their bladder prior to scanning to minimize deformation effects on the prostate. An apparent diffusion coefficient (ADC) map was reconstructed for all diffusion-weighted imaging se-quences, and subtraction imaging was generated for all DCE sequences.
For ex vivo MRI, axial and coronal 3D T2w FSE (voxel size 0.75 × 0.75 × 0.75 mm; repetition time 2451 ms; TE 320 ms) and axial diffusion-weighted imaging (voxel size 0.5 × 0.5 × 3.0 mm; b-factors 0 and 800 s/mm2) were acquired.
18
F-choline PET/CT
18
F-choline was synthesized as described in the literature
[23]. MRI and 18F-choline PET/CT were acquired
18
F-choline PET/CT scans were performed on a Biograph TrueV mCT scanner with extended field of view and a 40-channel helical CT (Siemens Medical Solutions, Malvern, PA, USA) with an intrinsic axial resolution of 4.1 mm FWHM and time-of-flight
recon-struction [24]. Twenty minutes after IV injection of
approximately 230 MBq of 18F-choline, a low-dose CT
transmission scan and a 10-min emission scan of the lower abdomen and pelvis were performed. Images were
reconstructed using established methods [21].
Tumor segmentations
For segmentation of prostate cancer lesions, all mpMRI series were reviewed on a PACS workstation (McKesson, San Francisco, CA, USA). Two fellowship-trained expert prostate MRI readers were tasked to contour the histo-logically known significant prostate cancer on the T2w sequence simulating a target volume definition for focal prostate cancer treatment. For this purpose, the readers had full knowledge of the prior reports of the in vivo mpMRI scans as well as all histological reports of prior biopsies, including targeted biopsies based on mpMRI lesions identified. The readers were blinded to the seg-mentation of the other reader as well as blinded to the
results from18F-choline PET, the ex vivo specimen MRI
scans, and the final histology from prostatectomy. After identification of a candidate lesion, an individual tumor volume of interest (VOI) was defined based on the basis of visual perception of the lesion borders on a MIM Maestro (MIM Software, Cleveland, OH, USA) workstation and assigned as seg1 (reader 1) and seg2 (reader 2) for each case. A semiautomatic gradient-based segmentation method (PETEdge, MIM Software, Cleveland, OH, USA) without manual adjustments was used to determine the
borders of the MRI-identified lesions on18F-choline PET
(assigned as seg3) [25]. Furthermore, all three
segmentation volumes of a given tumor were spatially combined (union of seg1, seg2, seg3 = seg4) for further analysis. Gradient edge detection identifies tumor on the basis of a change in SUV at the tumor border. The
particular gradient method used calculates spatial
derivatives along tumor radii then defines the tumor edge on the basis of derivative levels and continuity of the tumor edge. This well-established method has been shown in phantom studies to be more accurate and reproducible compared to manual segmentation as well as threshold methods determining the tumor border on the basis of a
percentage of the maximum activity within the tumor [26].
We also determined the accuracy of volume estimates based on a commonly applied ellipsoid formula. For this purpose, the maximum distance of the tumor in three dimensions (transverse, coronal, sagittal) was determined and the tumor volume was calculated based on the
ellipsoid formula (length × width × height × 0.52) [27].
This formula-based tumor volume estimate as well as all other segmentations (seg1, seg2, seg3, seg4) were com-pared to a true volumetric measurement obtained from histology as depicted on high-resolution 3D T2w MRI as standard of reference. Here, the tumor volume (in milliliters) is defined by the sum of voxels encompassed by the individually drawn tumor VOI. Accordingly, any part of the standard of reference (histological) tumor volume that was not included in the tumor volume esti-mate (segmentation or formula-based) is defined as the underestimated tumor volume.
Pathological evaluation
Whole-mount sections after prostatectomy were proc-essed for routine histological assessment (hematoxylin/ eosin (HE) stain) using the paraffin embedding process
Table 1Patient characteristics
Patient Age (years)
PSA at time of biopsy (ng/mL)
Time interval between MRI and PET (days)
Time interval between imaging and biopsy (days)
Time interval from biopsy to prostatectomy (days)
Volume of Gleason≥7 disease at pathology (mL)
Standard biopsy highest Gleason score
Targeted biopsy highest Gleason score
Final maximum Gleason score at prostatectomy
Number of additional Gleason 3+3 cancers at prostatectomy
1 57 4.6 0 23 63 0.19 3 + 3 3 + 4 3 + 4 4
2 73 4.3 0 21 61 1.35 3 + 4 Negative 3 + 4 6
3 73 4.6 0 15 133 1.35 3 + 3 3 + 4 3 + 4 2
4 60 23.0 19 6 55 3.15 3 + 4 4 + 4 4 + 3 1
5** 64 3.0 0 14 120 0.15 3 + 3 3 + 3 3 + 4 4
6 65 24.4 25 56 99 1.37 Negative 3 + 4 4 + 3 0
7 62 4.6 47 28 146 0.57 Negative 4 + 3 4 + 3 2
8 66 20.4 45 49 106 6.31 3 + 4 4 + 3 4 + 3 0
9 59 4.7 37 35 169 0.91 3 + 3 4 + 5 4 + 5 0
10 66 8.6 35 7 79 3.73 Negative 3 + 4 3 + 4 0
and 3-μm sections. Each tumor focus was assigned a pri-mary and secondary Gleason grade and staged according to the American Joint Committee on Cancer guidelines
[28]. All tumor foci were microscopically assessed
whether any inhomogeneity of Gleason pattern within
Gleason ≥3+4 cancers was present. For this study,
sig-nificant prostate cancer was defined conservatively as
any Gleason ≥3+4 cancer regardless of the tumor
volume [29].
Registration process PET to MRI
First, PET data were registered onto 3D T2w MR using commercially available software (MIM Maestro, Cleve-land, Ohio, USA). The result of rigid registrations was visually assessed using pelvic bones as landmarks. In se-lected cases when rectal content or bladder filling shifted the position of the prostate, a constrained intensity-based, free-form deformable registration was added to
register the prostate on MRI and PET [30]. Such
regis-tration was possible using the outline of the bladder base and internal prostatic structures (such as BPH nodules) identified on both imaging as landmarks.
Registration process histology from prostatectomy to MRI and PET
The second and more difficult registration step was the mapping of histology onto MRI through the use of the ex vivo prostate specimen MRI. Following prostatec-tomy, an ex vivo T2w 3D specimen MRI was performed with the prostate immersed in perfluorocarbon solution. This solution was used to avoid susceptibility artifacts
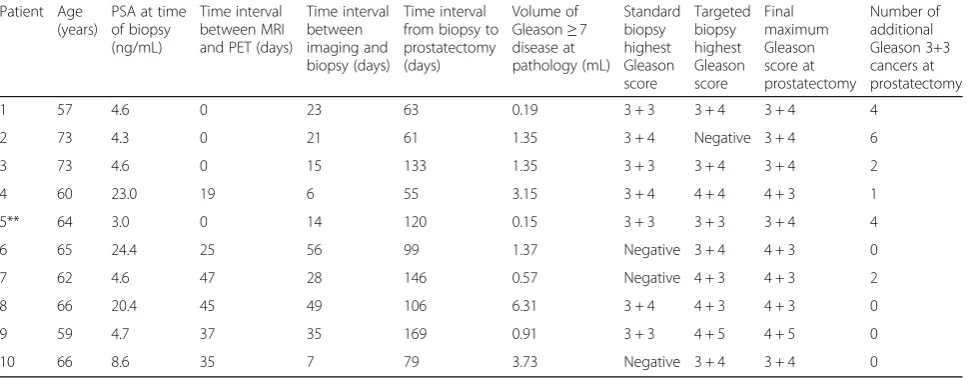
(Fig.1a) [21]. Using the specimen MRI data, the prostate
was segmented on a 3D workstation (Vitrea, Vital Images, Minnetonka, MN, USA). The segmentation
served as the basis for a 3D-printed mold (Fig.1b) that
could hold the prostate (Dimension Elite 3D, Stratasys, Eden Prairie, MN, USA). The mold design included slits spaced 3 mm apart that were later used to facilitate
accurate gross sectioning of the prostate specimen
within the mold (Fig.1c). The specimen MRI also
facili-tated image registration utilizing intra-prostatic features (e.g., BPH nodules).
Following complete fixation of the prostate, the prostate borders at the base and apex were gross sectioned off the specimen to allow detailed histological assessments for potential extraprostatic extension. Then, a second MR scan was performed with the prostate specimen
posi-tioned within the mold (Fig. 1d). Next, the prostate was
gross sectioned without repositioning (Fig. 1e), linking
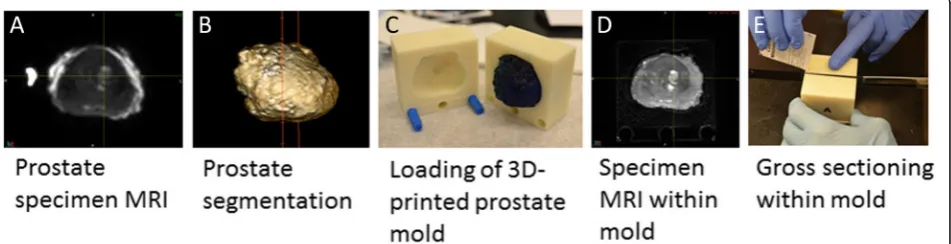
corresponding histological whole-mount HE slides to their respective sectioning planes from the second ex vivo MRI. Since microtome sectioning for histology regularly de-forms the HE slide relative to its representation on MR, we obtained block-face photographs at the time of gross
sectioning (Fig.2a). If notable deformation resulted from
sectioning, we utilized these block-face photographs to register each deformed HE slide back to its original shape at the time of gross sectioning.
Volumetric 3-mm stacks of HE whole-mount histology
sections (Fig. 2b) were then registered onto the ex vivo
high-resolution specimen MRI, providing a consistent registration of the ex vivo MRI to pathology at 3-mm in-tervals. The registration of whole-mount HE and ex vivo HR MRI was rigid for the respective slice at the slit level.
However, in between those intermittent “rigid”
registra-tions, deformable registration was often required. Since a given HE slice is repeated to cover a 3-mm-thick space (in z-direction), deformable registration was needed to follow contour and intraprostatic changes seen on MRI. In essence, the prostate borders and well-identifiable intraprostatic structures (urethra, BPH nodules, tissue borders between peripheral and transitional zones) were aligned using constrained intensity-based, free-form de-formable registration.
All prostate cancer foci were outlined by the
pathologist on whole-mount HE slices (Fig. 2c), and
lesion boundaries were transferred into the ex vivo MRI
(Fig. 2d/e). The registration quality was checked on
overlay images (Fig. 2f), and the ex vivo T2w 3D MRI
with embedded histological information was registered
back into the in vivo T2w 3D MRI (Fig.3).
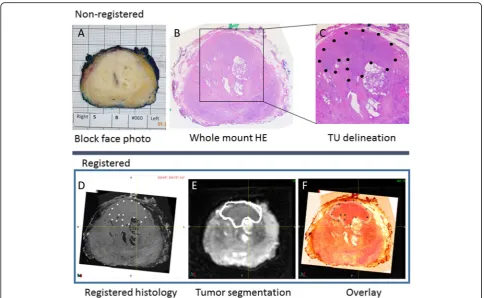
Assessment of registration accuracy
We determined the accuracy of image registrations between in vivo T2w MR and histology using well-delineated BPH nodules as landmarks. One suitable BPH nodule was identified in each of 10 prostatectomy cases. First, the respective BPH nodules were segmented on stacked HE histology slices. Since HE slices were not continuous, but 3 mm apart, we used software interpolation between each slice to fill the resulting gaps. Then, the same BPH nodules were individually
seg-mented on ex vivo and in vivo MRI volumes (Fig. 3).
Common similarity coefficients were calculated to determine registration accuracy: Hausdorff distance (HD), mean distance to agreement (MDA), and Dice and
Jaccard [31]. Dice and Jaccard coefficients are similar
statistical measures of the spatial overlap between two volumes as follows:
DiceðA;BÞ ¼ 2jA∩Bj
A
j j þj jB ; ð1Þ
JaccardðA;BÞ ¼jA∩Bj
A∪B
j j; ð2Þ
where A denotes the tumor volume estimate and B the
standard of truth (histological) tumor volume. Here, Dice is defined as 2 × intersection volume/total sum of volumes, while Jaccard describes the volume of intersection between two volumes/volume of the union of these volumes. Both overlap coefficients normalize the degree of intersection from 0 (no overlap) to 1 (perfect overlap). The spatial dis-tance coefficients HD and MDA describe the volumetric maximum (HD) and mean distances (MDA) across all points on a surface and their closest point on another sur-face, where 0 mm reflects ideal outcome.
Statistics
Statistical analyses were performed using JMP 13 (SAS, Cary, NC). Data were not normally distributed. To
compare contour measurements (seg1–3 vs. histological
truth), a paired Wilcoxon signed-rank test was performed. To compare similarity coefficients among readers (seg1,2) vs. PET-based segmentation routine (seg3), an unpaired Wilcoxon test was used. Data are presented as mean ±
standard deviation (SD), andP values less than 0.05 were
considered statistically significant.
Results
Patient characteristics are summarized in Table 1.
Histological tumor volumes were small with a median of
1.37 mL (range 0.15 to 6.31 mL). The Gleason ≥3+4
tumor with the lowest volume (case 5 in Table 1) was
not identified by both readers and excluded from further analysis. The median time between mpMRI and PET, and the median time between the second MRI scan and the biopsy procedure were both 22 days. The median time from biopsy to prostatectomy was 102 days (range
55–169 days). The histological results from standard
biopsies were upgraded on targeted biopsies in 8 of 10 cases. In one case, the targeted biopsy missed a Gleason 3+4 index cancer (case 2) identified on standard biopsy. No significant intratumoral variations in Gleason pattern
within Gleason≥3+4 cancers were observed.
Figure 3 demonstrates the accuracy of BPH nodule
registrations obtained from pathology, ex vivo MRI, and in vivo MRI. Overall registration accuracy between in vivo MRI and histology was excellent with maximum HD below 2.7 mm and mean MDA below 0.5 mm with limited inter-individual variability as indicated by their
respective standard deviations (Table2). The overlap
co-efficients Dice and Jaccard were high between in vivo MRI and final pathology. Note that the final registration distance errors (in HD and MDA) between in vivo MRI and histology were less than the sum of their respective
uncertainties for each registration step (Table2).
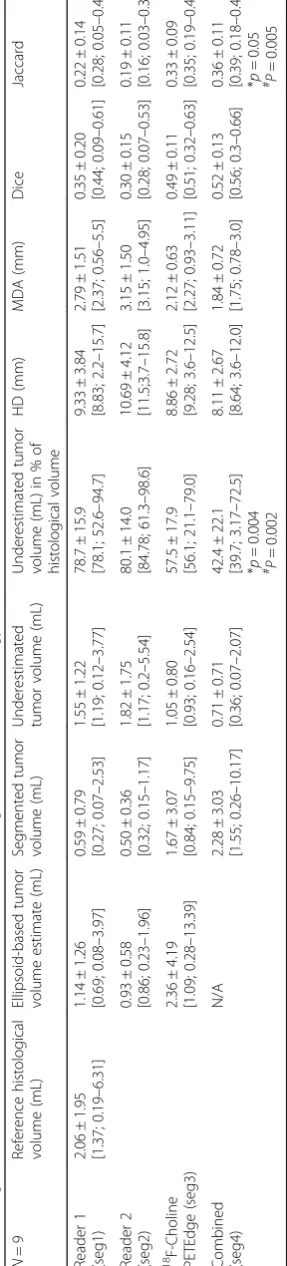
The results of tumor border segmentations relative to
the histological reference standard are listed in Table 3.
Visual tumor border segmentation based on MRI and PET-based thresholding substantially underestimated the true tumor volumes (seg1 by 79%, seg2 by 80%, seg3 by
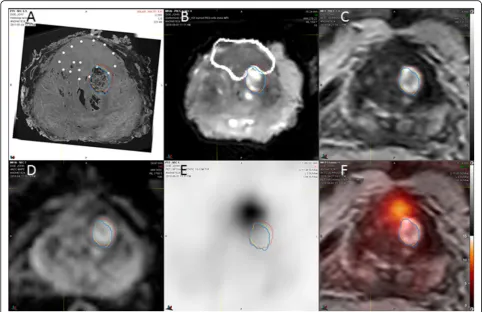
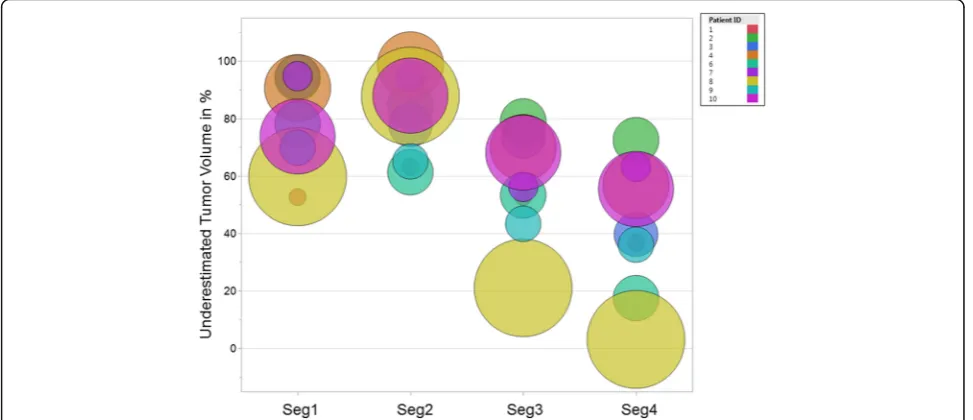
58%). As seen from Fig. 4, regardless of the
segmenta-tion method, the true tumor volume has no major impact on the level of underestimation. Also, the under-estimated tumor volume of the single high-risk (Gleason 4+5) cancer found (patient 9) is among the range of
otherwise intermediate risk cancers (Table 1). Imaging
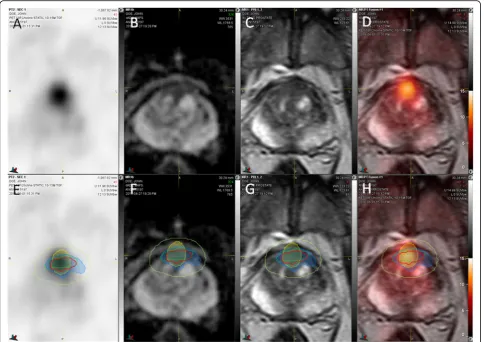
Fig. 3Determination of registration accuracy. Registered transaxial HE histology (a), specimen 3D T2W MRI (b), in vivo 3D 2TW MRI (c), ADC (d), 18
findings of a typical example case are shown in Fig. 5. Similarity coefficients obtained from MRI and PET contours reveal misplaced tumor borders compared to
histology (Table 3). Applying an ellipsoid formula to
estimate the VOI volume resulted in a significant overestimation of the segmented volume by an average
48, 46, and 29% for seg1–3, respectively (p< 0.004 for
each) (Table3).
When a 5-mm contour expansion was applied in all directions from the tumor border segmentation edge, the underestimated tumor volume decreased significantly compared to the original segmentation (seg1: from 1.55 to 0.27 mL; seg2: from 1.82 to 0.57 mL; seg3: from 1.05 to 0.
15 mL, P< 0.001). However, due to variations in tumor
shape and lack of centering of the original segmentation,
minimum contour expansions of 15 mm (seg1–2) and
11 mm (seg3) would have been needed to fully cover all
Gleason≥7 disease.
As indicated by Dice coefficients≤0.41 and Jaccard≤0.27,
agreement between human readers and human vs.
PET-based segmentations was low (Table 4). In fact, human
readers and PET-based segmentation often identified dif-ferent regions of the histological tumor volume, which lead to an improvement of the segmentation accuracy when all segmentations were combined (seg4). The under-estimated tumor volume of the combined segmentation was significantly smaller than that of the individual human
readers (Table3).
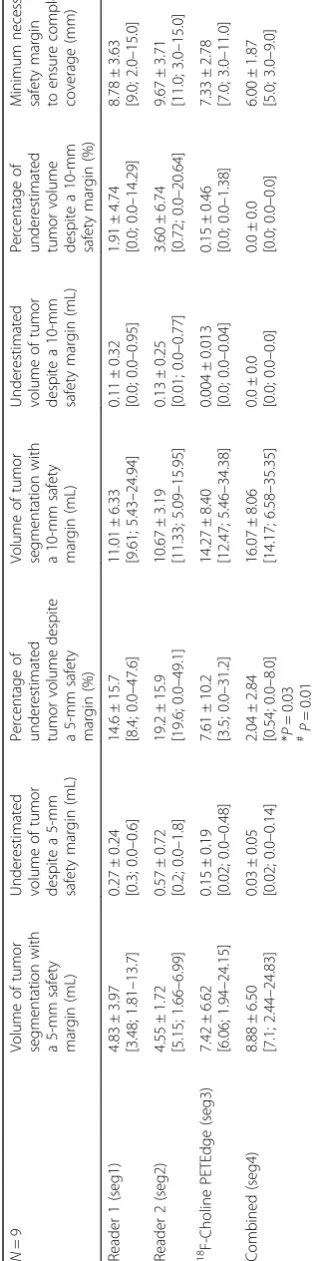
As expected, including a safety margin around the segmentation volumes significantly decreased the
under-estimated tumor volume (Table 5). The combined
seg-mentation volume (seg4) with a 5-mm safety margin covered the entire tumor volume in five of nine cases; in the remaining four cases, a missed tumor volume of 0.03 ± 0.05 mL (2.04 ± 2.84% of the total tumor volume)
resulted (Fig.5e–h). While the percent of the
underesti-mated volume was small, a contour expansion up to 9 mm was required to cover the entire tumor of irregu-larly shaped lesions. In contrast, with even larger target volumes at the 10-mm expansion level, complete tumor coverage could not be achieved for all tumors in the study by either human reader or the PET-based routine alone.
Discussion
The goal of focal prostate cancer therapies is to destroy the entire tumor lesion using a non-invasive, well-tolerated treatment. Such a treatment would preserve normal genitourinary function while providing sufficient therapeutic efficacy. In order to be effective, focal pros-tate cancer therapies require accurate localization of the disease. The high anatomic detail provided by mpMRI at 3 T appears well suited to provide necessary guidance. However, it has already been recognized that lesion
ex-tension is typically underestimated by mpMRI [32].
Therefore, all focal treatment approaches are performed
with a safety margin [33]. The key question is how to
optimally define such safety margins.
We developed and applied a methodology for objective retrospective registration of whole-mount pathology to in vivo MRI and PET imaging. This method enabled us to determine whether in vivo imaging correctly identi-fied and classiidenti-fied all tumor lesions found at final
pathology from prostatectomy specimen [21]. A similar
approach was used to determine boundary errors based on visual image inspection on MRI as well as
mathemat-ical thresholding techniques on 11C-choline PET [34].
To our knowledge, this is the first report on the accuracy of prostate cancer segmentations from mpMRI
and 18F-choline PET using registered whole-mount
hist-ology as the reference standard. For this performance test, we simulated the clinical situation of a radiologist tasked to delineate tumor borders prior to a hypothetical planned ablation, in which readers were aware of the interpretation of the mpMRI and biopsy-based histology but had no
knowledge of the 18F-choline PET results, ex vivo MRIs,
or the pathology from the prostatectomy specimen. Determining the accuracy of prostate cancer segmen-tation in MRI is difficult. Typically, error metrics are
de-rived from measured inter-observer variability [35]. This
is subject to bias because it lacks a reference standard. We took a different approach by registering imaging to histology, thereby enabling error measurements of tumor border delineation. Our results indicated a
sub-stantial difference between “perceived” (i.e., by imaging)
and “true” (i.e., by histology) tumor borders. Human
Table 2Accuracy of BPH nodule registration across mpMRI and histology
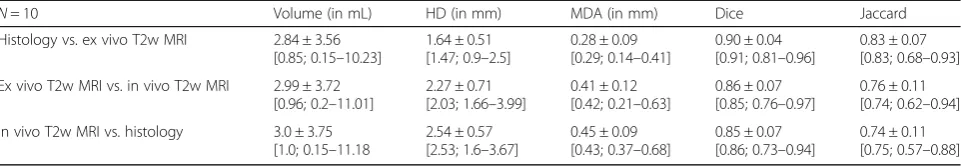
N= 10 Volume (in mL) HD (in mm) MDA (in mm) Dice Jaccard
Histology vs. ex vivo T2w MRI 2.84 ± 3.56 [0.85; 0.15–10.23]
1.64 ± 0.51 [1.47; 0.9–2.5]
0.28 ± 0.09 [0.29; 0.14–0.41]
0.90 ± 0.04 [0.91; 0.81–0.96]
0.83 ± 0.07 [0.83; 0.68–0.93]
Ex vivo T2w MRI vs. in vivo T2w MRI 2.99 ± 3.72 [0.96; 0.2–11.01]
2.27 ± 0.71 [2.03; 1.66–3.99]
0.41 ± 0.12 [0.42; 0.21–0.63]
0.86 ± 0.07 [0.85; 0.76–0.97]
0.76 ± 0.11 [0.74; 0.62–0.94]
In vivo T2w MRI vs. histology 3.0 ± 3.75 [1.0; 0.15–11.18
2.54 ± 0.57 [2.53; 1.6–3.67]
0.45 ± 0.09 [0.43; 0.37–0.68]
0.85 ± 0.07 [0.86; 0.73–0.94]
0.74 ± 0.11 [0.75; 0.57–0.88] Mean ± standard deviation [median; minimum–maximum range]
Table 3 Agreement of manual and semi-automated tumor segmentation with histology N = 9 Referen ce hist ological volume (mL) Ellipsoid-base d tumor volume es timate (mL) Segm ented tumor volu me (mL) U nderesti mated tu mor vo lume (mL) Unde restimated tu mor volu me (mL) in % of histolog ical volume HD (mm ) MDA (m m) Dice Jaccard Reade r 1 (seg1) 2.06 ± 1.95 [1.37; 0.19 – 6.31] 1.14 ± 1.26 [0.69; 0.08 – 3.97] 0.59 ± 0.79 [0.27 ; 0.07 – 2.53] 1. 55 ± 1.22 [1.1 9; 0. 12 – 3. 77] 78.7 ± 15.9 [78.1 ; 52.6 – 94.7] 9.33 ± 3.84 [8.83 ; 2.2 – 15.7 ] 2.79 ± 1.51 [2.37 ; 0.56 – 5.5] 0.35 ± 0.20 [0.44 ; 0.09 – 0.61] 0.22 ± 0.14 [0.28 ; 0.05 – 0.44] Reade r 2 (seg2) 0.93 ± 0.58 [0.86; 0.23 – 1.96] 0.50 ± 0.36 [0.32 ; 0.15 – 1.17] 1. 82 ± 1.75 [1.1 7; 0. 2 – 5.54] 80.1 ± 14.0 [84.7 8; 61.3 – 98.6] 10.69 ± 4.12 [11.5 ;3.7 – 15.8] 3.15 ± 1.50 [3.15 ; 1.0 – 4. 95] 0.30 ± 0.15 [0.28 ; 0.07 – 0.53] 0.19 ± 0.11 [0.16 ; 0.03 – 0.36]
18 F-Choline PETEd
expert prostate MRI readers and the PET-based routine were equally unsatisfactory. Depending on tumor shape
and the identification of the lesions’ center by human
readers, minimum contour expansions between 11 and
15 mm would have been needed to cover all Gleason≥3+4
disease. Currently applied standard safety margins are typ-ically 10 mm or less, which our results imply would often be insufficient.
Ouzzane et al. recently noted that only few studies with valid methodology attempted to address the crucial
question of safety margins [4]. Depending on the
planned focal treatment method and the lesion location
within the prostate, 4–10 mm safety margins have been
proposed [1, 36, 37]. For example, Ting et al. used
irre-versible electroporation to treat 25 men with low- to intermediate-risk prostate cancer with a 5-mm mini-mum safety margin. Short-term follow-up indicated a 24% recurrence rate at 8 months and almost all
recur-rences were adjacent to the treatment zone [2],
suggest-ing that treatment of larger tumor volumes would have
been needed. Safety margins of 4–6 mm near the
sphincter muscle have been advocated to avoid incontin-ence. Ahmed et al. performed a prospective HIFU trial involving 56 men with low- (12%), intermediate- (84%), and high-risk (4%) prostate cancer. Fifty-two men re-ceived a 6-month post-treatment biopsy, and clinically
significant cancer was found in 10 cases [38]. Other
groups advocate hemiablation to achieve better
long-term disease control with low morbidity [39]. Based on
the available literature, it remains debatable whether
focal prostate cancer treatment is a suitable alternative to established whole-gland treatment approaches.
While our registration method was designed to optimize the accuracy of registration between in vivo MRI and pathology, it is not without error. The quan-tification of registration errors is difficult because the processing of human prostate tissues has to follow established methodological standards. Since the bladder surface and the prostatic apex are undergoing separate histological assessments to evaluate for possible extra-capsular extension of cancer, they are not part of the final prostate specimen. Fiducial markers could not be introduced into the specimen after prostatectomy be-cause they would be dislodged during sectioning of the whole-mount blocks. Due to the stability constraints of plastic molds, slits for gross sectioning of the prostate within the mold were spaced at 3-mm intervals. There-fore, there was a maximum uncertainty of 3 mm and a mean uncertainty of 1.5 mm with respect to the pres-ence or abspres-ence of a given lesion on consecutive slices. Using software interpolation between registered whole-mount HE slices, as done in this study, will however lessen uncertainties in tumor border definition. Defor-mations of the specimen relative to the in vivo geometry of the prostate are often non-uniform. Bending and warping energies are particularly high at the lateral
per-ipheral zones of the prostate [22], which increases
lesion representation on in vivo T2W MRI used for tumor segmentation. In fact, when determining the registration errors of BPH nodules from in vivo over ex vivo MRI to histology, the HD and MDA of the final registration (in vivo MRI to histology) increased but was far less than the sum of the individual registration errors. Registration errors due to dehydration of internal pros-tate tissue components during fixation are unavoidable
and will cause shrinkage of the prostate specimen
com-pared to the prostate in the human body [22]. Schned et
al. estimated that the in vivo tumor volume was on aver-age 12.4% higher than that measured from
prostatec-tomy pathology [40]. Our own measurements obtained
from well-delineated BPH nodules agree with this as-sessment. The less-than-perfect overlap coefficients (Dice and Jaccard < 1) obtained from BPH nodules can
Table 4Inter-reader agreement
Comparison HD (mm) MDA (mm) Dice (range 0–1) Jaccard (range 0–1)
Reader 1 (seg1) vs. reader 2 (seg2) 8.56 ± 4.80 [7.09; 2.84–16.15]
2.43 ± 2.42 [1.46; 0.73–8.42]
0.41 ± 0.19 [0.45; 0.0–0.62]
0.27 ± 0.13 [0.29; 0.0–0.44]
Reader 1 (seg1) vs.18F-choline PETEdge (seg3) 8.25 ± 3.95 [8.30; 4.37–14.27]
2.47 ± 1.43 [2.08; 1.07–4.60]
0.37 ± 0.14 [.0.41; 0.11–0.50]
0.23 ± 0.10 [0.26; 0.06–0.34]
Reader 2 (seg2) vs.18F-choline PETEdge (seg3) 9.73 ± 5.22 [8.72; 3.09–18.16]
2.97 ± 1.91 [2.11; 0.90–7.12]
0.32 ± 0.14 [0.27; 0.15–0.54]
0.20 ± 0.10 [0.16; 0.08–0.37] Mean ± standard deviation [median; minimum–maximum range]
HDHausdorff distance,MDAmean distance to agreement
therefore in part be attributed to fixation-induced BPH shrinkage. Conversely, tumor shrinkage may have been smaller than in normal glandular tissue due to higher cellularity of tumors. Nonetheless, tumor shrinkage bears the potential to further underestimate tumor volumes on imaging relative to pathology.
As recently reviewed, the data on tumor volume esti-mates by MRI relative to histology are mixed; however, most published data report an underestimation of tumor
volumes by mpMRI [32]. What may appear surprising in
our study is the extent of the underestimation compared to prior reports. When considering the technical im-provements of mpMRI over the last decade with the availability of 3 T MRI, one would expect improving ac-curacy in tumor border delineation. However, consider-ing three prior reports comparconsider-ing mpMRI at 3 T with
whole-mount histology [27, 41, 42], two of which used
3D molds for sectioning, underestimation of tumor vol-umes between 7 and 80% were noted. The lowest
under-estimation was found by Turkbey et al. [27]; however,
their study was limited due to tumor volume measure-ments based on an ellipsoid formula rather than a true volumetric measurement, which based on our data significantly overestimates lesion volumes. Also, gross sectioning of prostate specimen was performed manually in almost half of the subjects, which is technically ex-tremely difficult to be done at 4-mm intervals thereby
introducing errors [22]. Furthermore, they did not
ac-count for misplacement of tumor borders on histology relative to in vivo MRI as done in our study. Le Nobin et al. did not use 3D molds to facilitate registration of MRI and histology, nonetheless reporting on average 57% greater tumor volumes on histology vs. mpMRI evaluating retrospectively 46 lesions of overall smaller
volume (mean 1.1 mL) compared to our cohort [42].
More recently, Priester et al. studied 114 subjects undergoing prostatectomy using individually 3D-printed molds for sectioning. The mean volume (2.5 mL) of 107 clinically significant prostate cancers was similar to our data, and the majority of tumors were graded as
Gleason ≥3+4 [41]. Although they did not determine
volumetric similarity coefficients, their overall results are comparable to our study. Eighty percent of the cancer vol-ume from matched tumors was outside of the MR-defined tumor volume, a result that is very similar compared to our own data. The mean HD between histology and mpMRI of clinically significant tumors was 15.6 mm, which was even worse compared to our data (HD of
9.3–10.7 mm for human readers).
A potential reason for the observed disparities of tumor volume estimates obtained from in vivo imaging vs. histology from prostatectomy specimen could have been related to interim tumor growth, particularly as 5
of 10 patients underwent surgery roughly 5–7 months
after imaging. While absolute volume growth rates of
untreated Gleason ≥3+4 cancers are unknown,
adeno-carcinomas of the prostate are typically progressing
slowly [43]. Supporting evidence for slow progression of
intermediate risk prostate cancer comes from the obser-vation arms of the Scandinavian Prostate Cancer Group
Study Number 4 [44] and the Protect trial [45]. Indeed,
9 of 10 patients included in our cohort harbored intermediate-risk (Gleason 3+4 or 4 + 3) cancer. In one patient with high-risk cancer (Gleason 4+5) and the longest time interval (204 days) between imaging and
prostatectomy (patient 9 in Table 1 and Fig. 4), the
underestimated tumor volume was however well within the range of other segmentations. Therefore, we sider interval tumor growth not to be a significant con-tributing factor for the observed underestimation of the tumor volumes.
While the underestimation of tumor volumes on PET can be attributed to technical aspects of PET imaging in-cluding partial volume effects limiting image resolution
[46], the reasons for underestimated tumor volumes on
MRI are less clear. One possibility could be an inhomo-geneity of Gleason pattern within a given tumor, where
the“detectable”center of such lesions has higher cellular
density compared to the periphery of lesions. Since
Gleason 3+3 cancers are often missed on MRI [41] and
lack focal elevated 11C-choline [46] and 18F-choline
uptake on PET above background [21], we investigated
whether mpMRI may only have identified certain pockets
of more aggressive disease (Gleason≥3+4), while missing
areas of low-grade disease within inhomogeneous prostate
cancers. However, a specific analysis of all Gleason≥3+4
cancers did not identify any inhomogeneity of Gleason pattern within individual lesions that could explain the profound underestimation of tumor volumes. Nonethe-less, missed tumors are often small and have lower grade than visible tumors on MRI. In addition, non-visible dis-ease may display benign prostatic glandular tissue
inter-mixed with carcinoma [47]. Not only the cellular density
or its distribution, but also the cellular composition, par-ticularly the amount of interstitial stromal space, has an
effect on DWI and derived ADC maps [48]. Since DWI
plays an important role for visual identification of prostate
cancer on mpMRI, this phenomenon could explain—at
least in part—the underestimation of tumor volumes and
underlying uncertainties about tumor borders.
Conclusions
Visual tumor segmentation based by mpMRI and
semi-automatic segmentation based on 18F-choline uptake
measures significantly underestimated the true volume
of Gleason ≥3+4 prostate cancer, and substantial safety
segmentations with a semi-automated thresholding
approach based on 18F-choline PET reduced the
necessary safety margin to a maximum of 9 mm. While further work in a larger cohort is needed to validate these findings, this approach might contribute to improving the outcome of focal therapies of significant prostate cancer.
Acknowledgements
We thank the many technicians of the MRI and PET facilities and the 3D laboratory of the Radiology Department for their excellent support. Particularly, we thank Shawn O’Grady of the University of Michigan 3D Lab for his suggestions and expertise.
Funding
This work was funded by the US Department of Defense (DOD) W81XWH-12-1-0597.
Availability of data and materials
Please contact the author for data requests.
Authors’contributions
MP, PS, VR, MD, and TR contributed to the data analysis. JM and AG performed surgical procedures. JS, TR, JH, MP, and MD participated in the design and implementation of the study. JS and LPK carried out the histology analyses. XS performed radiotracer syntheses. All authors read and approved the final manuscript.
Ethics approval and consent to participate
All procedures performed in studies involving human participants were in accordance with the ethical standards of the institutional and/or national research committee and with the 1964 Helsinki Declaration and its later amendments or comparable ethical standards. The study protocol was approved by the University Research Ethics Board, and a signed written informed consent was obtained from all individual participants included in the study.
Consent for publication
Not applicable.
Competing interests
The authors declare that they have no competing interests.
Publisher’s Note
Springer Nature remains neutral with regard to jurisdictional claims in published maps and institutional affiliations.
Author details
1Radiology Department, University of Michigan, Ann Arbor, MI, USA.2Urology Department, University of Michigan, Ann Arbor, MI, USA.3Pathology Department, University of Michigan, Ann Arbor, MI, USA.4Department of Radiation Oncology, University of Michigan, Ann Arbor, MI, USA. 5Department of Radiology, Division of Nuclear Medicine, University of Michigan Health System, University Hospital B1G505C, 1500 E. Medical Center Drive, Ann Arbor, MI 48109-0028, USA.
Received: 29 December 2017 Accepted: 15 March 2018
References
1. Sivaraman A, Barret E. Focal therapy for prostate cancer: an“A la Carte” approach. Eur Urol. 2016;69:973–5.
2. Ting F, Tran M, Bohm M, Siriwardana A, Van Leeuwen PJ, Haynes AM, Delprado W, Shnier R, Stricker PD. Focal irreversible electroporation for prostate cancer: functional outcomes and short-term oncological control. Prostate Cancer Prostatic Dis. 2016;19:46–52.
3. Natarajan S, Raman S, Priester AM, Garritano J, Margolis DJ, Lieu P, Macairan ML, Huang J, Grundfest W, Marks LS. Focal laser ablation of prostate cancer: phase I clinical trial. J Urol. 2016;196:68–75.
4. Ouzzane A, Betrouni N, Valerio M, Rastinehad A, Colin P, Ploussard G. Focal therapy as primary treatment for localized prostate cancer: definition, needs and future. Future Oncol. 2017;13:727–41.
5. Klotz L, Emberton M. Management of low risk prostate cancer-active surveillance and focal therapy. Nat Rev Clin Oncol. 2014;11:324–34. 6. Bailey J, Piert M. Performance of 68Ga-PSMA PET/CT for prostate cancer
management at initial staging and time of biochemical recurrence. Curr Urol Rep. 2017;18:84.
7. Piert M, El Naqa I, Davenport MS, Incerti E, Mapelli P, Picchio M. PET/MRI and prostate cancer. Clin Transl Imaging. 2016;4:473–85.
8. Sanda MG, Chen RC, Crispino T, Freedland S, Greene K, Klotz LH, Makarov DV, Nelson JB, Reston J, Rodrigues G, Sandler HM, Taplin ME, Cadeddu JA. Clinically localized prostate cancer: AUA/ASTRO/SUO guideline: American Urological Association; 2017. http://www.auanet.org/guidelines/clinically-localized-prostate-cancer-new-(aua/astro/suo-guideline-2017)#x6914.
9. Andrew B, Rosenkrantz MSV, Choyke P, Eberhardt SC, Haider MA, Margolis DJ, Taneja MKG SS, Eggener SE, Marks LS, Pinto P, Sonn GA. Prostate MRI and MRI-targeted biopsy in patients with prior negative biopsy: American Urological Association; 2017. https://www.auanet.org/guidelines/prostate-mri-and-mri-targeted-biopsy.
10. Marc A. Bjurlin, Peter R. Carroll, Scott Eggener, Pat F. Fulgham, Peter A. Pinto, Jonathan N. Rubenstein, Daniel B. Rukstalis, Samir Taneja, Ismail Baris Turkbey. MRI of the prostate, standard operating procedure (SOP). 2017. 11. Venderink W, Govers TM, de Rooij M, Futterer JJ, Sedelaar JPM. Cost-effectiveness
comparison of imaging-guided prostate biopsy techniques: systematic transrectal ultrasound, direct in-bore MRI, and image fusion. AJR Am J Roentgenol. 2017;208:1058–63.
12. de Rooij M, Crienen S, Witjes JA, Barentsz JO, Rovers MM, Grutters JP. Cost-effectiveness of magnetic resonance (MR) imaging and MR-guided targeted biopsy versus systematic transrectal ultrasound-guided biopsy in diagnosing prostate cancer: a modelling study from a health care perspective. Eur Urol. 2014;66:430–6.
13. Siddiqui MM, Rais-Bahrami S, Turkbey B, George AK, Rothwax J, Shakir N, Okoro C, Raskolnikov D, Parnes HL, Linehan WM, Merino MJ, Simon RM, Choyke PL, Wood BJ, Pinto PA. Comparison of MR/ultrasound fusion-guided biopsy with ultrasound-guided biopsy for the diagnosis of prostate cancer. JAMA. 2015;313:390–7.
14. Rosenkrantz AB, Taneja SS. Prostate MRI can reduce overdiagnosis and overtreatment of prostate cancer. Acad Radiol. 2015;22:1000–6.
15. Tawadros T, Valerio M. Addressing overtreatment following the diagnosis of localized prostate cancer. Expert Rev Anticancer Ther. 2016;16:373–4. 16. Gu X, Choueiri TK, Martin NE, Hu JC, Nguyen PL. Overtreatment of low-risk
prostate cancer in the United States: incidence, cost, complications, and implications for the screening debate. J Clin Oncol. 2013;31:161. 17. Ahmed HU, El-Shater Bosaily A, Brown LC, et al. Diagnostic accuracy of
multi-parametric MRI and TRUS biopsy in prostate cancer (PROMIS): a paired validating confirmatory study. Lancet. 2017;389:815–22.
18. Abd-Alazeez M, Ahmed HU, Arya M, Charman SC, Anastasiadis E, Freeman A, Emberton M, Kirkham A. The accuracy of multiparametric MRI in men with negative biopsy and elevated PSA level—can it rule out clinically significant prostate cancer? Urol Oncol. 2014;32:45 e17–22.
19. Muller BG, Shih JH, Sankineni S, Marko J, Rais-Bahrami S, George A, de la Rosette JJ, Merino MJ, Wood BJ, Pinto P, Choyke PL, Turkbey B. Prostate cancer: interobserver agreement and accuracy with the revised prostate imaging reporting and data system at multiparametric MR imaging. Radiology. 2015;277:741–50.
20. Rosenkrantz AB, Ayoola A, Hoffman D, Khasgiwala A, Prabhu V, Smereka P, Somberg M, Taneja SS. The learning curve in prostate MRI interpretation: self-directed learning versus continual reader feedback. AJR Am J Roentgenol. 2017;208:W92–W100.
21. Piert M, Montgomery J, Kunju LP, Siddiqui J, Rogers V, Rajendiran T, Johnson TD, Shao X, Davenport MS. 18F-choline PET/MRI: the additional value of PET for MRI-guided transrectal prostate biopsies. J Nucl Med. 2016;57:1065–70.
22. Meyer C, Ma B, Kunju LP, Davenport M, Piert M. Challenges in accurate registration of 3-D medical imaging and histopathology in primary prostate cancer. Eur J Nucl Med Mol Imaging. 2013;40(Suppl 1):72–8.
24. Jakoby BW, Bercier Y, Conti M, Casey ME, Bendriem B, Townsend DW. Physical and clinical performance of the mCT time-of-flight PET/CT scanner. Phys Med Biol. 2011;56:2375–89.
25. Liao S, Penney BC, Wroblewski K, Zhang H, Simon CA, Kampalath R, Shih MC, Shimada N, Chen S, Salgia R, Appelbaum DE, Suzuki K, Chen CT, Pu Y. Prognostic value of metabolic tumor burden on 18F-FDG PET in nonsurgical patients with non-small cell lung cancer. Eur J Nucl Med Mol Imaging. 2012;39:27–38.
26. Werner-Wasik M, Nelson AD, Choi W, Arai Y, Faulhaber PF, Kang P, Almeida FD, Xiao Y, Ohri N, Brockway KD, Piper JW, Nelson AS. What is the best way to contour lung tumors on PET scans? Multiobserver validation of a gradient-based method using a NSCLC digital PET phantom. Int J Radiat Oncol Biol Phys. 2012;82:1164–71.
27. Turkbey B, Mani H, Aras O, Rastinehad AR, Shah V, Bernardo M, Pohida T, Daar D, Benjamin C, McKinney YL, Linehan WM, Wood BJ, Merino MJ, Choyke PL, Pinto PA. Correlation of magnetic resonance imaging tumor volume with histopathology. J Urol. 2012;188:1157–63.
28. Fleming ID, Cooper JS, Henson DE. AJCC cancer staging manual. 5th ed. Philadelphia: Lippincott, Raven; 1998.
29. Van der Kwast TH, Roobol MJ. Defining the threshold for significant versus insignificant prostate cancer. Nat Rev Urol. 2013;10:473–82.
30. Kirby N, Chuang C, Ueda U, Pouliot J. The need for application-based adaptation of deformable image registration. Med Phys. 2013;40:011702. 31. Taha AA, Hanbury A. Metrics for evaluating 3D medical image
segmentation: analysis, selection, and tool. BMC Med Imaging. 2015;15:29. 32. Wysock JS, Lepor H. Multi-parametric MRI imaging of the prostate-implications
for focal therapy. Transl Androl Urol. 2017;6:453–63.
33. Bomers JGR, Cornel EB, Futterer JJ, Jenniskens SFM, Schaafsma HE, Barentsz JO, Sedelaar JPM, Hulsbergen-van de Kaa CA, Witjes JA. MRI-guided focal laser ablation for prostate cancer followed by radical prostatectomy: correlation of treatment effects with imaging. World J Urol. 2017;35:703–11.
34. Park H, Meyer CR, Wood D, Khan A, Shah R, Hussain H, Siddiqui J, Seo J, Chenevert T, Piert M. Validation of automatic target volume definition as demonstrated for (11)C-choline PET/CT of human prostate cancer using multi-modality fusion techniques. Acad Radiol. 2010;17:614–23. 35. Shahedi M, Cool DW, Bauman GS, Bastian-Jordan M, Fenster A, Ward AD.
Accuracy validation of an automated method for prostate segmentation in magnetic resonance imaging. J Digit Imaging. 2017;30:782–95.
36. Cordeiro ER, Cathelineau X, Thuroff S, Marberger M, Crouzet S, de la Rosette JJ. High-intensity focused ultrasound (HIFU) for definitive treatment of prostate cancer. BJU Int. 2012;110:1228–42.
37. Crouzet S, Rouviere O, Martin X, Gelet A. High-intensity focused ultrasound as focal therapy of prostate cancer. Curr Opin Urol. 2014;24:225–30. 38. Ahmed HU, Dickinson L, Charman S, Weir S, McCartan N, Hindley RG,
Freeman A, Kirkham AP, Sahu M, Scott R, Allen C, Van der Meulen J, Emberton M. Focal ablation targeted to the index lesion in multifocal localised prostate cancer: a prospective development study. Eur Urol. 2015;68:927–36.
39. Rischmann P, Gelet A, Riche B, Villers A, Pasticier G, Bondil P, Jung JL, Bugel H, Petit J, Toledano H, Mallick S, Rouviere O, Rabilloud M, Tonoli-Catez H, Crouzet S. Focal high intensity focused ultrasound of unilateral localized prostate cancer: a prospective multicentric hemiablation study of 111 patients. Eur Urol. 2017;71:267–73.
40. Schned AR, Wheeler KJ, Hodorowski CA, Heaney JA, Ernstoff MS, Amdur RJ, Harris RD. Tissue-shrinkage correction factor in the calculation of prostate cancer volume. Am J Surg Pathol. 1996;20:1501–6.
41. Priester A, Natarajan S, Khoshnoodi P, Margolis DJ, Raman SS, Reiter RE, Huang J, Grundfest W, Marks LS. Magnetic resonance imaging
underestimation of prostate cancer geometry: use of patient specific molds to correlate images with whole mount pathology. J Urol. 2017;197:320–6. 42. Le Nobin J, Rosenkrantz AB, Villers A, Orczyk C, Deng FM, Melamed J,
Mikheev A, Rusinek H, Taneja SS. Image guided focal therapy for magnetic resonance imaging visible prostate cancer: defining a 3-dimensional treatment margin based on magnetic resonance imaging histology co-registration analysis. J Urol. 2015;194:364–70.
43. Lucca I, Klatte T, Shariat SF. Words of wisdom. Re: radical prostatectomy or watchful waiting in early prostate cancer. Eur Urol. 2014;66:386–7. 44. Bill-Axelson A, Holmberg L, Garmo H, Rider JR, Taari K, Busch C, Nordling S,
Haggman M, Andersson SO, Spangberg A, Andren O, Palmgren J, Steineck G, Adami HO, Johansson JE. Radical prostatectomy or watchful waiting in early prostate cancer. N Engl J Med. 2014;370:932–42.
45. Hamdy FC, Donovan JL, Lane JA, Mason M, Metcalfe C, Holding P, Davis M, Peters TJ, Turner EL, Martin RM, Oxley J, Robinson M, Staffurth J, Walsh E, Bollina P, Catto J, Doble A, Doherty A, Gillatt D, Kockelbergh R, Kynaston H, Paul A, Powell P, Prescott S, Rosario DJ, Rowe E, Neal DE, Protec TSG. 10-year outcomes after monitoring, surgery, or radiotherapy for localized prostate cancer. N Engl J Med. 2016;375:1415–24.
46. Piert M, Park H, Khan A, Siddiqui J, Hussain H, Chenevert T, Wood D, Johnson T, Shah RB, Meyer C. Detection of aggressive primary prostate cancer with 11C-choline PET/CT using multimodality fusion techniques. J Nucl Med. 2009;50:1585–93.
47. Langer DL, van der Kwast TH, Evans AJ, Sun L, Yaffe MJ, Trachtenberg J, Haider MA. Intermixed normal tissue within prostate cancer: effect on MR imaging measurements of apparent diffusion coefficient and T2—sparse versus dense cancers. Radiology. 2008;249:900–8.