ORIGINAL ARTICLE
Train Vehicle Structure Design
from the Perspective of Evacuation
Hanzhao Qiu
1,2and Weining Fang
1*Abstract
The safety of trains, a highly efficient mode of transportation, has attracted significant attention. In the vehicle struc-ture design of a train, the evaluation of the passenger evacuation time is necessary. The establishment of a simulation model is the fastest, most convenient, and practical way to achieve this goal. However, few scholars have focused on the reliability of a passenger train evacuation simulation model. This paper proposes a new validation method based on dynamic time warping and multidimensional scaling. The proposed method validates the dynamic process of a simulation model, provides statistical results, and can be used for small-sample scenarios such as a train evacuation scenario. The results of a case study indicate that the proposed method is an effective and quantitative approach to the validation of simulation models in a dynamic process. Thus, this paper describes the influence of the train struc-ture size on an evacuation based on the results of simulation experiments. The structural size factors include the door width, aisle width, and seat pitch. The experiment results indicate that a wide aisle and reasonable seat pitch can promote a proper evacuation. In addition, a normal train door width has no effect on an evacuation.
Keywords: Simulation, Passenger train evacuation, Structural size, Validation
© The Author(s) 2019. This article is distributed under the terms of the Creative Commons Attribution 4.0 International License (http://creat iveco mmons .org/licen ses/by/4.0/), which permits unrestricted use, distribution, and reproduction in any medium, provided you give appropriate credit to the original author(s) and the source, provide a link to the Creative Commons license, and indicate if changes were made.
1 Introduction
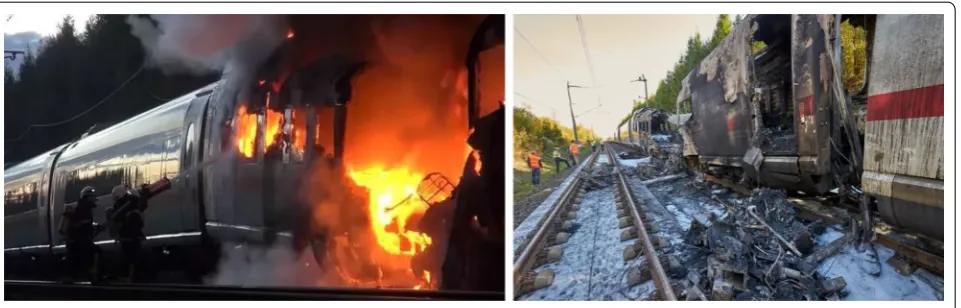
Railway trains are a mode of transportation that pro-vide flexibility, convenience, and fast, safe, reliable, and comfortable features. Railway train systems have been vigorously developed in recent years. However, railway disasters occur frequently, causing significant casualties, economic losses, and social impact. On October 12, 2018, a high-speed ICE train caught fire on its journey between Frankfurt and Cologne, Germany (Figure 1), causing no injuries but leading to delays along the well-traveled route. The train was halted, and emergency crews evacu-ated all 510 people on board. Disasters can be caused by either natural or man-made factors [1], and they include natural disasters, vehicle failures, operational errors, ter-rorist attacks, and other factors. Hence, issues regarding passenger evacuation have received increasing attention.
Because the evacuation capability of a train is vital to the passengers on board, the structural design of a train
car must take such a factor into account [2]. This paper studies the effects of the door width, aisle width, and seat pitch on a train evacuation. Some studies have been con-ducted on the influence of the structural size on the evac-uation time in other fields. Wide doors can clearly reduce the evacuation time in building evacuations [3]. McLean and Corbett pointed out that the aisle width has a small but significant impact on airplane evacuations [4]. Nev-ertheless, McLean and Chittum reported that the aisle width does not affect the flowrate [5]. In addition, the seat pitch has a significant influence on the evacuation time [6]. Because the interior structures of high-speed trains are quite different from those of buildings and air-planes, their results may be unsuitable for high-speed trains.
There are two main research methods for passenger evacuations: real evacuation experiments and simula-tion experiments [7]. A real experiment recreates the evacuation process under different conditions. How-ever, such experiments are extremely costly and harmful to the subjects [8]. Moreover, this method is for a post-design evacuation and is not applicable as an ongoing-design assessment. Therefore, researchers and ongoing-designers
Open Access
*Correspondence: [email protected]
1 State Key Lab of Rail Traffic Control & Safety, Beijing Jiaotong University, Beijing 100044, China
prefer to use simulation experiments. Such experiments are economical and practical if the simulation model is realistic and accurate in comparison with the actual situ-ation. There are numerous commercial software pro-grams available for simulating an evacuation, including EXODUS, LEGION, PATHFINDER, and MassMotion. However, such programs are designed for building evacu-ations. Few simulation models for railways have been considered. In general, a simulation model is valid only for its specific application [9]. Additionally, it is impos-sible to achieve a universal validation owing to a lack of sufficient observational data [10]. Hence, it is neces-sary to validate the simulation models used for a railway system.
There are mainly two methods for validation, namely, a t-test and a graphical comparison [11]. A t-test is mainly used on static indicators. Zhang et al. [12] used a t-test to compare the total time for the model validation in the simulation of alighting and boarding behaviors in metro stations. However, a t-test alone cannot meet the validation requirements for a dynamic process. A visual graphical comparison technique is the most commonly used approach for a validation of simulation models for a dynamic process [13]. The basic validations of many commercial simulation software programs, such as EXO-DUS [14, 15], LEGION [16], PATHFINDER [17], and MassMotion [18] all use graphical comparisons. A large number of scholars have also used graphical comparisons to validate their simulation models. Chen et al. compared the evacuation behaviors at a T-shaped intersection between a simulation and experiment using the evacua-tion time series of a pedestrians graph [19]. Zhou et al. [20] compared three evacuation time series to validate their model. Nagai et al. [21] used graphical comparisons to show that the experimental results are consistent with the simulation results. Although this technique is valu-able, it is essentially qualitative [22] and inadequate for
validation [23]. Other methods have also been used by a few scholars. Woensel and Vandaele used Theil’s inequal-ity coefficient as an evaluation criterion to compare the speeds between the simulation model and reality [24]. However, this coefficient can only be applied to time series of equal length, which rarely occurs during a pas-senger train evacuation.
A passenger evacuation is a complex and dynamic pro-cess. Many factors such as human behavior and train design factors affect the evacuation time [14]. It is insuf-ficient to validate the entire simulation process using only static indicators. Therefore, a comparison between two time series of the dynamic process is usually conducted. However, a graphical comparison is frequently subjec-tive. In addition, only two samples are compared, mak-ing it easy for large errors to be produced. An objective comparison between several time series is a problem fre-quently faced by engineers and scientists [25].
Unlike other simulation processes, a passenger evacua-tion usually differs in terms of the time series length. The escape time for each passenger is random. This leads to different evacuation times under exactly the same condi-tions. Owing to the different time series lengths, the dif-ficulty in their quantitative comparison is increased.
was determined. In addition, single-factor experiments have been designed to study their effects on a train evacuation.
The remainder of the paper is organized as follows. Section 2 describes the new validation method and pro-vides a case study and comparison between the new vali-dation method and other approaches. Section 3 provides an experimental design of the influence of three struc-tural train size factors on an evacuation. The results and a discussion are provided in Sections 4 and 5, respectively. Finally, Section 6 gives some concluding remarks regard-ing this research.
2 Preliminary
As previously shown, most validation methods rely on a visual comparison and a subjective evaluation [26]. This section presents a quantitative method for validation. Unlike many other methods that only compare two time series for validation, the proposed method compares numerous time series generated using a simulation model with one or more time series from reality. Because ran-dom errors exist in both the simulation model and reality, the validation results from comparing two time series are not credible, and thus a series of successful simulations can be applied to increase the credibility [27]. Moreover, this method can process time series of different lengths, which is suitable for train evacuation scenarios.
2.1 Method Outline
To compare multiple time series, we first need to solve the problem of their different lengths. In this section, we use dynamic time warping to transform two time series with different lengths into a similarity. Then, to reduce the dimensions of the similarity, we use multidimensional scaling. Finally, we use a Hotelling’s One Sample T2 Test to check if there is a difference in the position of the sam-ples at a low dimension.
The proposed method for a validation of the time series applies the following three steps.
(1) Input all time series from the simulation based on a time series from reality. Calculate the distance matrix D through dynamic time warping (DTW). (2) Use multidimensional scaling (MDS) to reduce the
dimensions of distance matrix D and determine the position of the samples in the lower dimensions. (3) Propose a hypothesis that there is no difference
between the simulation and actual results. Use a Hotelling’s One Sample T2 Test for testing.
The details of this method are described below.
2.2 Dynamic Time Warping
Dynamic time warping (DTW) is a widely used algo-rithm for measuring the similarity between two time series datasets. Its applications include speech recogni-tion, signature verification [28], shape matching, vocali-zation classification [29], and other time series analyses [30, 31]. As an advantage of DTW, it can compare time series sets of varying length. As the case often rises in simulations, DTW is also suitable for comparing the dynamic processes in simulations.
Given two time series datasets R = r1, r2,…, rm and
S = s1, s2,…, sn, the lengths of R and S may differ. To measure the similarity between R and S, DTW first constructs an m×n similarity matrix D between points
ri and sj using a cost function. The most commonly used cost function is Euclidean distance. Therefore, the ele-ment of the similarity matrix, D, also called a distance matrix, is d(ri, sj)=(risj)2.
Because DTW assumes that time is continuous and monotonous, the minimum cost path can be calculated from the start point (1, 1) to the end point (m, n) in D
without violating this assumption. In addition, the cost of the path divided by the path length can be used as the similarity between R and S.
Let us define wk=(i, j)k; the problem then becomes the calculation of path W = w1, w2,…, wK; max(m,
n) ≤K ≤m + n − 1. Its objective function is
In addition, it is subject to
Dynamic programming is used to solve this short path problem. Let us define γ(i, j) as the minimum distance from (1, 1) to (i, j); the recursions of the problem are then
Therefore, the similarity between R and S is
simRS=(γ(m, n))/K. Clearly, its range is [0, +∞]. The closer simRS is to zero, the higher the similarity between
R and S. However, the DTW distance is not a metric because it does not fully satisfy the triangle inequal-ity. In fact, it is a loose metric of high dimensions [32]. Hence, the following steps are needed for a dimensional reduction.
(1)
min K
κ=1
wκ/K,
(2)
w1=(1, 1),
wK =(m,n),
0≤rκ−rκ−1≤1,
0≤sκ−sκ−1≤1.
(3)
γi,j=dri,sj
+minγi−1,j−1,
γi−1,j
The above method is used to calculate the similarity between two time series datasets. In the validation of a simulation model, there are many time series datasets from the simulation and at least one practical time series dataset. We merge them and calculate the similarity matrix SIM =(simij) between them.
2.3 Multidimensional Scaling
Multidimensional scaling (MDS) is a multivariate data analysis method that expresses the similarity or affin-ity between objects in the form of a spatial distribution. It belongs to a taxonomy because it is used in geochro-nology [33], graph-based pattern recognition [34], time series classification [35], and genetics [36]. Unlike other dimensional reduction methods that require raw data, MDS only needs a similarity matrix SIM, which can be provided by the first step.
The previous similarity matrix SIM can be used to con-struct a matrix A=
aij
=−1/2∗sim2ij
. Let B=
bij and set bij=aij−ai.−a.j−a.. . Find the eigenvalues of matrix 1≥2≥ · · · ≥p . If there is no negative eigen-value, it indicates that B ≥ 0, and therefore SIM is a simi-larity matrix. Otherwise, SIM is not a similarity matrix. Let
These two quantities correspond to the cumulative contribution rate in a principal component analysis (PCA). We hope that the value of k is not too large and that a1,k and a2,k are large. Usually, k =1, 2, or 3. When
k is taken, use x(ˆ1),x(ˆ2),. . .,x(ˆp) to denote the orthogonal-ized eigenvector of B corresponding to its eigenvalues λ1,
λ2,…, λp. Ensure that xˆ′(i)xˆ(i)=i, i=1, 2,. . .,k . Usu-ally the eigenvalue λk should greater than zero. If λk is less than zero, the value of k should be reduced.
Let Xˆ = ˆx(1),xˆ(2),. . .,xˆ(k), and the row vector
x1,x2,. . .,xN,xN+1 of Xˆ is then the classical solution.
Here, N is the number of time series datasets from the simulation. After using MDS, N simulation results and one sample from reality are placed in a k-dimensional space with their DTW distances preserved as well as pos-sible. Hence, the statistical method can be used to test the validation of the simulation results. This will be shown in the next step.
2.4 Hotelling’s One Sample T2 Test
After a dimensional reduction, the simulation samples become X=(x1,x2,. . .,xN)′ , and the actual sample becomes μ0= x(N+1). Let μ be the mean vector of X. The following assumptions will be then tested.
(4)
a1,k =
k
i=1i
p
i=1|i|
, a2,k =
k
i=12i
p
i=12i .
Because the covariance matrix ∑ is unknown, and its unbiased estimator is S= N−11N
i=1(Xi−µ)(Xi−µ)′ , the multivariate square statistic is
The Hotelling statistic T2 follows the T2 distribution with parameters p, N−1, that is T2∼T2
p,N−1 . From the relationship between the Hotelling distribution and the
F-distribution, we know that, when the original hypoth-esis H0 is true, we have
Using the F-distribution, the rejection domain of the original hypothesis is
In this way, the believability of the simulation system can be verified.
2.5 Case Study: Passenger Train Evacuation Simulation and Validation
This section presents a case study using the proposed method to verify the validation of the Legion simulation model. Legion is a commercial simulation software pack-age, and its core is the microscopic pedestrian interac-tion model [37]. It has been used in a wide range of large buildings such as metro stations [38], train stations, and stadiums [37]. This section describes the validation of Legion in the dynamic process of a train evacuation. At the same time, a subjective evaluation and t-test are used to verify the effectiveness of the proposed method.
2.5.1 Basic Simulation Model
The basic simulation model is a mobile cellular automata (MCA) [16]. The simulation space is divided into lattice cells 10 cm wide. A person is represented by a 3 by 3 grid (30 cm2). A grid can only be occupied by one person at a time, and a person can only move to adjacent cells at a time. A simulated annealing algorithm is used to calcu-late the paths of the people toward their destinations. As the constraints, people do not collide with other people or objects. The goal is to minimize personal effort, which includes inconvenience, frustration, and discomfort. The flow of the simulation model is as follows.
Step 1: Initialization scenario.
Step 2: Generate passengers and their targets. Set
t =0.
Step 3: Generate paths of passengers randomly.
(5)
H0:µ=µ0, H1:µ�=µ0,
(6)
T2=N(µ−µ0)′S−1(µ−µ0).
(7)
F = N−p
(N−1)pT 2
∼F(p,N−p).
(8)
N−p (N−1)pT
2
>Fα(p,N−p)
Step 4: Check whether passengers collide with oth-ers or things. If so, go to Step 3. Otherwise, go to the next step.
Step 5: Calculate the overall effort and its reduction. Step 6: Check whether the reduction is up to the standard. If so, go to Step 3. Otherwise, go to the next step.
Step 7: Passengers move in a time step according to their paths. Set t = t+ 1.
Step 8: Check whether all passengers reach their tar-gets. If not, go to Step 3. Otherwise, end the simula-tion.
2.5.2 Passenger Train Evacuation Experiment
The real sample of a passenger train evacuation was derived from 12 experiment trials conducted by the Volpe Center in 2005 [14, 39]. A series of trials was con-ducted at North Station, Boston, MA with the coopera-tion of the Massachusetts Bay Transportacoopera-tion Authority (MBTA). Because the conditions of the 12 experimental trials differ, this paper only uses one for validation of the Legion model. This trial is the trial four, in which pas-sengers are egressed from the car to the high platform through two side doors under normal lighting.
The MBTA provides two single-level “MBB” com-muter rail cars for the trials, and only the “CTC-3” car was used in trial four. A single group of 84 individuals, 40 males and 44 females, participated in the egress trial. The speeds for the males and females are shown in Table 1.
2.5.3 Simulation
This study established a simulation car model according to the real size of the “CTC-3” car, as shown in Figure 2.
As with trial four, the numbers of male and female pas-sengers were 40 and 44, respectively. Because there is no specific velocity distribution in the egress trial, this study uses a uniform distribution to express the passenger
speed. Hence, the male speed distribution is U(1.2, 2), and the female speed distribution is U(1, 1.8). The simu-lation model was run 25 times.
2.5.4 Analysis of Exit Passenger Flow
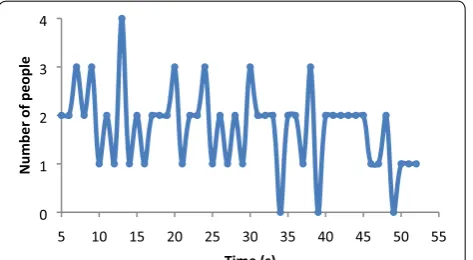
One of the purposes of the egress trails is to study those factors affecting passengers evacuation. The trial organiz-ers use a mean passenger flow rate at the side doors as an indicator. However, because the evacuation is a dynamic process, the flow rate changes over time. A mean value will lose a lot of information during this process. Hence, this paper uses a flow rate time series dataset as the indi-cator. The flow rate time series dataset of the reality sam-ple is shown in Figure 3.
Using the DTW algorithm described in Section 2.2, we obtain the similarity matrix SIM of the flow rates from all samples.
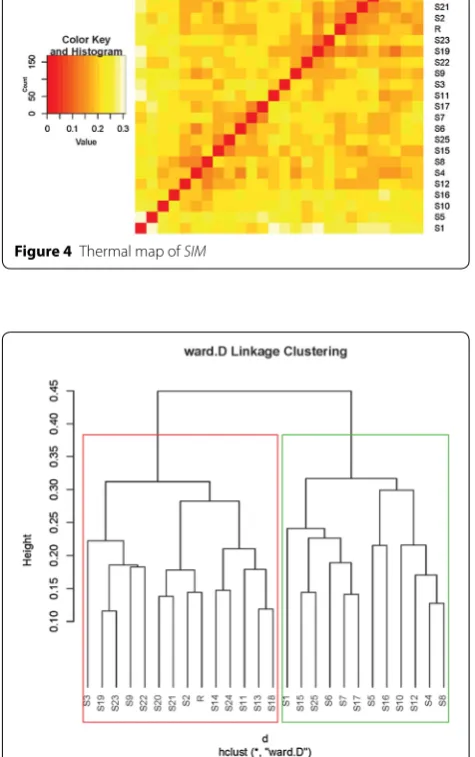
Figure 4 shows a corresponding thermal map of SIM. It can be seen from Figure 4 that there is no significant dif-ference between samples. The real data from these sam-ples cannot be subjectively determined. Figure 5 shows a clustering result obtained by the ward.D linkage method. The samples are divided into two groups. From the clus-tering result, it is impossible to distinguish the real sam-ple from the simulation samsam-ples. From a Turing test point of view, the simulation dataset can be considered as a real dataset.
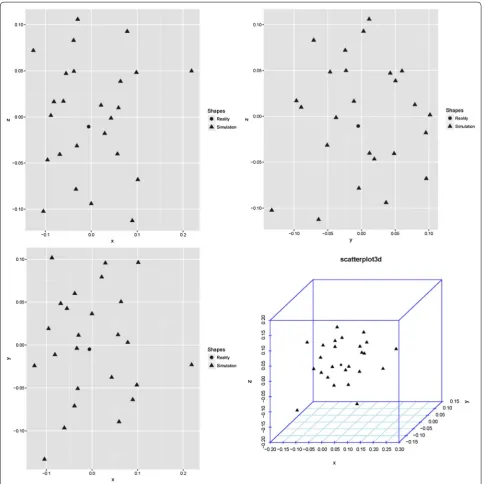
Next, MDS is used for a dimensional reduction. In this study, k =3 was set to maintain more information.
Table 1 Minimum and maximum free walking travel speeds during egress trials (m/s)
Gender Average speed Min speed Max speed
Male 1.52 1.22 1.98
Female 1.31 1.01 1.77
Figure 2 Simulation model of MBB CTC-3 car
0 1 2 3 4
5 10 15 20 25 30 35 40 45 50 55
Number of people
Figure 6 shows the results after MDS is applied. The circle represents the real flow rate, and the triangles represent the simulation flow rate after a dimensional reduction. As indicated by the three-view map and the three-dimen-sional map, the real flow rate is almost at the center of the simulation flow rate, and the simulation flow rates are evenly distributed around the real flow rate. Subjectively, there is no difference between the simulation samples and the real sample.
The result of Hotelling’s one sample T2 test shows that the simulation samples
M=
0.233×10⁻³, 0.195× 10⁻³, 0.423×10⁻³
,SD=(0.083, 0.064, 0.062)
do not differ significantly with the real sample, T2(3, 22)=0.309,
p = 0.819. p > 0.05, indicating that there is insufficient
statistical evidence to show that the simulation model is not credible. The result indicates that there is an 81.9% level of confidence that the simulation model does not differ from reality.
2.5.5 Comparison
To verify the effectiveness of the proposed method, this paper compares the result with the results of the t-test and a graphical comparison, of which four indicators are used, namely, the first passenger’s evacuation time, the total evacuation time, the passenger flow at the exit, and the evacuation curve [2].
Single sample t-tests were conducted on the logarithm of the first three indicators. The results of the t-tests on the three indicators are shown in Table 2. All p values in Table 2 are greater than 0.05. This means there is no sig-nificant difference between the real evacuation and the simulation evacuations. The results are the same as those of the proposed method.
Figure 7 shows the passenger evacuation curve, which is the number of passengers evacuated from the vehicles over time. As can be seen from the figure, the simulated evacuation curve is consistent with the real evacuation curve.
It can be seen from the results that there is no signifi-cant difference between the simulation results and the actual result for the three static indicators. Furthermore, the evacuation curves between the two have a high con-sistency. The evacuation simulation is credible in a train environment. This result is consistent with the results of the proposed method. Therefore, the method presented in this paper is effective.
3 Method
Because a train evacuation is a complex process, many factors affect it. The setting of the initial scene has a sig-nificant impact on passenger evacuation [40]. To carry out our research, we first need to determine the setting of the control variables and the effective interval of inde-pendent variables. The indeinde-pendent variables are the spa-tial factors, and the control variables mainly include the evacuation scenes and passenger attributes.
3.1 Evacuation Scenarios and Passenger Properties This study applied a CRH5 second-class car (see Fig-ure 8) as the evacuation compartment. Two platform side doors were fully open for passengers to evacuate to the platform.
The number of passengers is the maximum carry-ing capacity of the train. In other words, the passenger density is four persons per square meter in free space minus the seats [41]. Hence, a total of 130 passengers are in the coach.
Figure 4 Thermal map of SIM
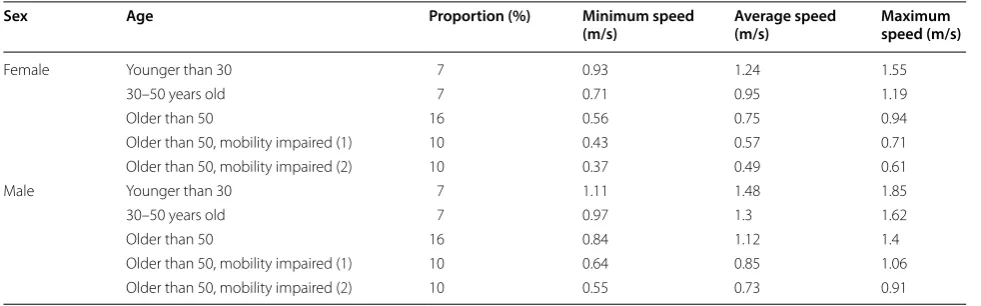
Table 3 shows the passenger age distribution and speed statistics applied in the experiment [42]. The speed of each type of passenger has a uniform distri-bution according to Table 3. The choice of evacuation route is based on the principle of proximity.
3.2 Independent and Dependent Variables
The dependent variable is the total evacuation time.
The independent variables are three size parame-ters of the passenger train structure. The three spatial parameters studied in this paper are the aisle width, door width, and seat pitch.
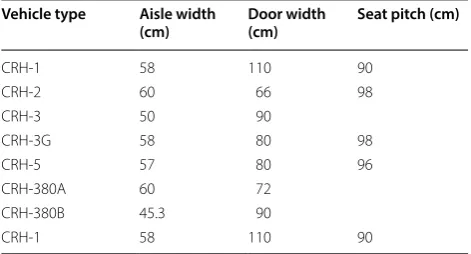
Table 4 shows the spatial parameters of major high-speed second-class vehicle trains in China [43–45]. They determine the ranges of the three spatial parameters together with some ergonomic parameters.
The minimum aisle width is 45 cm, as shown in Table 4. For two persons passing through face to face, the mini-mum aisle width is 76 cm [46]. Table 4 shows that the minimum and maximum door widths are 66 and 110 cm, respectively. The minimum seat pitch is 90 cm, as shown in Table 4. The maximum seat pitch can reach 101 cm [47].
In conclusion, the minimum reasonable interval of the aisle is [45, 76 cm]. The interval of the door width is [66, 110 cm]. In addition, the maximum reasonable interval of the seat pitch is [90, 101 cm].
Table 2 Results of t-tests on three indicators
Note: a) The first passenger’s evacuation time, b) the total evacuation time, and c) the passenger flow Logarithmic value
of reality Mean logarithmic value of simulation Standard deviation Df t p
a) Left door 0.778 0.763 0.067 24 − 1.156 0.259
a) Right door 0.778 0.778 0.058 24 0.433 0.669
b) Left door 1.690 1.686 0.015 24 −1.264 0.219
b) Right door 1.653 1.657 0.019 24 1.007 0.324
c) Left door − 0.056 − 0.052 0.018 24 0.606 0.550
c) Right door − 0.041 − 0.044 0.019 24 − 0.866 0.395
0 25 50 75 100
0 10 20 30 40 50 60
Real Evacuation Simulation Evacuation
The number of people evacuated
(person
)
Time (s)
Figure 7 Comparison between real and simulation evacuations
Figure 8 CRH5 second-class car simulation model
Table 3 Passenger age-speed distribution table
Sex Age Proportion (%) Minimum speed
(m/s) Average speed (m/s) Maximum speed (m/s)
Female Younger than 30 7 0.93 1.24 1.55
30–50 years old 7 0.71 0.95 1.19
Older than 50 16 0.56 0.75 0.94
Older than 50, mobility impaired (1) 10 0.43 0.57 0.71
Older than 50, mobility impaired (2) 10 0.37 0.49 0.61
Male Younger than 30 7 1.11 1.48 1.85
30–50 years old 7 0.97 1.3 1.62
Older than 50 16 0.84 1.12 1.4
Older than 50, mobility impaired (1) 10 0.64 0.85 1.06
3.3 Design Experiment
Based on the above range of values, the experimental lev-els of the three parameters are determined in Table 5. To create an arithmetic progression, some of the scope has been slightly altered without affecting the outcomes of this research.
In the corresponding model built for the simulation, the value of a single parameter changed while the other factors remain unchanged. The simulation was run 20 times for each spatial parameter at each level.
3.4 Data Analysis
To study the main effects of the various factors, an anal-ysis of the variance was conducted. A curve fitting was applied to observe the influencing trend of various fac-tors on the evacuation. The significance was determined based on a 0.05 level.
4 Results
4.1 Results of Aisle Width
Table 6 shows the ANOVA results of the aisle width on the evacuation time. The overall score of F(5,114) = 13.67 is significant (p= 1.87 × 10⁻¹⁰ < 0.05), indicating signifi-cant differences between the six levels.
A curve fitting method was used to establish a math-ematical relationship between the aisle width and evac-uation time. By observing the scatter plot, a quadratic function was used to fit the curve. The regression equa-tion and the fitting curve are shown in Figure 9.
The regression equation is y =0.009x2− 1.63x + 174.65. A regression analysis was carried out on the fitting curve. The overall score of F(2, 3) = 30.76 is sig-nificant (p = 0.01 < 0.05). In addition, R2= 0.95 indicates that the fitting equation has a high degree of fit and can be used to explain the effect of the aisle width on the evacuation time.
4.2 Results of Door Width
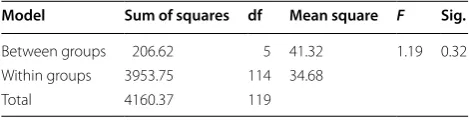
Figure 10 shows the experiment results with the confi-dence interval. Table 7 shows the ANOVA results of the door width on the evacuation time. The overall score of F(5,114) = 1.19 is insignificant (p = 0.32 > 0.05). This shows that there is no statistically significant difference between the six levels. Therefore, a curve fitting is not conducted.
4.3 Results of Seat Pitch
Table 8 shows the ANOVA results of the seat pitch on the evacuation time. The overall score of F(5,114) = 2.33 Table 4 Main high-speed second-class space parameters
of trains in China
Vehicle type Aisle width
(cm) Door width (cm) Seat pitch (cm)
CRH-1 58 110 90
CRH-2 60 66 98
CRH-3 50 90
CRH-3G 58 80 98
CRH-5 57 80 96
CRH-380A 60 72
CRH-380B 45.3 90
CRH-1 58 110 90
Table 5 Six levels of the three spatial parameters
Spatial parameter 1 2 3 4 5 6
Aisle width (cm) 45 52 59 66 73 80
Door width (cm) 65 74 83 92 101 110
Seat pitch (cm) 90 92 94 96 98 100
Table 6 Variance analysis results of aisle width
Model Sum
of squares df Mean square F Sig.
Between
groups 4174.44 5 834.89 13.67 1.87×10
−10
Within groups 6960.31 114 61.06
Total 11134.75 119
102.0 104.0 106.0 108.0 110.0 112.0 114.0 116.0 118.0 120.0 122.0
45 50 55 60 65 70 75 80
Evacuation time (s
)
Aisle width (cm)
is significant (p = 0.047 < 0.05), indicating that there are significant differences between the six levels.
By observing their scatter plot, a quadratic function is used to fit the curve. The regression equation and the fit-ting curve are shown in Figure 11.
The regression equation is y =− 0.165x2+ 30.965x − 1 339.3. A regression analysis is carried out on the fitting
curve. The overall score of F(2,3) = 21.08 is significant (p = 0.017 < 0.05). In addition, R2= 0.93 indicates that the fitting equation has a high degree of fit and can be used to explain the effect of the seat pitch on the evacuation time.
5 Discussion
5.1 Effects of Aisle Width
The above results show that the change in aisle width has a significant impact on the evacuation time. The fit-ting curve in Figure 9 shows that the evacuation time decreases as the aisle width increases. At the end of the curve, the reduction rate of the evacuation time also decreases. This result is similar to the results of the build-ing evacuation [19, 48].
5.2 Effects of Door Width
It can be seen from the above experiments that the door width within the interval [65, 110] has no effect on the evacuation time. This conclusion differs from general experience and the research results from other fields.
It is generally believed that the door width affects the crowd evacuation. Research on ships [49] and pub-lic buildings [50] has shown that the evacuation time decreases as the door width increases. However, the reduction rate of the evacuation time exponentially decreases as the door width increases [51, 52].
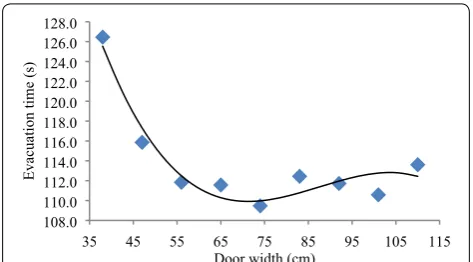
To test whether this fact also occurs in the train evacu-ation, this study added three levels of testing based on the above experiments. The three levels of door width are 38, 47, and 56 cm, respectively. All other experiment condi-tions are the same as before. The new experiment results are as follows.
Table 9 shows the new ANOVA results of the door width on the evacuation time. The overall score of
F(8,171)=12.46 is significant (p=5.21×10⁻¹⁴ <0.05). This indicates that there are significant differences between the nine levels.
By observing their scatter plot, a cubic function is used to fit the curve. The regression equation and the fitting curve are shown in Figure 12.
106.0 108.0 110.0 112.0 114.0 116.0 118.0
65 74 83 92 101 110
Evacuation time (s
)
Door width (cm)
Figure 10 Histogram of evacuation time at different door width levels with confidence interval
Table 7 Variance analysis results of door width
Model Sum of squares df Mean square F Sig.
Between groups 206.62 5 41.32 1.19 0.32
Within groups 3953.75 114 34.68
Total 4160.37 119
Table 8 Variance analysis results of seat pitch
Model Sum of squares df Mean square F Sig.
Between groups 517.61 5 103.52 2.33 0.047
Within groups 5058.68 114 44.37
Total 5576.29 119
109.0 110.0 111.0 112.0 113.0 114.0 115.0 116.0 117.0
88 90 92 94 96 98 100 102
Evacuation time (s
)
Seat pitch (cm)
Figure 11 Fitting curve of evacuation time and seat pitch
Table 9 Variance analysis results of door width (2)
Model Sum
of squares df Mean square F Sig.
Between
groups 4167.23 8 520.90 12.46 5.21×10
−14
Within groups 7147.8 171 41.80
The regression equation is y =−0.0002x3 + 0.045x2 − 3.816x+ 214.77. A regression analysis is carried out on the fitting curve. The overall score of F(3,5)=23.133 is significant (p =0.002 < 0.05). Here, R2=0.93 indicates that the fitting equation has a high degree of fit and can be used to explain the effect of the door width on the evacuation time.
It can be seen from the above results that the functions of the evacuation time and the door width have a roughly L-shaped curve. This result is consistent with experi-ence and other research results. When the door width of the second-class CRH5 car exceeds 56 cm, the increase in door width cannot effectively reduce the evacuation time. This threshold is much smaller than that of ships and buildings but close to that of aircraft [3, 6, 53]. This is because the aisles of trains and airplanes are narrow and long, and passengers are more likely to be crowded in the aisles and seats. Therefore, if the door width is within a reasonable range, the door will not experience conges-tion during a train evacuaconges-tion.
5.3 Effects of Seat Pitch
The change in seat pitch has a significant impact on the evacuation time. The fitting curve in Figure 11 indicates that the evacuation time will increase at the beginning of the increase in seat pitch, and later decreases rapidly. Similar studies have been conducted in the aviation field. However, the seat pitch in the aircraft is less than 90 cm [10]. Because of the different ranges of seat pitch, it is dif-ficult to draw any conclusions.
Because there is insufficient space for direct competi-tion, the evacuation time increases initially. However, as the seat pitch increases, the excess space increases. When the seat pitch is approximately 95 cm, there is space for many people to pass through at the same time. The evacuation time decreases rapidly as the capacity of the seat pitch increases and the passengers become orderly. Therefore, the seat pitch should provide a reasonable
space to allow passengers to walk steadily toward the aisle without providing extra space to allow for direct competition.
6 Conclusions
This study analyzed a train vehicle structure design from the perspective of an evacuation. First, a new validation method was proposed and applied to validate the simu-lation model in a passenger train evacuation. Second, a simulation method was used to analyze the influence of the three structural size factors of a train, namely, the door width, aisle width, and seat pitch, on the evacuation time.
The new validation method begins by constructing a similarity matrix using the DTW. Then, the time series is converted into points in a two- or three-dimensional space using a similarity matrix with MDS. Finally, a Hotelling’s one sample T2 Test is conducted on the points representing the simulation process. In a case study, a simulation model of a passenger train evacuation experi-ment was built using the Legion model. The results indicate that the simulation model has a high degree of credibility. The t-test and graphical comparison results were compared with these results, which show a level of consistency, indicating the effectiveness of the proposed method.
Three single-factor experiments were designed to study the effects of the three factors on the evacuation time. The simulation model was applied as the experiment environment. The results indicate that, within the inter-val of [45, 80] cm, the wider the aisle is, the shorter the evacuation time. When the door width is within a reason-able range, that is, within the [65, 110] cm interval, there is no influence on the evacuation time. However, if the door width is less than approximately 56 cm, the evacu-ation time will increase rapidly. Approximately 95 cm of seat spacing will cause direct competition among the passengers, thereby reducing the evacuation efficiency. Therefore, the design of the seat pitch within the range of [90, 100 cm] should not result in passenger competition. Authors’ Contributions
WF was in charge of the whole trial; HQ wrote the manuscript; HQ assisted with sampling and laboratory analyses. Both authors read and approved the final manuscript.
Authors’ Information
Hanzhao Qiu, born in 1991, is currently a PhD candidate at State Key Lab of Rail Traffic Control & Safety, Beijing Jiaotong University, China. He received his master degree from Beijing Jiaotong University, China, in 2015. His research interests include man-machine system and human factors.
Weining Fang, born in 1968, is currently a professor at State Key Lab of Rail Traffic Control & Safety, Beijing Jiaotong University, China. He received his Ph.D. 108.0
110.0 112.0 114.0 116.0 118.0 120.0 122.0 124.0 126.0 128.0
35 45 55 65 75 85 95 105 115
Evacuation time (s
)
Door width (cm)
degree from Chongqing University, China, in 1996. His research interests include human factors, ergonomics and industrial design.
Competing Interests
The authors declare that they have no competing interests.
Funding
Supported by State Key Laboratory Foundation of China (Grant No. RCS2018ZT009).
Author Details
1 State Key Lab of Rail Traffic Control & Safety, Beijing Jiaotong University, Bei-jing 100044, China. 2 School of Mechanical, Electronic and Control Engineer-ing, Beijing Jiaotong University, Beijing 100044, China.
Received: 12 November 2018 Revised: 16 June 2019 Accepted: 12 Octo-ber 2019
References
[1] A Leiba, D Schwartz, T Eran, et al. DISASTCIR: Disastrous incidents system-atic analysis through components, interactions and results: Application to a large-scale train accident. The Journal of Emergency Medicine, 2009, 37: 46-50.
[2] E R Galea, S Gwynne. Estimating the flow rate capacity of an overturned rail carriage end exit in the presence of smoke. Fire and Materials, 2000, 24: 291-302.
[3] J Izquierdo, I Montalvo, R Pérez, et al. Forecasting pedestrian evacuation times by using swarm intelligence. Physica A: Statistical Mechanics and Its Applications, 2009, 388: 1213-1220.
[4] G A McLean, C L Corbett. Access-To-Egress III: repeated measurement of factors that control the emergency evacuation of passengers through the transport airplane type-III overwing exit. Federal Aviation Administration Oklahoma City OK Civil Aeromedical Inst., 2004.
[5] G A McLean, M E Wayda. Access-to-egress: A meta-analysis of the factors that control emergency evacuation through the transport airplane type-III overwing exit. US Department of Transportation, Federal Aviation Admin-istration, Office of Aviation Medicine, 2001.
[6] H C Muir, D M Bottomley, C Marrison. Effects of motivation and cabin configuration on emergency aircraft evacuation behavior and rates of egress. The International Journal of Aviation Psychology, 1996, 6: 57-77. [7] H Liu, B Liu, H Zhang, et al. Crowd evacuation simulation approach based
on navigation knowledge and two-layer control mechanism. Information Sciences, 2018, 436: 247-267.
[8] K Dopart. Aircraft evacuation testing: Research and technology issues. Office of Technology Assessment Congress of the United States, 1993. [9] S Robinson. General concepts of quality for discreteevent simulation.
European Journal of Operational Research, 2002, 138: 103-117.
[10] H Christopher Frey, S R Patil. Identification and review of sensitivity analy-sis methods. Risk Analyanaly-sis, 2002, 22: 553-578.
[11] J P C Kleijnen. Verification and validation of simulation models. European Journal of Operational Research, 1995, 82: 145-162.
[12] Q Zhang, B Han, D Li. Modeling and simulation of passenger alight-ing and boardalight-ing movement in Beijalight-ing metro stations. Transportation Research Part C: Emerging Technologies, 2008, 16: 635-649.
[13] R G Sargent. Verification and validation of simulation models. Journal of Simulation, 2013, 7: 12-24.
[14] E R Galea, D Blackshields, K M Finney, et al. Passenger train emergency systems: development of prototype railEXODUS software for US passenger rail car egress. United States. Federal Railroad Administration. Office of Research and Development, 2014.
[15] E R Galea. A general approach to validating evacuation models with an application to EXODUS. Journal of Fire Sciences, 1998, 16: 414-436. [16] G K Still. Crowd dynamics. University of Warwick, 2000.
[17] T Engineering. Verification and Validation: Pathfinder 2012.1. Thunderhead Engineering Consultants.
[18] B Anvari, C K Nip, A Majumdar. Toward an accurate microscopic passenger train evacuation model using MassMotion. 2017.
[19] C K Chen, J Li, D Zhang. Study on evacuation behaviors at a T-shaped intersection by a forcedriving cellular automata model. Physica A: Statisti-cal Mechanics and Its Applications, 2012, 391: 2408-2420.
[20] M Zhou, H Dong, F Y Wang, et al. Modeling and simulation of pedestrian dynamical behavior based on a fuzzy logic approach. Information Sci-ences, 2016, 360: 112-130.
[21] R Nagai, M Fukamachi, T Nagatani. Evacuation of crawlers and walkers from corridor through an exit. Physica A: Statistical Mechanics and its Applications, 2006, 367: 449-460.
[22] W L Oberkampf, M F Barone. Measures of agreement between computa-tion and experiment: validacomputa-tion metrics. Journal of Computacomputa-tional Physics, 2006, 217: 5-36.
[23] J R Grace, F Taghipour. Verification and validation of CFD models and dynamic similarity for fluidized beds. Powder Technology, 2004, 139: 99-110.
[24] T Van Woensel, N Vandaele. Empirical validation of a queueing approach to uninterrupted traffic flows. 4OR, 2006, 4: 59-72.
[25] C J Kat, P S Els. Validation metric based on relative error. Mathematical and Computer Modelling of Dynamical Systems, 2012, 18: 487-520.
[26] E Kutluay, H Winner. Validation of vehicle dynamics simulation models–a review. Vehicle System Dynamics, 2014, 52: 186-200.
[27] T G Nguyen, J L de Kok, M J Titus. A new approach to testing an inte-grated water systems model using qualitative scenarios. Environmental Modelling & Software, 2007, 22: 1557-1571.
[28] A Efrat, Q Fan, S Venkatasubramanian. Curve matching, time warping, and light fields: New algorithms for computing similarity between curves. Journal of Mathematical Imaging and Vision, 2007, 27: 203-216. [29] J C Brown, A Hodgins-Davis, P J O Miller. Classification of vocalizations of
killer whales using dynamic time warping. The Journal of the Acoustical Society of America, 2006, 119: EL34-EL40.
[30] Y Li, Z Wu, H Chen. A grid-based method to represent the covariance structure for earthquake ground motion. Mathematical Problems in Engi-neering, 2012, 2012: 1-13.
[31] M A A Cox. Analysis of stock market indices through multidimensional scaling. Journal of Statistical Computation and Simulation, 2013, 83: 2015-2029.
[32] EV Ruiz, FC Nolla, HR Segovia. Is the DTW “distance” really a metric? An algorithm reducing the number of DTW comparisons in isolated word recognition. Speech Communication. 1985, 4: 333-344
[33] P Vermeesch. Multi-sample comparison of detrital age distributions. Chemical Geology, 2013, 341: 140-146.
[34] J Tang, B Jiang, C C Chang, et al. Graph structure analysis based on com-plex network. Digital Signal Processing, 2012, 22: 713-725.
[35] J Zhao, L Itti. Classifying time series using local descriptors with hybrid sampling. IEEE Transactions on Knowledge and Data Engineering, 2016, 28: 623-637.
[36] Y Wang, J Waters, M L Leung, et al. Clonal evolution in breast cancer revealed by single nucleus genome sequencing. Nature, 2014, 512: 155-160.
[37] J L Berrou, J Beecham, P Quaglia, et al. Calibration and validation of the Legion simulation model using empirical data. Pedestrian and Evacuation Dynamics 2005, Berlin, Heidelberg: Springer, 2007: 167-181.
[38] S Seriani, R Fernandez. Pedestrian traffic management of boarding and alighting in metro stations. Transportation Research Part C: Emerging Technologies, 2015, 53: 76-92.
[39] S H Markos, J K Pollard. Passenger train emergency systems: Single-level commuter rail car egress experiments. U.S. Department of Transportation, 2015.
[40] W Liao, A Tordeux, A Seyfried, et al. Measuring the steady state of pedes-trian flow in bottleneck experiments. Physica A: Statistical Mechanics and Its Applications, 2016, 461: 248-261.
[41] F Kaakai, S Hayat, A El Moudni. A hybrid Petri nets-based simulation model for evaluating the design of railway transit stations. Simulation Modelling Practice and Theory, 2007, 15: 935-969.
[42] L IMO. Interim Guidelines for Evacuation Analyses for New and Existing Pas-senger Ships, 2002. MSC/Circ, 1033.
[43] S G Zhang. CRH1 EMU. Beijing: China Railway Publishing House, 2008. (in Chinese)
[45] S G Zhang. CRH5 EMU. Beijing: China Railway Publishing House, 2008. (in Chinese)
[46] MIL-HDBK-759C. Handbook for human engineering design guidelines. US. Department of Defense, 1991.
[47] UIC 567. General Provisions for Coaches. International Union of Railways, 2004.
[48] S M Lo, Z Fang, P Lin, et al. An evacuation model: the SGEM package. Fire Safety Journal, 2004, 39: 169-190.
[49] H Kim, J H Park, D Lee, et al. Establishing the methodologies for human evacuation simulation in marine accidents. Computers & Industrial Engi-neering, 2004, 46: 725-740.
[50] R Y Guo, H J Huang. A mobile lattice gas model for simulating pedestrian evacuation. Physica A: Statistical Mechanics and its Applications, 2008, 387: 580-586.
[51] W Song, X Xu, B H Wang, et al. Simulation of evacuation processes using a multi-grid model for pedestrian dynamics. Physica A: Statistical Mechanics and Its Applications, 2006, 363: 492-500.
[52] D R Parisi, C O Dorso. Microscopic dynamics of pedestrian evacuation. Physica A: Statistical Mechanics and Its Applications, 2005, 354: 606-618. [53] X Song, L Ma, Y Ma, et al. Selfishness-and selflessness-based models of