www.biogeosciences.net/7/3517/2010/ doi:10.5194/bg-7-3517-2010
© Author(s) 2010. CC Attribution 3.0 License.
Biogeosciences
McGill wetland model: evaluation of a peatland carbon simulator
developed for global assessments
F. St-Hilaire1,2, J. Wu1,2, N. T. Roulet1,2,3, S. Frolking4, P. M. Lafleur5, E. R. Humphreys6, and V. Arora7
1Department of Geography, McGill University, 805 Sherbrooke Street West, Montreal, QC H3A 2K6, Canada 2The Global Environment and Climate Change Centre, McGill University, Montreal, QC, Canada
3McGill School of Environment, McGill University, Montreal, QC, Canada
4Institute for the Study of Earth, Oceans, and Space, University of New Hampshire, Durham, NH 03824, USA 5Department of Geography, Trent University, 1600 Westbank Drive, Peterborough, ON K9J 7B8, Canada
6Department of Geography & Environmental Studies, Carleton University, B349 Loeb Building, 1125 Colonel By Drive,
Ottawa, ON K1S 5B6, Canada
7Canadian Centre for Climate Modelling and Analysis (CCCma), Environment Canada, P.O. Box 1700, STN CSC,
Victoria, BC V8W 2Y2, Canada
Received: 12 February 2008 – Published in Biogeosciences Discuss.: 17 April 2008 Revised: 19 October 2010 – Accepted: 20 October 2010 – Published: 9 November 2010
Abstract. We developed the McGill Wetland Model (MWM) based on the general structure of the Peatland Carbon Simulator (PCARS) and the Canadian Terrestrial Ecosystem Model. Three major changes were made to PCARS: (1) the light use efficiency model of photosynthe-sis was replaced with a biogeochemical description of pho-tosynthesis; (2) the description of autotrophic respiration was changed to be consistent with the formulation of photosyn-thesis; and (3) the cohort, multilayer soil respiration model was changed to a simple one box peat decomposition model divided into an oxic and anoxic zones by an effective water table, and a one-year residence time litter pool. MWM was then evaluated by comparing its output to the estimates of net ecosystem production (NEP), gross primary production (GPP) and ecosystem respiration (ER) from 8 years of con-tinuous measurements at the Mer Bleue peatland, a raised ombrotrophic bog located in southern Ontario, Canada (in-dex of agreement [dimensionless]: NEP = 0.80, GPP = 0.97, ER = 0.97; systematic RMSE [g C m−2d−1]: NEP = 0.12, GPP = 0.07, ER = 0.14; unsystematic RMSE: NEP = 0.15, GPP = 0.27, ER = 0.23). Simulated moss NPP approximates what would be expected for a bog peatland, but shrub NPP appears to be underestimated. Sensitivity analysis revealed that the model output did not change greatly due to variations in water table because of offsetting responses in production
Correspondence to: N. T. Roulet
(nigel.roulet@mcgill.ca)
and respiration, but that even a modest temperature increase could lead to converting the bog from a sink to a source of CO2. General weaknesses and further developments of
MWM are discussed.
1 Introduction
Over the last decade, the carbon (C) cycle in terrestrial and ocean ecosystems has been incorporated into a number of global climate simulations showing general agreement of a positive carbon cycle-climate feedback between the terres-trial biosphere and oceans and the atmosphere, but with large variations in the magnitude of the resulting CO2 increase
surface (Gorham, 1995). There have been recent develop-ments in adapting existing global ecosystem models, such as LPJ, for the inclusion of northern wetlands and permafrost (Wania et al., 2009). These efforts hold promise but incor-porating wetland hydrology and particularly organic soils re-mains a significant challenge (Frolking et al., 2009).
While the present day net primary production (NPP) of northern peatlands may represent <1% of total terrestrial NPP, the amount of organic C stored in peatlands is very large relative to any other terrestrial biome or ecosystem – i.e. be-tween∼250 and 600 Pg C, or 10 to 20% (Gorham, 1991; Tu-runen et al., 2002; Tarnocai et al., 2009) of a∼2300 Pg C total (Denman et al., 2007). The maintenance of this store of C is in large part a function of the moisture conditions of peatlands. If moisture were to change due to climate change, it is expected that the C uptake or release and methane (CH4)
emissions increase or decrease resulting from wetter or dryer conditions respectively (Moore et al., 1998). A change in stored C by 5% could represent 12 to 25 Pg C. Unfortu-nately, unlike forested and grassland ecosystem biogeochem-istry models, there has been little effort in developing models of peatland biogeochemistry that are suitable for use in cli-mate simulations (e.g. Frolking et al., 2002). In this paper we develop a model, the McGill Wetland Model (MWM), based on the general Peatland Carbon Model (PCARS; Frol-king et al., 2002), but that has the same general structural and functional components as the Canadian Terrestrial Ecosys-tem Model (CTEM; Arora, 2003; Arora and Boer, 2005a,b, 2006), the terrestrial C model developed for inclusion in the Canadian Centre for Climate and Model Analysis (CCCma) coupled general circulation model. Eventually a MWM-like model would be incorporated into CTEM if the general cli-mate models are sufficient to support the hydrological needs of wetland simulation in climate change scenarios.
Peat is the remains of partially decomposed plants and it accumulates because the NPP of a peatland exceeds decom-position, on average. Decomposition in peatlands is slow because of the persistence of anoxic conditions throughout most of the peat profile due to the saturated conditions in-hibiting the diffusion of oxygen; therefore the hydrology of the ecosystem is critical to the cycling of C. In addition, many peatland plants, particularly the Sphagnum mosses that grow on the ombrotrophic (i.e. rain-fed, and/or nutrient poor peat-lands) are much more resistant to decomposition than the fo-liar tissues of vascular plants (Moore and Basiliko, 2006). As litter is added to the peat profile the peatland surface contin-ues to grow in height. As the litter decomposes it loses its original structure leading to a dramatic change in the pore size distribution at the long-term position of the water table. This effectively creates two layers of peat: a deep and thick anoxic zone called the catotelm and a shallow, thin, surface oxic zone called the acrotelm (Ingram, 1978). To simulate decomposition in peatlands it is essential that there be an ad-equate description of the hydrology of these layers of a peat-land, particularly the day-to-day and seasonal variability in
the position of the water table. In other work we have modi-fied the Canadian Land Surface Scheme (CLASS) for the in-clusion of organic soils and the estimation of the water table for both fen and bog type peatlands – the two dominant forms of northern peatlands (Letts et al., 2000; Comer et al., 2000). Once the water table is known a model needs to be able to capture the differences in the rates of decomposition caused by the differences in anaerobic conditions down through the peat profile and the progressively more recalcitrant residual material that dominates at depth.
In addition to the reduction in decomposition in peatlands, a model of peatland C dynamics needs to account for the uniqueness in the plants that inhabit peatlands. Peatland vegetation is characterized by sedges, herbs, deciduous and evergreen shrubs, the latter often represented by ericaceous shrubs, mosses that are usually Sphagnum in the more nu-trient poor acidic peatlands, and conifer trees, if trees are present. Most terrestrial ecosystem models can adequately represent photosynthesis and respiration for sedges using the function for grasses, and deciduous shrubs and conifers, but they lack the attributes of plant functional types that cap-ture the behaviour of ericaceous shrubs and mosses. Mosses present a further problem, as they have no roots or vascular system.
The Canadian Terrestrial Ecosystem Model (CTEM) is representative of the general structure and function of terres-trial ecosystem models used in global couple climate simula-tions (Aurora, 2003). CTEM has three live C components: leaves, stem and roots; and two dead C components: lit-ter and soil. Photosynthesis is based on the biogeochemical approach (Farquhar et al., 1980; Collatz et al., 1991, 1992) with coupled photosynthesis-stomatal conductance and a de-scription of moisture stress. Autotrophic respiration is the sum of maintenance respiration for the three live compo-nents and growth respiration. Heterotrophic respiration is the sum of respiration from a litter pool and a single soil pool, with base respiration rates modified by soil or litter temperature and moisture. To adapt PCARS closer to the structure and approach of CTEM we have: (1) replaced the light use efficiency approach for photosynthesis in PCARS with the biogeochemical approach used in CTEM and then developed the parameters for the biogeochemical model for typical peatland plants: sedges, ericaceous shrubs, mosses; (2) modified the description of autotrophic respiration to be consistent with the new formulation for photosynthesis; and (3) converted the cohort, multi-layer soil respiration model used in PCARS (the Peat Decomposition Model; Frolking et al., 2001) to a two-compartment litter and soil respiration model, where the soil (peat) is partitioned into an oxic and anoxic zone using an effective water table.
et al., 2007). We then examine the sensitivity of the model to changes in “key” environmental variables such as temper-ature and water table. We conclude with a brief discussion of how the model could be extended to other peatland types and how the MWM might be adapted for use in regional or global analyses.
2 McGill Wetland Model (MWM)
The MWM is composed of four C pools: two living matter pools – one moss and the other vascular plants (composed of leaves, sapwood and roots), as well as two dead matter pools – litter and peat. C enters the system through photo-synthesis of vascular plants and mosses and leaves via ei-ther autotrophic respiration or heterotrophic respiration. The C allocation in roots and leaves and the simple growing degree-days approach for the seasonal phenology of vascu-lar plants follow PCARS: a fixed maximum and minimum threshold,Bmax foliarandBmin foliar, respectively, bound the
foliar biomass of a given vascular plant andBrootdetermines in turn the root biomass. Sapwood volume (Bstem) is a
fixed parameter throughout the simulations. Moss capitu-lum biomass (Bmoss) is also fixed and moss
photosynthe-sises whenever environmental conditions permit. Once the vascular plant tissue and moss die they become litter and are decomposed for one year in a litter pool and then trans-ferred to the peat C pool. At present the MWM has four plant functional types (PFTs): mosses, sedges, shrubs, and conifer trees. The details of the processes that are substan-tially changed from PCARS to MWM are described below. 2.1 Photosynthesis
MWM computes the photosynthesis for each PFT at an hourly time step based on the Farquhar biochemical approach (Farquhar et al., 1980; Collatz et al., 1991, 1992). The com-putation for the non-vascular PFT is slightly different since mosses do not possess stomata. For mosses, a semi-empirical model including the effects of water content on photosyn-thetic capacity (Tenhunen et al., 1976) and on total conduc-tance to CO2 (Williams and Flanagan, 1998) replaces the
stomatal conductance of vascular PFTs.
For all PFTs, net photosynthesis (An) is expressed as:
An = Vc
1 − 0∗
Ci
−Rd
Vc = min Wc, Wj
(1)
whereVcis the rate of carboxylation of Rubisco,Ciis the
in-tercellular CO2partial pressure,0∗is the CO2compensation
point in the absence of mitochondrial respiration which is related toτ, the Rubisco enzyme specificity factor and oxy-gen concentration, [O2], through0∗=0.5 [O2]/τ. Rdis the
dark respiration and Vc is determined by the minimum of
the rate of carboxylation when limited by Rubisco activity (Wc) or RuBP regeneration via electron transport (Wj). We
use the standard formula forWc(not shown), where the key
parameter in this description isVcmax25the maximum
veloc-ity of Rubisco carboxylation at 25◦C. The rate of electron transport (Wj) (not shown) is described in Farquhar and von Caemmerer (1982). The key variable here is the potential electron transport rateJ (Smith, 1937), which is a function of intercepted photon flux density (I) andJmaxthe maximum
light-saturated rate of electron transport whose temperature dependency is outlined by Farquhar et al. (1980) and Lloyd et al. (1995). Jmaxat 25◦C (Jmax25) is determined from a
Jmax:Vcmaxratio (Medlyn et al., 2002).
2.2 Conductance of vascular plant types
The canopy conductance (gc) and boundary layer
conduc-tance (gb) are required to obtain theCi of vascular PFTs:
Ci = Cs −An 1.4
gb
− 1.6
gc
(2)
Cs =Ca −
1.4Anp
gb
(3)
whereCsis the canopy surface CO2partial pressure,Cathe
atmospheric CO2partial pressure,pis the atmospheric
pres-sure, and the constants 1.4 and 1.6 consider the reduced dif-fusivity of CO2compared to water through the leaf surface
and the canopy, respectively. Ci is evaluated through
itera-tion. A land surface scheme would provide the value ofgb
in a coupled regional or global simulation; in the stand-alone versiongbis calculated with the Ball-Berry approach (Ball et
al., 1987). The Jarvis approach (Jarvis, 1976) parameterized for peatlands is used to evaluate the canopy resistance (rc),
which is inversely proportional togc.
Soil matric potential (9) used in the calculations of canopy conductance was evaluated individually for the catotelm and the acrotelm using the formulations of Camp-bell (1974) and Clapp and Hornberger (1978) and the param-eters for peat suggested by Letts et al. (2000). A normalized water-content function,G(θ ), parameterized for peatland by Letts et al. (2000) modifiesgcto account for the water stress
factor:
G (θ ) = 1 −(1 −β)2
β (θ ) = maxh0,min1, θl−θlim
θp−θlim
i (4)
whereθlim is the residual soil-water content, θl is the
vol-umetric soil-water content andθp is the soil porosity. The
is evaluated at two depths (d) corresponding to the centre of fibric and hemic layers:
θl = θp
W −d
9sat
−1
b
(5) whereW is the water table depth,9satis the soil matric
po-tential at saturation andbis the soil texture parameter of the peat layer as suggested by Letts et al. (2000).
2.3 Total conductance of mosses
For mosses, total conductance to CO2(gtc) is used to find
Ci instead of stomatal conductance employed for vascular
plants: Ci = Ca −
An
gtc
(6) Total conductance is determined from a least square regres-sion described by Williams and Flanagan (1998) as:
gtc = −0.195 +0.1342f −0.025622f
+0.0022823f−0.000098424f + 0.0000016825f (7) where2fis the moss water content in units of g fresh moss/g
dry moss (=2m+1, where2mis g water/g dry moss). This
relationship is only valid up to the maximum holding capac-ity of mosses (2maxcap). Soil-water content and the
capitu-lum interception of atmospheric water determine the water content of mosses. A function derived from the results of an experiment done by Hayward and Clymo (1982) with
Sphag-num capillifolium determines the moss water content from
capillary rise (2cr) in g water/g dry moss:
2cr =max2mincap,min(2maxcap,22 exp[−6.5W]) (8)
where 2mincap is the minimum interception capacity for
mosses. The water content in the capitulum of mosses (2ca)
is added to the total moss water content (2m):
2m =2ca +2cr (9)
In turn, the intercepted water pool is affected by a loss rate, kd, due to evapotranspiration (Frolking et al., 1996):
2ca(t +1)= min
2maxcap;2ca(t )+
ρwaterhppt
Bmoss
(10) during a rain event;
2ca(t +1) = 2ca(t )exp [−kdtd] otherwise, (11)
wheret refers here to the hourly time steps,ρwateris an
ap-proximation of the rain water density, hppt is precipitation in mm h−1, td is the sum of the number of one-hour time
steps with no precipitation. This sum is reset to zero as soon as a precipitation event occurs. If MWM were coupled to a surface climate model, Eqs. (10) and (11) would not be nec-essary since they would be derived directly from the latent heat flux.
2.4 Autotrophic respiration
The temperature dependency of the autotrophic respira-tion (AR) of mosses follows aQ10 type relationship and is
further modified by the functionf2to account for the moss water content effect on respiration (Fig. 2e–f; Frolking et al., 1996). AQ10 of 2.0 (Frolking et al., 2002; Arora, 2003)
along with the base rate respiration at 25◦C,Rd25, are used
to calculate total dark respiration at temperatureT (in◦C): R = R25f2Q(T
−25)/10
10 (12)
The autotrophic respiration of other PFTs also follows aQ10
relationship for temperature sensitivity and is a combination of maintenance respiration of the leaves, stems, roots, and growth respiration similarly to CTEM (Arora, 2003). It is closely linked to the allocation of C in the plant.
2.5 Decomposition
Heterotrophic respiration (HR) in the C stored in peat is par-titioned between oxic and anoxic respiration according to the position of an effective water table. It is assumed that the mass of peat above the effective water table decomposes un-der oxic rates through aerobic pathways, while peat below the water table decomposes at anoxic rates through anaer-obic pathways. The effective water table depth, Weff,
rep-resents the position of the water table that is derived from the actual water table depth by adding the water distributed in the oxic layer expressed as depth and subtracting the air volume trapped in the anoxic layer. An hourly moisture pro-file is used to estimate the amount of water in the oxic com-partment. Each compartment is characterized by either oxic or anoxic conditions with corresponding rates of respirations equal to:
Roxic = keff,oftCo (13)
Ranoxic = keff,aftCan (14)
wherekeff,oandkeff,a are termed the effective hourly mass
loss rates in oxic and anoxic conditions, respectively,Coand
Canare the carbon contents in the oxic and anoxic
compart-ment, respectively. The temperature dependency of decom-position, ft, is similar to that used in PCARS (Frolking et
al., 2002) with the addition of a minimum temperature for decomposition (Clein and Schimel, 1995). We use the peat bulk density profile based on Fig. 1c in Frolking et al. (2001) to find the carbon content, which is also fractioned in the oxic and anoxic compartments accordingly with the effective wa-ter table depth:
Co = frac× h
4056.6Weff2 +72067.0Weff i
(15)
Can = frac× h
where PD is the total peat depth and frac is the biomass to carbon ratio. Peat depth requires initialization (PD0) and is
site specific. Fresh litter is decomposed in a separate com-partment for a year using Eq. (13), withkeffreplaced with an
initial decomposition rate (k0)for moss and for all other
lit-ter and Co is replaced with the mass of moss and all vascular plant litter, respectively. Total C content, or equivalent peat depth, is obtained by adding Eqs. (13) and (14), by subtract-ing from it the loss in C due to decomposition and addsubtract-ing to it the remaining litter from the plants after its initial year of decomposition, and finally by solving the quadratic equation for PD. Fresh litter C content is therefore not included to the peat C pool in its first year.
The Peat Decomposition Model (PDM) developed by Frolking et al. (2001) is used to obtain a “representative” ver-tical profile of mass loss rates for bogs and fens. The profiles are built using the long-term fixed water table depths of Frol-king et al. (2001) for a representative bog and fen, but the effect of anaerobic conditions on decomposition is kept as in PDM: a modifier equal to 0.1 for fens or 0.025 for bogs is used for anoxic conditions. During the initialization of the peat profile the peat temperature profile is also assumed constant. For MWMkeff,oandkeff,aare then obtained by
in-tegrating the area under the exponential mass loss curves of the profile in the oxic and anoxic layer, respectively (e.g. see Fig. 2; Frolking et al., 2001).
3 Site and data sets
The fluxes of CO2in the MWM, such as photosynthesis and
respiration, are functions of environmental drivers. These drivers can either be input to the model from measurements from a specific site or can be obtained from a land surface model or global climate model, if MWM is being run in a coupled mode. The model requires hourly weather data: air and soil temperatures, water table depth, photosynthetic pho-ton flux density, precipitation (rain and snow), wind speed, atmospheric pressure, atmospheric CO2concentration,
rela-tive humidity and net radiation.
For the purposes of the present study we run the MWM us-ing 8 years of environmental measurements (1 January 1999 to 31 December 2006) from the Mer Bleue peatland, a 28 km2 raised ombrotrophic bog near Ottawa, Canada (45◦250N, 75◦400W). We use the calendar year for our sim-ulations. The climate of the region where Mer Bleue is located is cool-temperate with a mean annual temperature of 6.0◦C and a mean annual precipitation of 944mm for the period 1970–2000 (www.climate.weatheroffice.ec.gc.ca/ climate normals/index e.html). Hourly weather data is taken from the MB flux tower data set (http://fluxnet.ccrp.ec.gc.ca/ e about.htm).
The bog is covered by mosses (Sphagnum
capil-lifolium, Sphagnum magellanicum), evergreen shrubs (Chamaedaphne calyculata, Kalmia angustifolia, and Ledum
groenlandicum), and some deciduous shrubs (Vaccinium myrtilloides), scattered sedges (e.g. Eriophorum vaginatum),
patches of black spruce (Picea mariana) and larch (Larix
laricina) in the central part (Roulet et al., 2007). The peat
depth is approximately 5 m. Total aboveground biomass for vascular species measured in 1999 and 2004 averaged 356±100 g m−2 (Moore et al., 2002) and 433 g m−2 (Bu-bier et al., 2006). Belowground biomass in 1999 was 1820±660 g m−2 (Moore et al., 2002). Sphagnum capit-ulum biomass in 1999 was 144±30 g m−2 (Moore et al., 2002) and 158 g m−2in 2004 (Bubier et al., 2006).
A complementary data set containing model parameters based on studies reported in the literature serves for all sites within a range of general northern peatlands types (Table 1). There are three sets of parameters and initialization vari-ables in Table 1. The first set is generic, meaning the pa-rameters apply to any peatland that has the PFTs that are referred to. These are referred to under Values at 25◦C and Others (Table 1). The second set of parameters or ini-tial values are specific to Mer Bleue. These are Site Spe-cific initial values for vegetation biomass and peat depth. These values will be unique to each peatland that the MWM would be evaluated for but would be replaced by generic “representative” peatland values for bogs of a general eco-climatic region for climate – ecosystem simulations. The third set of parameters, which contains the only parameter not obtained from the literature, was the Vcmax25 for
ever-green shrubs. We could not find any published values for peatland evergreen shrubs so we conducted a set of measure-ments over one summer to determine CO2response curves
for Chamaedaphne calyculata and Ledum groenlandicum us-ing a LICOR 6400 portable photosynthesis system in satu-rated light (∼1500 µmol m−2s−1) and leaf chamber temper-ature of 25◦C. The value reported in Table 1 is the median value of over 50 measurements but we have yet to publish this work.
4 Results and discussion
Table 1. Parameters and initial values used in MWM simulations.
Parameter Value Units Description Reference/source
Values for 25◦C
Jmax:Vmax 1.67 µmol m−2s−1 ratio Medlyn et al., 2002 Mosses
Vcmax25 6 µmol m−2s−1 maximum carboxylation rate (spring) William and Flanagan, 1998 14 µmol m−2s−1 maximum carboxylation rate (summer) William and Flanagan, 1998 7 µmol m−2s−1 maximum carboxylation rate (autumn) William and Flanagan, 1998
Rd25 0.946 µmol m−2s−1 dark respiration rate Harley et al., 1989
Shrubs
Vcmax25 17 µmol m−2s−1 maximum carboxylation rate Unpublished
Site Specific
frac 48.7 % biomass carbon content Moore et al., 2002
Bmoss 144 g dry biomass m−2 Moss capitula biomass Moore et al., 2002 Bmin foliar 175 g dry biomass m−2 minimum shrub foliar biomass Moore et al., 2002 Bmax foliar 600 g dry biomass m−2 maximum shrub foliar biomass Moore et al., 2002
Bstem 0.003 m3m−2 shrub sapwood volume Moore et al., 2002
PDo 4 m Initial depth of peat Roulet et al., 2007
Others
2min 0.04/0.15 dimensionless residual soil water content fibric/hemic peat Letts et al., 2000
2o 0.93/0.88 dimensionless soil porosity fibric/hemic peat Letts et al., 2000 9sat 0.0103/0.0102 m matric potential at saturation fibric/hemic peat Letts et al., 2000 b 2.7/4.0 dimensionless soil texture fibric/hemic Letts et al., 2000
2maxcap 15 g water g dry biomass−1 maximum water holding capacity moss Silvola, 1990 2mincap 5 g water g dry biomass−1 minimum water holding capacity moss Price et al., 1997
kd 1 % capitulum water loss rate Frolking et al., 1996 ko 0.05/0.2 yr−1 Initial decomposition rate moss/leaves-roots Moore and Basiliko, 2006
short time scales (hourly, daily) but the uncertainty gets much smaller for long time scales (annual) (Hagen et al., 2006).
In the footprint of the Mer Bleue eddy covariance mea-surements mosses and shrubs were the dominant PFTs. While the MWM contains the parameters for peatland trees and sedge PFTs they were not activated in the present evalua-tion. Tests for these other PFTs will be done as NEE records for a wider and more varied range on peatlands types become available.
4.1 Annual patterns of simulated and measured exchange fluxes
We summed the daily gap-filled NEE from Mer Bleue to generate an annual net ecosystem productivity (NEP). Here we use the terminology for NEP as proposed by (Chapin et al., 2006): NEP is the difference between GPP and ER and equals – NEE. From the output of MWM we estimated net primary production (NPP) of the mosses and shrubs as the difference between their GPP and AR respectively. We can compare this simulated NPP with the annual estimates of NPP for Mer Bleue of Moore et al. (2002) and the range of NPP found in the literature for open bogs. Finally, MWM produces an output of total HR based on the sum of oxic
decomposition of the first year litter and the peat located above the effective water table and anoxic decomposition from below the effective water table. At present we cannot do a complete analysis of net ecosystem C balance, NECB (Chapin et al., 2006), because we have not yet incorpo-rated modules that partition the decomposition products into CO2and CH4fluxes, and net DOC export: currently, ER all
goes to CO2. This means MWM annual ER should exceed,
on average, the eddy covariance measurements of ER by
∼15 g C m−2yr−1based on the six year estimates of NECB (Roulet et al., 2007).
In general, the MWM simulates the magnitudes and inter-annual trend in inter-annual NEP well (Table 2). The maximum NEP underestimate was 64 g C m−2yr−1 in 1999 and the maximum overestimate was 46 g C m−2yr−1 in 2000. The
average absolute difference between simulated and measured NEP is 39 g C m−2yr−1. NEP is underestimated for two of
Table 2. Observed (Obs.), simulated (Sim.), and the difference (D) between observed and simulated (1) annual NEP, GPP and ER for 8 years for the Mer Bleue peatland. The exchanges are expressed in g C m−2yr−1and the superscripts on moss and shrub GPP, ER and NPP and the HR components of ER indicate their fractional contribution. SD refers to the standard deviation.
NEP GPP ER NPP
Year Obs. Sim. D Obs. Sim. D Moss1 Shrub1 Obs. Sim. D Moss1 Shrub1 Oxic HR1 Anoxic HR1 Sim. Moss1 Shrub1
1999 65 1 −64 646 624 −22 0.34 0.66 −582 −623 −36 0.27 0.65 0.08 <0.01 52 0.82 0.16 2000 32 78 46 463 628 165 0.61 0.61 −431 −550 −119 0.27 0.65 0.08 <0.01 126 0.79 0.21 2001 2 39 37 543 662 119 0.33 0.67 −541 −623 −81 0.26 0.65 0.08 <0.01 93 0.61 0.39 2002 13 35 22 511 647 136 0.38 0.62 −498 −612 −116 0.27 0.64 0.09 <0.01 91 0.89 0.11 2003 15 85 70 495 667 172 0.36 0.60 −480 −582 −102 0.28 0.63 0.08 <0.01 136 0.58 0.42 2004 115 133 18 683 713 30 0.36 0.64 −568 −580 −12 0.28 0.63 0.08 <0.01 181 0.52 0.48 2005 91 101 10 668 710 42 0.34 0.66 −598 −609 −11 0.28 0.64 0.08 <0.01 151 0.49 0.51 2006 147 99 −48 772 704 −68 0.34 0.66 −625 −604 20 0.27 0.65 0.08 <0.01 147 0.56 0.44 Mean 60 71 11 598 669 72 0.36 0.60 −540 −598 −57 0.27 0.64 0.08 <0.01 122 0.62 0.38 SD 53 43 – 110 36 – 0.02 0.02 66 25 – 0.01 0.01 0.00 <0.01 41 0.37 0.16
1contribution
0.63, and 0.57 respectively. As expected the coefficients are higher for modelled GPP and ER than modelled NEP, as any errors in GPP and ER are propagated in NEP.
There are no direct measurements to evaluate how well MWM does in estimating the fractional components that make up total GPP and ER, but the proportions approximate what is generally expected (Table 2). The fraction of moss GPP ranges between 0.33 and 0.39 (mean 0.36±0.02) and shrub GPP from 0.61 to 0.67 (mean 0.64±0.02) of the to-tal. AR represents over 90% of ER, with shrub respiration and moss respiration comprising on average 64±1% and 27±2% respectively. Oxic zone decomposition contributes 96% of HR, consistent with the relative proportions of oxic and anoxic sources of CO2and CH4in the peat column
ex-periments of Blodau et al. (2006).
NPP, which is the difference between GPP and AR, dis-plays a different pattern than the gross fluxes (Table 2). In the MWM simulation moss NPP represents a mean of 62% of total NPP (minimum and maximum of 49% and 89%), while shrubs NPP averages 38% (minimum and maximum of 11% and 51%). So while the contribution of moss and shrub to GPP and ER varies only slightly over the eight years (standard deviation [SD] of 0.02 and 0.01 g C m−2yr−1) the NPP shows a much greater interannual variability (SD of 0.16 g C m−2yr−1). This is due to the way MWM handles growth and maintenance respiration. In the case of moss, each year the GPP goes entirely to growing new moss, which is then assumed to die at the end of the growing season; whereas shrub has a biomass that requires significant main-tenance respiration and hence a smaller fraction of GPP be-ing translated into new biomass. MWM produces lower val-ues of shrub NPP than expected. Measurement of the an-nual change in biomass in peatland shrub and moss is diffi-cult, but the expected ranges based on a synthesis of peatland NPP studies (Moore et al., 2002) are 21–169 g C m−2yr−1 for shrub above-ground NPP and 8–190 g C m−2yr−1 for moss NPP, and 79–377 g C m−2yr−1for total NPP (assum-ing biomass is 50% C). For Mer Bleue, Moore et al. (2002)
estimated above ground shrub and moss NPP in 1999 to be 80 and 85 g C m−2yr−1, respectively, while the MWM for the same year simulated 9 and 47 g C m−2yr−1, respectively. For the eight simulated years, the average of simulated above ground shrub and moss NPP were 95 g biomass m−2yr−1 and 157 g biomass m−2yr−1, respectively. We believe this underestimation of shrub NPP occurs, in part, because of the range in which shrub foliar biomass is allowed to vary. We use the minimum and maximum values from PCARS (Frol-king et al., 2002), but the range could easily be greater with the water table variability observed over the 8-year evalua-tion period. There is, however, a dearth of empirical observa-tions of the fractional components of total NPP in peatlands, and as far as we know, no one has reported on year-to-year variations in peatland biomass, be it aboveground or simply foliar.
4.2 Seasonal and interannual variability of simulated and measured exchange fluxes
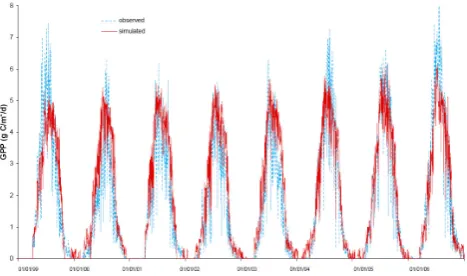
Simulated GPP follows a strong annual cycle with maximum daily fluxes ranging from 5.0 g C m−2d−1to 6.0 g C m−2d−1 during the peak growing season to zero during the coldest months (Fig. 1). Statistical analysis reveals a Willmott’s index of agreement (Willmott, 1985; Comer et al., 2000) of 0.97 between the simulated and the tower fluxes with a systematic root mean square error (RMSEs) and an
unsys-tematic root mean square error (RMSEu) of 0.07 g C m−2d−1
and 0.27 g C m−2d−1, respectively. The low systematic
Fig. 1. The time series of hourly measured (blue dashed line) and simulated (red solid line) GPP for 1999–2006.
-8 0 8
-8 0 8
observed (gC/m2/d)
si
mu
lat
ed
(g
C/m
2/d
)
GPP y = 0.921x + 0.319 RMSEs = 0.07 RMSEu = 0.28 d = 0.97 ER
y = 1.0749x + 0.0457 RMSEs = 0.14 RMSEu = 0.23 d = 0.97
[image:8.595.51.285.63.201.2]
Fig. 2. The scatter plot of observed and simulated daily GPP and ER for 1999–2006. The solid black line indicates the 1:1 line and the dashed line is the best fit relationship between the observations and the simulated GPP and ER.
threshold defined in the model for foliar biomass. However, the maximum foliar biomass should have a seasonal, not an hourly impact.
The average growing season water table depths and tem-peratures were ranked for the 8 years of simulation to see if there was any correlation with the average fluxes (Table 3a). There is a significant rank correlation of NEP and ER with water table, and ER with temperature (Table 3b). The stan-dard deviation for the average temperatures is 0.79◦C and that for average water table depth is 0.06 m. According to the sensitivity analysis described below only the variation in temperatures significantly affects the fluxes. In general, GPP is greater in warmer years. However, there are exceptions to this trend. 2004 has the highest simulated GPP even though it corresponds to a relatively cold year and the lowest GPP is found in 1999, which has the warmest growing season.
Examining the inter-annual variability of cumulative sim-ulated GPP (Table 2) reveals the consequences of limiting the range in which vascular plant foliar biomass can exist. The growing season of 2002 was extremely dry. At Mer
Table 3A. The ranking of the relative patterns on water table and temperatures for the 8 years of comparison between the observed and simulated peatland carbon dynamics.
1999 2000 2001 2002 2003 2004 2005 2006
temperature1 1 8 4 6 5 7 2 3 water table2 1 7 2 3 4 6 5 8
NEP3 8 5 6 7 4 1 2 3
GPP3 8 7 5 6 4 1 2 3
ER3 2 8 1 3 6 7 4 5
[image:8.595.309.549.100.166.2]1temperature 1 = warmest, 8 = coldest; 2water Table 1 = shallowest, 8 = deepest; 3NEP, GPP, and ER 1 = largest, 8 = smallest.
Table 3B. Spearman’s rank correlations between temperature, water table and NEP, GPP, and ER.
T WTD
NEP −0.2 −0.71* GPP −0.05 −0.5 ER 0.67** 0.79*
* and **: indicate significance at the 0.05 and 0.10, respectively.
Bleue we made casual observations that indicated there was increased leaf litter fall of the evergreen shrubs. However, MWM does not allow the foliar biomass to go below a pre-scribed minimum value. The following year (2003) MWM grossly over-estimated GPP. Such a result would occur if the MWM carried over too much foliar biomass from the previ-ous year. This would increase shrub photosynthesis by hav-ing more than expected leaf area to capture light and con-versely increase moss photosynthesis due to a lack of shading by the shrubs. However, shrubs account for more than 65% of overall photosynthesis. Such findings underscore the im-portance of drought stress on the vascular plants, which was not something we initially considered an issue for peatland plants. Yet, it appears that a year-to-year memory is needed to ensure a better description of the antecedent conditions for production in subsequent years.
ER shows a strong annual cycle with maximum daily fluxes ranging between−4.2 g C m−2d−1and−5.2 g C m−2 d−1during the growing season and fluxes of approximately
−0.25 g C m−2d−1 during the cold season. Simulated respiration has an agreement of 0.97 with the tower flux and a RMSEs and RMSEu of 0.14 g C m−2d−1 and
0.23 g C m−2d−1, respectively. Simulated respiration is
biased towards carbon loss compared to tower measure-ments, especially during the growing season (Fig. 3). There is a slight over-estimate of simulated ER for fluxes up to
[image:8.595.50.288.251.397.2]Fig. 3. The time series of hourly measured (blue dashed line) and simulated (red solid line) ER for 1999–2006.
[image:9.595.51.286.64.194.2]
Fig. 4. The time series of hourly measured (blue dashed line) and simulated (red solid line) NEP for 1999–2006.
for a stronger or different temperature dependency (e.g., a Q10>2.0). The highest annual fluxes are found in 1999 and
2001 and the lowest annual fluxes are in 2000 and 2004. As expected, warmer years tend to have larger ER fluxes. No correlation exists between the rankings of simulated ER and GPP fluxes. This reflects the fact that even though both fluxes are sensitive to the temperature in a similar manner, other environmental conditions also significantly affect the annual fluxes.
Simulated daily NEP shows a strong annual cycle with maximum daily uptakes ranging between 1.5 g C m−2d−1 and 2.5 g C m−2d−1 during the growing season and max-imum ecosystem loss of around −0.25 g C m−2d−1 during the cold season and approximately−1.0 g C m−2d−1during
the growing season (Fig. 4). RMSEs was 0.12 g C m−2d−1,
the RMSEu was 0.15 g C m−2d−1 and the index of
agree-ment 0.80 (Fig. 5). The NEP of 2004 and 2005 have the highest magnitudes while the lowest NEP occurs in 1999 and 2002. Larger NEP generally occurs in the warmer years. As mentioned earlier, daily NEP is not simulated but derived from the subtraction of ER from GPP. Therefore NEP has a tendency to underestimate the highest fluxes in a similar way to GPP. NEP also accumulates the errors propagated from
-3 0 3
-3 0 3
observed (g C/m2/d)
si
mu
lated (g
C/m
2/d)
NEP y = 0.5569x + 0.2874 RMSEs = 0.13 RMSEu = 0.18 d = 0.80
[image:9.595.52.286.248.383.2]
Fig. 5. The scatter plot of observed and simulated daily NEP for 1999–2006. The solid black line indicates the 1:1 line and the dashed line is the best fit relationship between the observations and the simulated NEP.
both GPP and ER fluxes, generating a RMSE that represents a relative error twice as large as that for GPP and ER. 4.3 Sensitivity analysis
Sensitivity analyses were performed to assess the change in C fluxes with variations in the two main environmental param-eters: water table depth and moisture supply through precip-itation; and temperature, including air, surface and peat tem-peratures. This analysis serves two purposes. First, it gives an indication of what the key sensitivities are in the MWM and secondly, it provides some initial insights into the poten-tial sensitivity of C cycling in northern peatlands to changes in climate. In the future we plan to use MWM coupled to a surface climate model to simulate the potential effects of climate change using the output of general climate simula-tions as input to the coupled wetland model. In this sensi-tivity analysis the structure of the ecosystem does not change due to competition among plant functional types even though the range of physical conditions imposed in the sensitivity analysis is, in some cases, well outside the range that would be considered climatic and hydrologic “niches” of the peat-land plant functional plant types. The sensitivity analyses are done for the 8 years and averaged for that period (Table 4).
To fully cover the potential climatic changes, we imposed variations from the actual water table depth of−10 cm (wet-ter) to +30 cm (drier) in increments of 5 cm. A negative in-crement or a decrease in water table depth refers to a water table closer to the peat surface. The effects of the water table depth variations in moss C cycling occur through changes of moss water content, which is in turn used to calculategtcand
Table 4. The sensitivity of simulated GPP, autotrophic respiration (AR), NPP and oxic and anoxic heterotrophic respiration (HR) expressed in percent change relative to the baseline simulation (observed environmental variables: hwtd and airT are hourly mean water table depth and air temperature). A negative sign indicates a decrease relative to the baseline while a positive sign indicates an increase.
moss shrub
GPP AR NPP GPP AR NPP NEP Oxic HR Anoxic HR
Base line (gC/m2/yr) 237.82 −166.48 71.34 431.52 −415.72 15.80 68.79 −16.24 −2.11
hwtd (−10 cm) −0.22 −3.44 +7.28 −0.49 −0.19 −8.38 +11.34 −40.10 +122.25
hwtd (−5 cm) −0.09 −1.36 +2.86 −0.24 −0.09 −4.15 +5.56 −19.75 +36.68
hwtd (+5 cm) +0.06 +0.82 −1.74 +0.24 −0.09 +8.92 −3.55 +17.35 −9.81
hwtd (+10 cm) +0.08 +1.22 −2.58 +0.45 +0.18 +7.4 −8.53 +34.07 −16.05
hwtd (+15 cm) +0.09 +1.33 −2.82 +0.67 +0.26 +11.28 −11.73 +50.95 −20.65
hwtd (+20 cm) +0.09 +1.34 −2.85 +0.91 +0.37 +15.03 −14.90 +68.12 −22.21
airT (-2◦C) +2.11 −15.19 +42.46 −12.11 −17.16 +120.7 +51.76 −15.61 −12.89
airT (-1◦C) +1.18 −7.77 +22.03 −5.72 −8.61 +70.41 +21.76 −7.74 −6.66
airT (+1◦C) −1.38 +8.09 −23.48 +4.92 +8.84 −98.09 −15.08 +7.60 +7.16
airT (+2◦C) −3.04 +16.47 −48.59 +9.22 +18.06 −223.36 −41.68 +15.48 +14.82
airT (+3◦C) −4.59 +25.12 −73.94 +11.87 +27.54 −400.47 −78.67 +23.83 +23.03 airT (+5◦C) −8.32 +43.04 −128.15 +14.79 +48.15 −863.07 −174.52 +42.28 +41.26
autotrophic respiration for mosses is greater than that of GPP and therefore NPP increases (decreases) with a shallower (deeper) water table. The situation is reversed for shrubs. Consequently, the model favours shrub growth in a drier wet-land and moss growth in a more humid one. HR is far more sensitive than the live plant derived fluxes to water table vari-ations than plant functions are. Since the effective water table depth determines the partitioning between the much faster oxic decomposition rates and the slower anoxic decomposi-tions rates, the total HR (oxic plus anoxic) increases when the water table moves deeper into the peat and decreases as the water table rises toward the peat surface. Even though the sensitivity of HR is much greater than other sensitivities, the magnitude of the fluxes derived from decomposition are relatively small, therefore the sensitivity of NEP to variations in HR is also small. Moss NPP is larger and it dictates the direction of change of NEP regardless of its low sensitivity to water table changes. In none of the simulated cases was the bog a net source of C to the atmosphere. Lafleur et al. (2005) explained the lack of an apparent relationship between water table and the observed changes in ecosystem respiration at Mer Bleue by the offset of both positive and negative factors on production and heterotrophic respiration with changes in water table.
For the temperature sensitivity analyses, we varied the mean from−2◦C to +5◦C in 1◦C increments. The analyses show that an increase (decrease) in temperature results in de-crease (inde-crease) in moss GPP and an inde-crease (dede-crease) in moss AR. Moss AR is more sensitive to temperature change than GPP and therefore an increase (decrease) in temperature leads to a decrease (increase) in moss NPP. An increase (de-crease) in temperature corresponds to a decrease (in(de-crease) in shrub NPP. The HR flux is equally responsive to temperature change: as temperature increases (decreases) the respiration
increases (decreases). The changes in the fluxes with tem-perature are quite significant as temtem-perature imposes an ex-ponential impact upon C cycling. TheQ10relationship used
to determine the temperature sensitivity of AR and HR has a higher coefficient than the Arrhenius relationship describing that of GPP; therefore, the net effect is that NEP decreases (increases) as temperature increases (decreases). These anal-yses show that according to MWM ombrotrophic bogs could turn into net emitter of C to the atmosphere with a persistent rise in temperature of∼5◦C.
5 Conclusion and prospects for MWM
MWM captures the primary C cycling processes in north-ern peatlands and simulates the C exchanges between peat-lands and atmosphere within the acceptable errors, based on comparisons with measurements from the Mer Bleue om-brotrophic bog. Other major peatlands types include rich and poor fens, and both bogs and fens that support forest covers. MWM needs to be evaluated for these other peatland types before it can be applied for the regional to global assessment of the interactions between climate and general peatland car-bon dynamics.
foliar biomass within a specific range and currently has no capacity to shed an extra amount of litter due extended ex-tremely dry periods. In other words, MWM lacks a function analogous to the drought stress function contained in many forest ecosystem models. Such a function would have re-sulted in a smaller amount of evergreen foliar biomass in the spring of 2003 and this would have reduced 2003 grow-ing season production. Currently MWM has no interannual biomass memory. Unfortunately, our search of the literature reveals no studies reporting interannual variations in peatland vascular plant biomass.
We also suspect that the moisture content of the moss in the model does not become dry enough in years that expe-rience drought. The supply of water to the moss is crudely modelled in the MWM. Once the water table drops below a certain depth – e.g. 20 to 30 cm, there is no significant capillary raise of water to the moss (Hayward and Clymo, 1982). Once this occurs the moss is kept moist only by atmo-spheric inputs and when there are extended periods with no rain we have observed the moss becomes very desiccated. In this case they may be out-competed by other plant functional types that can more easily extract water from depth (Ger-dol et al., 2008; Breeuwer et al., 2009). The relationships among moss production, water level, temperature, and other environmental factors such as CO2concentration and
nutri-ent availability and supply are complicated and have been systematically studied only in the past few years (e.g. Ro-broek et al., 2009). With more empirical studies in may soon be possible to develop a better parameterization for the struc-ture and function of moss communities in MWM. We believe when MWM is coupled to the surface climate model we will be able to simulate plant and moss water losses much better. The sensitivity analysis showed that MWM shrub au-totrophic respiration was more sensitive to temperature than GPP, leading to a dramatic decrease in shrub NPP when tem-perature rises. With this decrease in shrub NPP it is very un-likely that the shrub community initialized in MWM would not be maintained. This large autotrophic respiration sensi-tivity to temperature is not realistic. Equation 12 is an expo-nential function and it would be more realistic if it reached an upper asymptote – i.e. described as a more Arrenhius type response where shrub NPP would approach zero in with in-creasing temperature stress. If no NPP for shrubs occurs for long time – e.g. multiple years, then the evergreen shrubs would not be sustained. This demonstrates that a dynamic vegetation structure is needed in MWM and this is a further development we wish to pursue. At present there is little understanding of the temperature – physiological response of peatland evergreen shrubs with changes in moisture and temperature (e.g. Weltzin et al., 2000).
MWM has no nitrogen cycle. Bogs are oligotrophic ecosystems but with increasing nitrogen deposition and/or increased mineralization there may be more available nitro-gen. While nitrogen fertilization experiments on bogs show that there is little change in total NPP (Berendse et al., 2001),
the addition of a nitrogen cycle in MWM would enable the examination of the affect of increased N deposition on bogs and/or climate induced changes in N mineralization on both plant production and peat and litter decomposition.
The MWM also needs further development to simulate the outputs of C as CH4and DOC. PCARS (Frolking et al.,
2002) has a crude formulation for the emission of CH4 but
it has not been widely tested. MWM does estimate anaer-obic decomposition so the challenge is first estimating how much CH4is produced per mass of anaerobic decomposition
and then emitting some of the produced CH4after oxidation
along each of the transport pathways of diffusion, bubble flux and/or plant mediated transport. Roulet et al. (2007) and oth-ers studies conclude that DOC is a significant loss of carbon from peatlands. Some of the aerobic and anaerobic decom-position estimated in MWM has to support this net produc-tion of DOC and the simulaproduc-tion of this loss presents a num-ber of challenges. Firstly, MWM will have to be coupled to a hydrological model that gives reasonable estimates of the loss of water through runoff, and secondly the partitioning of gross decomposition among CO2, CH4and net DOC export
will have to be formulated to maintain continuity between the changes in C stores and fluxes. We are unaware of any stud-ies that provide the process basis for the partitioning among the three C outputs for northern peatlands. There have been many studies of net DOC export, but none have related the export to gross DOC production or fraction of overall decom-position.
Water table depth is a key variable for peatland C cycling because it influences the spatial distribution of soil water content and subdivides the peat profile into oxic and anoxic compartments. In this stand-alone version of MWM, where there is no complementary calculations of water balance and energy balances, water table depth and soil climate are the direct inputs from field measurements. In order to investi-gate the response of northern peatlands to projected climate change, both water table depth and soil climate need to be simulated under the projected climate conditions. Therefore, our future plans are to couple the MWM to wetland-CLASS (Canadian Land Surface Scheme) to simulate the water table depth and soil climate. In addition, the empirical functions in this stand-alone version of MWM to simulate the moss wa-ter content will be replaced by more realistic evapotranspira-tion funcevapotranspira-tions transferred from wetland-CLASS. After vali-dating the coupled MWM-CLASS model against field mea-surements, MWM-CLASS will be ready to answer “what-if” questions and investigate how C cycling in northern peat-lands may change due to projected climate change based on the IPCC emission scenarios.
Acknowledgements. The authors would like to thank the generous
of the Mer Bleue observatory initially from a Natural Sciences and Engineering Research Council of Canada (NSERC) Strategic Grant, then from the Fluxnet Canada Research Network (CFCAS, NSERC and BIOCAP Canada), and currently by the Canadian Carbon Project (CFCAS). FSH and JW have also received graduate student support from the McGill University Global Environmental and Climate Change Research Centre (GEC3) and its predecessor the Centre for Climate and Global Change Research (C2GCR). SF has been supported by grant NSF ATM-0628399.
Edited by: A. Arneth
References
Aber, J. D. and Federer, C. A.: A generalized, lumped parame-ter model of photosynthesis, evapotranspiration and net primary production in temperate and boreal forest ecosystems, Oecolo-gia, 92, 463–474, 1992.
Arora, V. K.: Simulating energy and carbon fluxes over winter wheat using coupled land surface and terrestrial ecosystem mod-els, Agr. Forest Meteorol., 118, 21–47, 2003.
Arora, V. K. and Boer, G. J.: Fire as an interactive component of dynamic vegetation models, J. Geophys. Res.-Biogeo., 110, G02008, doi:10.1029/2005JG000042, 2005a.
Arora, V. K. and Boer, G. J.: A parameterization of leaf phenol-ogy for the terrestrial ecosystem component of climate models, Global Change Biol., 11, 39–59, 2005b.
Arora, V. K. and Boer, G. J.: Simulating competition and coex-istence between plant functional types in a dynamic vegetation model, Earth Interact., 10(10), 1–30, 2006.
Ball, J. T., Woodrow, I. E., and Berry, J. A.: A model predicting stomatal conductance and its contribution to the control of photo-synthesis under different environmental conditions, in: Progress in Photosynthesis Research, edited by: Biggens, J., vol. V, Mart-inus Nijhoff, Dordrecht, 221–224, 1987.
Berendse, F., Van Breemen, N., Rydin, H., Buttler, A., Heijmans, M., Hoosbeek, M. R., Lee, J. A., Mitchell, E., Saarinen, T., Vasander, H., and Wallan, B.: Raised atmospheric CO2levels
and increased N deposition cause shifts in plant species compo-sition and production in Sphagnum bogs, Global Change Biol., 7, 591–598, 2001.
Blodau, C., Roulet, N. T., Heitmann, T., Stewart, H., Beer, J., Lafleur, P., and Moore, T. R.: Belowground carbon turnover in a temperate ombrotrophic bog, Global Biogeochem. Cy., 21, GB1021, doi:10.1029/2005GB002659,2007.
Breeuwer, A., Robroek, B. J. M., Limpens, J., Heijmans, M. M. P. D., Schouten, M. G. C., and Berendse, F.: Decreased summer water table depth affects peatland vegetation, Basic Appl. Ecol., 10, 330–339, 2009.
Bubier, J., Moore, T. R., and Crosby, G.: Fine-scale vegetation dis-tribution in a cool temperate peatland, Can. J. Botany, 84, 910– 923, 2006.
Campbell, J. D.: A simple method for determining unsaturated con-ductivity from moisture retention, Soil Sci., 117, 311–314, 1974. Chapin III, F. S., Woodwell, G. M., Randerson, J. T., Rastetter, E. B., Lovett, G. M., Baldocchi, D. D., Clark, D. A., Harmon, M. E., Schimel, D. S., Valentini, R., Wirth, C., Aber, J. D., Cole, J. J., Goulden, M. L., Harden, J. W., Heimann, M., Howarth, R. W., Matson, P. A., McGuire, A. D., Melillo, J. M., Mooney, H.
A., Neff, J. C., Houghton, R. A., Pace, M. L., Ryan, M. G., Run-ning, S. W., Sala, O. E., Schlesinger, W. H., and Schulze, E.-D.: Reconciling carbon-cycle concepts, terminology, and methods, Ecosystems, 9, 1041–1050, 2006.
Clapp, R. and Hornberger, G.: Empirical equations for some soil hydraulic properties, Water Resour. Res., 14, 601–604, 1978. Clein, J. S. and Schimel, J. P.: Microbial activity of tundra and taiga
soils at sub-zero temperatures, Soil Biol. Biochem., 27, 1231– 1234, 1995.
Collatz, G. J., Ball, J. T., Crivet, G., and Berry, J. A.: Physiologi-cal and environmental regulation of stomatal conductance, pho-tosynthesis and transpiration: A model that includes a laminar boundary layer, Agr. Forest Meteorol., 54, 107–136, 1991. Collatz, G. J., Ribas-Carbo, M., and Berry, J. A.: A coupled
photosynthesis-stomatal conductance model for leaves of C4
plants, Aust. J. Plant Physiol., 19, 519–538, 1992.
Comer, N. T., Lafleur, P. M., Roulet, N. T., Letts, M. G., Skarupa, M., and Verseghy, D.: A test of the Canadian Land Surface Scheme (CLASS) for a variety of wetland types, Atmos. Ocean, 38, 161–179, 2000.
Denman, K., Brasseur, G., Chidthaisong, A., et al.: Couplings Be-tween Changes in the Climate System and Biogeochemistry, in: Climate Change 2007, The Physical Science Basis, edited by: Solomon, S., Qin, D., Manning, M., et al., Contribution of Work-ing Group I to the Fourth Assessment Report of the Intergovern-mental Panel on Climate Change, Cambridge, Cambridge Uni-versity Press, 1, 499–587, 2007.
Farquhar, G. D. and von Caemmerer, S.: Modelling of photosyn-thetic response to the environment, in: Encyclopedia of Plant Physiology, New Series, edited by: Lange, O. L., Nobel, P. S., Osmond, C. B., and Zeigler, H., Vol. 12B: Physiological Plant Ecology II , Springer-Verlag, Berlin, 549–587,1982.
Farquhar, G. D., von Caemmerer, S., and Berry, J. A.: A biochem-ical model of photosynthesis CO2assimilation in leaves of C3
plnats, Planta, 149, 78–90, 1980.
Friedlingstein, P., Cox, P., Betts, R., Bopp, L., Von Bloh, W., Brovkin, V., Cadule, P., Doney, S., Eby, M., Fung, I., Balal, G., John, J., Jones, C., Joss, F., Kato, T., Kawamiya, M., Knorr, W., Lindsay, K., Matthews, H. D., Raddatz, T., Rayner, P., Reick, C., Rockner, E., Schnitzler, K.-G., Schnur, R., Strassmann, K., Weaver, A. J., Yoshikawa, C., and Zeng, N.: Climate-carbon cy-cle feedback analysis: results from the C4MIP model intercom-parison, J. Climate, 19, 3337–3353, 2006.
Frolking, S., Goulden, M. L., Wofsy, S. C., Fan, S.-M., et al.: Mod-elling temporal variability in the carbon balance of a spruce/moss boreal forest, Global Change Biol., 2, 343–366, 1996.
Frolking, S., Roulet, N. T., Moore, T. R., Richard, P. J. H., Lavoie, M., and Muller, S. D.: Modeling northern peatland decomposi-tion and peat accumuladecomposi-tion, Ecosystems, 4, 479–498, 2001. Frolking, S., Roulet, N. T., Moore, T. R., Lafleur, P. M., Bubier,
J. L., and Crill, P. M.: Modeling the seasonal and annual car-bon balance of Mer Bleue bog, Ontario, Canada, Global Bio-geochem. Cy., 16(3), 1–21, doi:10.1029/2001GB001457, 2002. Frolking, S., Roulet, N., and Lawrence, D. M.: Issues Related to
Gerdol, R., Bragazza, L., and Brancaleoni, L.: Heatwave 2003: High summer temperature, rather than experimental fertilization, affects vegetation and CO2exchange in an alpine bog, New Phy-tol., 179, 142–154, 2008.
Gorham, E.: Northern peatlands: Role in the carbon budget and probable responses to global warming, Ecol. Appl., 1, 182–195, 1991.
Gorham, E.: The biogeochemistry of northern peatlands and its possible responses to global warming, in: Biotic feedbacks in the global climate system: Will the warming feed the warming?, edited by: Woodwell, G. M. and Mackenzie, F. T., Oxford Uni-versity Press, New York, 169–187, 1995.
Hagen, S., Braswell, B., Linder, E., Frolking, S., Richardsonm, A., and Hollinger, D.: Statistical uncertainty of eddy flux– based estimates of gross ecosystem carbon exchange at How-land Forest, Maine, J. Geophys.l Res.-Atmos., 111, D08S03, doi:10.1029/2005JD006154, 2006.
Harley, P. C., Tenhunen, J. D., and Lange, O. L.: Use of an analyt-ical model to study limitations on net photosynthesis in Arbutus unedo under field conditions, Oecologia, 70, 393–401, 1986. Hayward, P. M. and Clymo, R. S.: Profiles of Water Content and
Pore Size in Sphagnum and Peat, and their Relation to Peat Bog Ecology, P. Roy. Soc. Lond. B., 215(1200), 299–325, 1982. Ingram, H. A. P.: Soil layers in mires: function and terminology, J.
Soil Sci., 29, 224–227, 1978.
Jarvis, P. G.: The interpretation of leaf water potential and stom-atal conductance found in canopies in the field, Philos. T. Roy. Soc. B, 273, 593–610, 1976.
Jordan, D. B. and Ogren, W. L.: The CO2/O2specificity of ribulose
1,5-bisphosphate carboxylase/oxygenase, Planta, 161(4), 308– 313, 1984.
Kirschbaum, M. U. F. and Farquhar, G. D.: Temperature depen-dence of whole-leaf photosynthesis in Eucalyptus pauciflora Sieb. ex Spreng, Aust. J. Plant Physiol., 11, 519–538, 1984. Lafleur, P., Moore, T. R., Roulet, N. T., and Frolking, S.:
Depen-dency of ecosystem respiration in a cool temperate bog on peat temperature and water table, Ecosystems, 8, 619–629, 2005. Lafleur, P., Roulet, N. T., Bubier, J., Frolking, S., and Moore, T. R.:
Interannual variability in the peatland-atmosphere carbon diox-ide exchange at an ombrotrophic bog, Global Biogeochem. Cy., 17(2), 1036, doi:10.1029/2002GB001983, 2003.
Lafleur, P. M., Roulet, N. T., and Admiral, S.: The annual cycle of CO2 exchange at a boreal bog peatland, J. Geophys.
Res.-Atmos., 106, 3071–3081, 2001.
Letts, M. G., Roulet, N. T., Comer, N. T., Skarupa, M. R., and Verseghy, D. L.: Parameterization of peatland hydraulic proper-ties for the Canadian Land Surface Scheme, Atmos. Ocean, 38, 141–160, 2000.
Lloyd, J., Wong, S. C., Styles, J. M., Batten, D., Priddle, R., Turnbull, C., and McConchie, C. A.: Measuring and modelling whole-tree gas exchange, Aust. J. Plant Physiol., 22, 987–1000, 1995.
Medlyn, B. E., Dreyer, E., Ellsworth, D., Forstreuter, M., Harley, P. C., Kirschbaum, M. U. F., Le Roux, X., Montpied, P., Strasse-meyer, J., Walcroft, A., Wang, K., and Loustau, D.: Temperature response of parameters of a biochemically based model of photo-synthesis, II A review of experimental data, Plant Cell Environ., 25, 1167–1179, doi:10.1046/j.1365-3040.2002.00891.x, 2002.
Moore, T. and Basiliko, N.: Decomposition in boreal peatlands, in: Boreal Peatland Ecosystems, edited by: Wieder, R. and Vitt, D. H., Springer, New York, 126–143, 2006.
Moore, T. R., Bubier, J., Frolking, S., Lafleur, P., and Roulet, N. T.: Plant biomass and production and CO2exchange in an
om-brotrophic bog, J. Ecol., 90, 25–36, 2002.
Moore, T. R., Roulet, N. T., and Waddington, M. J.: Uncertainty in predicting the effect of climatic change on the carbon cycling of Canadian peatlands, Climatic Change, 40, 229–245, 1998. Price, A. G., Dunham, K., Carleton, T., and Band, L.:
Variabil-ity of water fluxes through the black spruce (Picea mariana) canopy and feather moss (Pleurozium schreberi) carpet in the boreal forest of Northern Manitoba, J. Hydrol., 196, 310–323, doi:10.1016/S0022-1694(96)03233-7, 1997.
Robroek, B. J. M., Schouten, M. G. C., Limpens, J., Berendse, F., and Poorter, H.: Interactive effects of water table and precipita-tion on net CO2assimilation of three co-occurring Sphagnum
mosses differing in distribution above the water table, Global Change Biol., 15, 680–691, 2009.
Roulet, N. T., Lafleur, P., Richard, P., Moore, T., Humphreys, E., and Bubier, J.: Contemporary carbon balance and late Holocene carbon accumulation in a northern peatland, Global Change Biol., 13, 379–411, doi:10.1111/j.1365-2486.2006.01292.x, 2007.
Ryan, M. G.: Effects of climate change on plant respiration, Ecol. Appl., 1, 157–167, 1991.
Silvola, J.: Combined effects of varying water content and CO2
concentration on photosynthesis in Sphagnum fuscum, Holarctic Ecol. 13, 224–228, 1990.
Smith, E.: The influence of light and carbon dioxide on photosyn-thesis, Gen. Physiol., 20, 807–830, 1937.
Tarnocai, C., Canadell, J. G., Schuur, E. A. G., Kuhry, P., Mazhi-tova, G., and Zimov, S.: Soil organic carbon pools in the north-ern circumpolar permafrost region, Global Biogeochem. Cy., 23, GB2023, doi:10.1029/2008gb003327, 2009.
Tenhunen, J. D., Weber, J. A., Yocum, C. S., and Gates, D. M.: De-velopment of a photosynthesis model with an emphasis on eco-logical application, II, Analysis of a data set describing thePm
surface, Oecologia, 26, 101–109, 1976.
Thornton, P., Lamarque, J.-F., Rosenbloom, N., and Mahowald, N.: Influence of carbon-nitrogen cycle coupling on land model re-sponse to CO2fertilization and climate variability, Global Bio-geochem. Cy., 21, GB4018, doi:10.1029/2006GB002868, 2007. Turunen, J., Tomppo, E., Tolonen, K., and Reinikainen, A.: Esti-mating carbon accumulation rates of undrained mires in Finland – application to boreal and subarctic regions, Holocene, 12, 69– 80, 2002.
Wania, R., Ross, I., and Prentice, I. C.: Integrating peatlands and permafrost into a dynamic global vegetation model: 1. Evalu-ation and sensitivity of physical land surface processes, Global Biogeochem. Cy., 23, GB3014, doi:10.1029/2008gb003412, 2009.
Weltzin, J. F., Pastor, J., Harth, C., Bridgham, S. D., Updegraff, K., and Chapin, C. T.: Response of bog and fen plant communities to warming and water-table manipulations, Ecology, 81, 3464– 3478, 2000.
Williams, T. G. and Flanagan, L. B.: Measuring and modelling environmental influences on photosynthetic gas exchange in Sphagnum and Pleurozium, Plant Cell Environ., 21, 555–564, doi:10.1046/j.1365-3040.1998.00292.x, 1998.
Willmott, C. J.: Statistics for the evaluation and comparion of mod-els, J. Geophys. Res., 90, 8995–9005, 1985.