www.biogeosciences.net/8/3231/2011/ doi:10.5194/bg-8-3231-2011
© Author(s) 2011. CC Attribution 3.0 License.
Biogeosciences
Functioning of the planktonic ecosystem on the Gulf of Lions shelf
(NW Mediterranean) during spring and its impact on the carbon
deposition: a field data and 3-D modelling combined approach
P. A. Auger1, F. Diaz2, C. Ulses1, C. Estournel1, J. Neveux3, F. Joux3, M. Pujo-Pay3, and J. J. Naudin3
1Laboratoire d’A´erologie (LA), UMR5560, CNRS – Universit´e de Toulouse, UPS, 14 avenue Edouard Belin, 31400
Toulouse, France
2Laboratoire d’Oc´eanographie Physique et Biog´eochimique (LOPB), CNRS – Aix-Marseille Universit´e, Campus de Luminy,
13288 Marseille, France
3Laboratoire d’Oc´eanographie MICrobienne (LOMIC), CNRS – Universit´e Paris 6, Observatoire Oc´eanologique, BP 44,
66650 Banyuls/Mer, France
Received: 5 October 2010 – Published in Biogeosciences Discuss.: 14 December 2010 Revised: 30 September 2011 – Accepted: 12 October 2011 – Published: 11 November 2011
Abstract. A coupled hydrodynamic-biogeochemical mod-elling is developed to address main mechanisms that drive the particulate organic carbon (POC) deposition in the Gulf of Lions (NW-Mediterranean). Low-salinity water (LSW, salinity<37.5) lenses detached from the Rhone River plume under specific wind conditions tend to favour the biological productivity and provide a good opportunity for validating a planktonic ecosystem modelling. A specific calibration dedicated to river plume ecosystems is then proposed and validated using in situ measurements within such LSW lens (BIOPRHOFI cruise – May 2006) and on the Gulf of Li-ons. During spring 2006, the POC deposition is maximal on the prodelta area and within the coastal area in the Gulf of Lions. Organic detritus mostly contribute to the total POC deposition (82–92 %) whereas the contribution of living or-ganisms (microphytoplankton) appears lower than 17 %. Ex-ploring both influences of terrestrial inputs from the Rhone River and planktonic ecosystems on the POC deposition on the shelf, we estimated that the contribution of terrestrial POM inputs to the total POC deposition is lower than 17 % at the shelf scale during the study period, with maxima during peak discharges of the Rhone River. The main deposition area of terrestrial POC is found in the vicinity of the river mouth in agreement with sediment data. On the other hand, a remarkable influence of marine biological processes on the POC deposition is highlighted further on the shelf (from 60 to 80 m depth). A tight feedback between zooplankton and POM contents in the water column is proposed to explain
Correspondence to: P. A. Auger (pierre-amael.auger@aero.obs-mip.fr)
the control of POC deposition by zooplankton: terrestrial POM inputs would favour the development of living organ-isms through photosynthesis and grazing processes increas-ing the retention of organic matter within the food web. By favouring the development of large-sized zooplankton, LSW lenses may have paradoxically a negative impact on the car-bon deposition on the shelf. In the same way, peak discharges of the Rhone River finally increase the gradient of POC de-position between the prodelta and the offshore area in the Gulf of Lions. The biogenic elements from the Rhone River are then exported further offshore through advection of zoo-plankton communities on the Gulf of Lions shelf.
1 Introduction
River-dominated continental margins are characterized by large supplies of inorganic nutrients and organic materials that support high biological productivity (Lohrenz et al., 2008; Dagg et al., 2004). In such coastal zones, physical pro-cesses and plankton dynamics control the storage and trans-formation of terrestrial materials onto continental shelves to-wards the open sea (Green et al., 2006; Gao and Wang, 2008; Dagg et al., 2008). Besides high organic carbon deposition that occurs on the continental shelf, physical processes also induce an organic carbon export to the open sea. Each river-shelf-ocean system differs from the others, depending on the river inputs variability, anthropogenic impact, and dynamic and topographic physical environment. Moreover, the ongo-ing climate change may modify the atmospheric forcongo-ing and river runoffs, altering ecosystems and biological processes not necessarily in balance (Dagg et al., 2004). Conceptually,
3232 P. A. Auger et al.: Functioning of the planktonic ecosystem on the Gulf of Lions shelf
67 1
Figure 1. Chlorophyll-a concentration (mgChl m-3) from MODIS data on May 19, 2006. 2
3
Fig. 1. Chlorophyll-a concentration (mgChl m−3)from MODIS data on 19 May 2006.
the organic carbon buried in shelf sediments is made of liv-ing phytoplankton and organic detritus of both terrestrial and marine origin, such as dead planktonic cells and zooplankton fecal pellets. An evaluation of the different mechanisms that drive the fate of organic carbon within a continental shelf are then needed to account for potential changes in the carbon cycling at the river-sea connection.
The Rhone River is the major freshwater source of the Mediterranean Sea with runoffs ∼1750 m3s−1 in average (Naudin et al., 1997), which currently makes the Gulf of Lions the most river-impacted coastal area of the Mediter-ranean Sea. Furthermore, extremes of precipitation and of river flow on the French Mediterranean area are likely to be modified in the future due to Climate Change (Quintana-Segu´ı et al., 2011). The current morphology of the Gulf of Lions results from sediment deposits since the last level rise (∼20 000 yr ago). At this long time scale, Got and Aloisi (1990) estimated that 70 % of particulate matter inputs are buried on the shelf whereas 30 % are transported toward the slope and the open sea. Moreover, the fate of organic carbon in the Gulf of Lions has already been addressed by a compilation of sediment data representing different space and time scales (Durrieu de Madron et al., 2000). In this study, an alternative three-dimensional biogeochemical mod-elling is used to further investigate the dynamics of plankton ecosystem and transport of particulate organic matter on the Gulf of Lions shelf.
The Rhone River freshwater plume forms an extended di-lution zone (Morel and Andr´e, 1991; Estournel et al., 2001), which has been defined as a region of freshwater influence (ROFI) by Simpson (1997). Accounting for the ROFI’s characteristics, field surveys have been performed to under-stand the ecosystem functioning along the salinity gradient (Lefevre et al., 1997; Naudin et al., 1997, 2001; Pujo-Pay
et al., 2006). Under specific wind conditions, low-salinity water (LSW) can, for instance, accumulate on the shelf to form confined structures (LSW lenses) propitious for high biological productivity, as shown by TChl-asatellite images (Fig. 1), and for blooms of large-sized phytoplankton (Diaz et al., 2008). Precise biogeochemical measurements were performed in May 2006 within such LSW lenses and fur-ther on the Gulf of Lions (BIOPRHOFI – BIOlogical Pro-cesses in the RHOne Freshwater Influence, see Fig. 2). They provide an opportunity for validating an ecosystem model specifically dedicated to the Rhone ROFI system.
The objective of this paper is to improve our understanding of the mechanisms which control the deposition and export of particulate organic carbon (POC) in the Gulf of Lions. The first section of this paper presents the modelling tool used to carry out this study, with special attention being paid in the model calibration to the more and more severe phosphorus limitation (Ludwig et al., 2009) due to modifications of the Rhone River nutrients inputs impacting the plankton ecosys-tem productivity in the Gulf of Lions (Diaz et al., 2001). The second section details a robust validation of the ecosystem model actually performed using BIOPRHOFI data. The third section describes the organic carbon deposition during spring 2006 and the results of a sensitivity analysis to Rhone River inputs of particulate organic matter. Discussing the latter re-sults, the fourth section focuses on the mechanisms driving the organic carbon deposition in the Gulf of Lions and the precise role of planktonic ecosystems.
2 Material and methods 2.1 Model description
2.1.1 Three-dimensional hydrodynamic model
The three-dimensional (3-D) primitive equations, sigma-coordinate, free surface SYMPHONIE hydrodynamic model used in this work was described in detail by Marsaleix et al. (2008). This model has been primarily used to describe the dynamics of the Rhone River plume and its response to wind forcing (Estournel et al., 1997, 2001; Marsaleix et al., 1998), and also succeeded in reproducing the coastal circu-lation in the Gulf of Lions (Estournel et al., 2003; Petrenko et al., 2008).
[image:2.595.46.286.63.250.2]68
1
Figure 2. Illustration of the embedded strategy (in the top left insert) and localization of the
2
BIOPRHOFI stations (black dots) and the marine reference (black circle) on a salinity field
3
simulated on May 21, 2006 (A). Zoom on the trajectory sampled in the LSW lens (B) from
4
START to END station.
5
[image:3.595.117.484.63.262.2]6
Fig. 2. Illustration of the embedded strategy (in the top left insert) and localization of the BIOPRHOFI stations (black dots) and the marine
reference (black circle) on a salinity field simulated on 21 May 2006 (A). Zoom on the trajectory sampled in the LSW lens (B) from START to END station.
gradients between freshwater plume and surrounding marine water, as observed from space on the chlorophyll contents (e.g. see Fig. 1).
2.1.2 Ecosystem model
The ecosystem model used in this study is built to represent the ecosystem dynamics’ complexity of the North-Western Mediterranean Sea and includes 34 state variables (Fig. 3). This model can be considered as a nutrient and multi-plankton functional types model (Le Qu´er´e et al., 2005) since the biogeochemical cycle dynamics of several biogenic ele-ments (carbon, nitrogen, phosphorus, and silica) and several pelagic plankton groups are simulated. Le Qu´er´e et al. (2005) defined a set of key plankton functional types (PFT) that have to be included in ocean biogeochemistry models to capture important biogeochemical processes in the ocean. Thus, the structure of the model, and precisely the composition of PFT, has been chosen following a thorough analysis of the avail-able experimental knowledge on the biogeochemical func-tioning of the NW Mediterranean Sea (e.g. Ferrier-Pag`es and Rassoulzadegan, 1994; Christaki et al., 1996; Vidussi et al., 2000; Diaz et al., 2001; Avril, 2002; Marty et al., 2002; Moutin et al., 2002; Thingstad and Rassoulzadegan, 1995; Gaudy et al., 2003; Gomez and Gorsky, 2003; Leblanc et al., 2003; Pujo-Pay and Conan, 2003; Charles et al., 2005), as well as previous modelling studies (Tusseau et al., 1997; Babin et al., 2003; Levy et al., 1998; Lacroix and Gr´egoire, 2002; Raick et al., 2005, 2006). Resulting from this analysis, the model compartments are described below.
Three compartments of autotrophs from the smallest to the largest are accounted for: (1) pico-autotrophs, mainly Synechococcus (0.7–2 µm, Phy1in the model); (2)
nanophy-toplankton (2–20 µm, Phy2 in the model) that dominate the
biomass of phytoplankton assemblages for most of the year (Marty et al., 2002; Marty and Chiav´erini, 2010) – this compartment is an assemblage of heterogeneous taxonomic composition (for example autotrophic dinoflagellates); and (3) microphytoplankton community (20–200 µm, Phy3 in
the model) largely dominated by phytoplankton silicifiers (mainly diatoms) that can punctually contribute to a signifi-cant part of primary production and biomass during spring bloom in the NW Mediterranean Sea (Marty et al., 2002; Marty and Chiav´erini, 2010). The main functional role of the latter group lies in their ability to contribute to matter ex-port directly through direct shell and indirectly through fecal pellets sedimentation (via copepods grazing).
Four compartments of heterotrophs from the smallest to the largest ones are considered: (1) picoheterotrophs (mainly bacteria, 0.3–1 µm, Bac in the model) that implicitly reminer-alize dissolved organic matter and can compete, in some spe-cial circumstances, with small phytoplanktons for inorganic nutrients; (2) nanozooplankton (5–20 µm, mainly bacterivo-rous flagellates and small ciliates, Zoo1 in the model) that
consume the small phytoplankton group (<2 µm) and bacte-ria; (3) microzooplankton (20–200 µm, mainly most of cil-iates groups and large flagellates, Zoo2 in the model)
hav-ing characteristics (growth, hav-ingestion rates. . . ) close to the previous group but their preys spectrum being wider espe-cially with potential consumption of microphytoplankton; and (4) mesozooplankton (>200 µm, mainly copepod groups but also including amphipods, Zoo3 in the model) grazing
on the largest categories of plankton (>20 µm, microphyto-plankton and microzoomicrophyto-plankton) and producing fast-sinking fecal pellets.
3234 P. A. Auger et al.: Functioning of the planktonic ecosystem on the Gulf of Lions shelf
69
1
Figure 3. Diagram of the ecosystem model indicating the biogeochemical interactions
2
between the different compartments and the variables which participate to particulate organic
3
matter deposition. Adapted from Herrmann (2010).
4
5
6
7
Fig. 3. Diagram of the ecosystem model indicating the biogeochemical interactions between the different compartments and the variables
that participate to particulate organic matter deposition. Adapted from Herrmann (2010).
Four dissolved inorganic nutrients are considered. For ni-trogen, nitrate and ammonium (Nut1and Nut2in the model)
are distinguished, owing to their differential and high sup-plies by rivers as well as their distinct roles in the functioning of pelagic ecosystem (new vs. regenerated production). Dis-solved inorganic phosphorus considered as phosphate (Nut3
in the model) plays an important role in the control of the primary productivity at some periods of the year (Diaz et al., 2001; Marty et al., 2002). Silicate (Nut4in the model) is also
considered as it can punctually (e.g. at the end of bloom) limit the diatoms growth (Leblanc et al., 2003).
Dissolved organic matter (DOM, under the forms of C, N, and P) is considered in the model as it is consumed by het-erotrophic bacteria and for its importance in exported pro-duction (e.g. process of seasonal accumulation) in the NW Mediterranean Sea (Pujo-Pay and Conan, 2003). However, its potential consumption by the phytoplankton (Pujo-Pay et al., 2006) is not taken into account by the model. Particu-late organic matter (POM, under the forms of C, N, P, Si, and chlorophyll) is divided in two size classes (small<50 µm and large>50 µm, DetS and DetL, respectively, in the model),
differentiated by their sinking velocity.
A realistic modelling of the Rhone River plume ecosys-tem has to account for the effects of terrestrial material inputs on marine ecosystem dynamics. Particulate inorganic matter (PIM) and coloured dissolved organic matter (CDOM) have been shown to contribute significantly to the absorption of light irradiance within the first upper metres of the ocean, all the more in such a river-influenced environment (Babin et al., 2003). A parameterization of the effect of PIM water content on the light absorption (Babin et al., 2003) was then added into the light module of the coupled model (Eq. B2). A con-tribution of CDOM absorption was furthermore introduced from in situ optical measurements (Para et al., 2010) in the Rhone River (Eq. B2).
[image:4.595.102.499.62.399.2]2.1.3 Rhone River inputs
Rhone River inputs of organic and inorganic material were daily monitored in Arles, about 50 km upstream the river mouth, from November 2005 to December 2006. This data set actually provides daily river runoffs as well as nitrate, phosphate, silicate, and particulate inorganic mat-ter inputs (P. Raimbault, personal communication, 2009). Moreover, monthly observations of ammonium and dis-solved organic carbon (DOC) inputs were performed by the French “Syst`eme d’Information sur l’eau du basin Rhˆone-M´editerran´ee” (http://www.rdbrmc.com/cartordbrmc/).
Dissolved organic nitrogen (DON) and phosphorus (DOP) inputs were deduced considering average con-stant ratios, respectively, of DOC:DON = 19.4 (±14.1) and DOC:DOP = 325.3 (±195.9) calculated from daily measure-ments in the Rhone River in 2007–2008 (P. Raimbault, per-sonal communication, 2009), knowing that these ratios are rather high during high river discharge. Particulate or-ganic carbon (POC) inputs were estimated from an empiri-cal linear relationship evidenced with Rhone River runoffs (Semp´er´e et al., 2000), and arbitrarily partitioned between small and large-sized particles considering a domination of dead microalgae (respectively, 90 % and 10 % of total). Par-ticulate organic nitrogen (PON) and phosphorus (POP) in-puts were then deduced considering average constant ra-tios POC:PON = 11.3 (±6.6) and POC:POP = 106.9 (±68.6) measured in the Rhone River in 2007–2008 (P. Raimbault, personal communication, 2009). Large-sized particulate or-ganic silica (POSi) inputs were fixed equal to large partic-ulate organic nitrogen inputs, considering that the pool of freshwater microalgae is dominated by diatoms. Particulate chlorophyll detritus inputs to the open sea, resulting from the osmotic lyses of freshwater phytoplankton species at the river mouth, were finally fixed at a constant value measured in the Rhone (∼3.7 mgChl m−3; Moutin et al., 1998). 2.2 From in situ data to model calibration 2.2.1 Hydrodynamic framework during the
BIOPRHOFI cruise
A field study focused on LSW lenses located off the Rhone River mouth was carried out on board the French R/V Le Suroˆıt during the BIOPRHOFI cruise (BIOlogical Processes in the RHOne Freshwater Influence – 14–28 May 2006). A lagrangian sampling strategy aimed at studying the evolu-tion of the planktonic ecosystem inside LSW lenses detached from the Rhone River plume. A sub-surface Holey-sock buoy, drifting between 5 and 15 m depth, was thus tracked during 107 h (Fig. 2b) covering an area of about 70 square miles (42◦530−43◦030N and 4◦280−4◦390W). Along this tracking, CTD profiles (SBE9/11+) were performed hourly and samples were collected using the CTD-rosette system every 2, 6, or 12 h, depending on the parameters considered.
Additional stations were also sampled further on the Gulf of Lions shelf and slope (Fig. 2a).
During the BIOPRHOFI cruise, the daily Rhone River out-flow ranged from 1239 to 2292 m3s−1with a 3-day peak dis-charge of over 2200 m3s−1from 20–22 May 2006. Low val-ues of salinity firmly confirm the sampling of a LSW lens. According to all the salinity profiles operated hourly during the tracking, two layers have been distinguished in the sam-pled LSW: the surface layer, about 5 m thick with salinity lower than 36.6; and the underlying sub-surface layer, which can extend down to 35 m depth with salinity ranging from 36.6 to 38.25. Deeper, marine water is characterised by a regular increase in salinity with depth up to 38.52 at 200 m depth.
2.2.2 Biogeochemical analysis of BIOPRHOFI data All details on the sampling technique, hydrological data ac-quisition (salinity and temperature), and measurements of nutrients (NO3, NH4, PO4, and Si), dissolved organic carbon
(DOC), total chlorophyll-a(TChl-a, sensu Neveux and Lan-toine, 1993), as well as bacterial abundance and activity are fully described in Joux et al. (2009). HPLC pigment analy-ses (chlorophylls, carotenoids) were also performed on some samples according to the method of Zapata et al. (2000). These analyses enabled assessment of the TChl-a biomass of three size groups of phytoplankton (pico-, nano-, and mi-crophytoplankton according to the average size of the cells) from the pigment grouping methodology proposed by Claus-tre (1994) and Vidussi et al. (2001), and recently improved by Uitz et al. (2006). These in situ phytoplankton biomasses can then be compared to the three aforementioned phyto-plankton size classes (Phy1, Phy2, and Phy3)represented by
the model. In the same way, an analysis of heterotrophic flagellates and ciliates activity and biomass observed during the cruise is presented by Christaki et al. (2009), and inte-grated biomass of copepods were measured by D. Bonnet (personal communication, 2009), allowing the comparison of zooplankton model outputs (resp. Zoo1, Zoo2, and Zoo3)
with in situ measurements.
As shown by Naudin et al. (2001), dilution plots repre-senting salinity against nutrients, dissolved organic matter (DOM), and elemental ratios can provide relevant indica-tions on the biogeochemical characteristics and functioning of such LSW lenses (Figs. 4 and 5). In such figures, a slope line represents the theoretical dilution of river materials in marine water calculated from measurements in the Rhone River (Salinity = 0) and in marine water (black cross). A de-viation from this slope line indicates the influence of biogeo-chemical processes.
All along the buoy tracking (Fig. 2b), the stations sampled in the surface layer (0–5 m) exhibit a large decrease in nitrate by a factor of 10 during the dilution of LSW lens in marine water (Fig. 4). Moreover, nitrate and silicate are consumed in a rather constant ratio, which suggests the development of
3236 P. A. Auger et al.: Functioning of the planktonic ecosystem on the Gulf of Lions shelf
70 1
Figure 4. Nitrate concentrations (A - mmolN m-3) and Nitrate:Silicate ratio (B - mmolN
2
mmolSi-1) vs. Salinity in the surface layer (0-5m) within LSW lens. Black cross indicates the
3
marine reference. The size of the open circles increases along the trajectory (smallest open 4
circle = beginning of the trajectory, largest open circle = end of the trajectory). The slope line 5
is a theoretical dilution line accounting for a simple dilution of freshwater into marine water 6
without any interaction of biological processes (see Naudin et al., 2001). A deviation from 7
this slope line indicates the influence of biogeochemical processes. Values of nutrients under 8
the detection limit are set to the detection limit. 9
10
Fig. 4. Nitrate concentrations (A – mmolN m−3)and nitrate:silicate ratio (B – mmolN mmolSi−1)vs. salinity in the surface layer (0– 5 m) within LSW lens. Black cross indicates the marine reference. The size of the open circles increases along the trajectory (small-est open circle = beginning of the trajectory, larg(small-est open circle = end of the trajectory). The slope line is a theoretical dilution line accounting for a simple dilution of freshwater into marine water without any interaction of biological processes (see Naudin et al., 2001). A deviation from this slope line indicates the influence of biogeochemical processes. Values of nutrients under the detection limit are set to the detection limit.
siliceous phytoplankton in the LSW lens at the surface, as ob-served by Diaz et al. (2008) in a similar environment. On the contrary, a weaker subsurface (5–50 m depth) development of diatoms (not shown) could be due to a lower nutrients and light availability. While depleted at the beginning of the tra-jectory, phosphate contents at the surface increase by a factor of 6 (Fig. 5), which suggests an increasing trend of the recy-cling flux relative to that of uptake during the buoy tracking, already observed by Diaz et al. (2008). This seems to be corroborated by an opposite evolution of the DOC and phos-phate contents (Fig. 5), which indicates a DOC uptake by heterotrophic bacteria actually enabled by phosphate avail-ability in the surface layer. A decrease in bacterial production at the surface all along the trajectory (not shown) finally sug-gests a strong top-down control by ciliates and heterotrophic flagellates on bacteria and small size phytoplankton. Such control mainly exerted by mixotrophs, as shown by Christaki et al. (2009), may also explain why a decrease of NO3:NH4
is everywhere observed in the lens and whatever the mea-sured salinity (not shown). Indeed, the top-down control on bacteria and small size phytoplankton may favour the devel-opment of large phytoplankton, explaining an important con-sumption of nitrate along the trajectory.
71 1
Figure 5. Phosphate (A) and DOC (B) concentrations (resp. mmolP m-3 and mmolC m-3) vs. 2
Salinity in the surface layer (0-5m) within LSW lens. Black cross, size of open circles and 3
signification of the slope line as described in Fig. 4. 4
5
6
[image:6.595.51.284.62.258.2]7
Fig. 5. Phosphate (A) and DOC (B) concentrations (resp.
mmolP m−3and mmolC m−3)vs. Salinity in the surface layer (0– 5 m) within LSW lens. Black cross, size of open circles, and signi-fication of the slope line are described in Fig. 4.
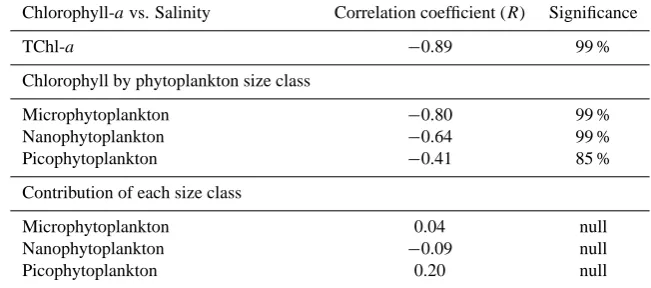
High surface concentrations of microphytoplankton de-fend the latter assumption (Fig. 6). This was confirmed by additional analyses providing the total chlorophyll-a con-tents in the<3 µm and >3 µm fractions for some samples. In the 0–5 m freshwater layer, the>3 µm fraction represents 82–95 % of the total. The total phytoplankton biomass is thus generally dominated by the microphytoplankton class, which represents 70 to 90 % of the total (Fig. 6). Nanophyto-plankton biomass is also higher than that of picophytoplank-ton, which however exhibits non-negligible values regarding the high nutrient environment of sampling. At the subsur-face (not shown), the phytoplankton biomass is also gener-ally dominated, but to a lower extent, by microphytoplank-ton and nanophytoplankmicrophytoplank-ton. Besides, a global decrease of the microphytoplankton biomass is observed during the di-lution of LSW lens in marine water (Fig. 6). This somehow suggests an increasing competition between phytoplankton species for resources in an almost nutrient-depleted environ-ment at the end of the trajectory (Fig. 4). On the whole, the total chlorophyll-a contents are then found anti-correlated to salinity (Pearson’s correlation coefficient of −0.89, p <
0.01). Significant anti-correlation are also found between each phytoplankton size class and salinity (Table 1) and be-sides increasing with the plankton size, in agreement with the usual observation of more abundant large-sized phytoplank-ton in high nutrient and low salinity environment (Sarthou et al., 2005). On the other hand, the proportions of each phy-toplankton size class to the total biomass are not correlated to salinity, suggesting that the structure of the plankton com-munity is not constrained by dilution (e.g. Table 1).
[image:6.595.307.540.66.251.2]72 1
Figure 6. Chlorophyll concentration in the surface layer (0-5m) by phytoplankton size class 2
(mgChl m-3) vs. Salinity along the BIOPRHOFI trajectory in the LSW lens (see Fig. 2B). 3
4
Fig. 6. Chlorophyll concentration in the surface layer (0–5 m) by
phytoplankton size class (mgChl m−3)vs. salinity along the BIO-PRHOFI trajectory in the LSW lens (see Fig. 2b).
the biogeochemical and ecological characteristics of LSW lenses (Diaz et al., 2008). Depending on wind conditions, these diluted water masses can detach from the river plume and evolve sometimes over hundreds of kilometres south-westward as shown by satellite images (Bosc, 2002). Con-sidering that such LSW lenses have also been observed in other ROFIs through field data or remote sensing observa-tions (Schumacher et al., 1993; Gilbes et al., 2002; Ressler and Jochens, 2003), the present data set is an opportunity for building and validating beyond the Gulf of Lions a biogeo-chemical modelling of the planktonic ecosystem dynamics for such marine environment.
2.2.3 Calibration of the ecosystem model
Several recent biogeochemical modelling works of the Mediterranean Sea and Black Sea ecosystems exhibit sig-nificant phytoplankton biomass underestimations in coastal nutrient-rich zones, while the phytoplankton fields simulated offshore in both basins are in better agreement with remote sensing observations: see, for example, the Pˆo River dilu-tion zone in the Adriatic Sea (Polimene et al., 2006) and that of the Danube River in the Black Sea (Gr´egoire et al., 2004). The main reason for such performances invoked in these studies is the use of parameters rather unadapted to such nutrient-rich environments. To avoid this bias, a set of parameters specially dedicated to the Rhone River plume en-vironment has been designed considering the plume-specific diversity of plankton communities (e.g. bold parameters in Table A5) as well as the high but unbalanced nutrient inputs from the river (Moutin et al., 1998; Bianchi et al., 1999; Joux et al., 2005; Ludwig et al., 2009).
A first characteristic concerns the macro-nutrient avail-ability in river freshwater and the corresponding N:P ratios in marine phytoplankton. Nutrient measurements in the Rhone River from November 2005 to December 2006 (P. Raimbault, personal communication, 2009) reported DIN:DIP ratios al-ways higher than 34.8 (86.9 in average), suggesting a strong phosphate control of the biological activity near the river mouth. In such P-limited conditions, very fast P turnover rates or regeneration rates might allow phytoplankton to take up and store additional N in excess of the Redfield ratio without increasing the algal biomass (Yin et al., 2004). In this context, the maximal N:C and P:C quotas were chosen high and low, respectively, for all phytoplankton size classes. Earlier phosphate consumption by bacteria rather than phy-toplankton was observed close to the river mouth (Cotner and Wetzel, 1992; Pujo-Pay et al., 2006), bacterioplankton also taking advantage of a large supply in DOC. As a conse-quence, the maximal P:C quota was chosen higher for bacte-ria than for phytoplankton.
Although experimental estimations of half-saturation con-stant for phosphate-uptake by phytoplankton remain scarce, Timmermans et al. (2005) reported values between 0.014 and 0.094 mmol m−3 for picophytoplankton. Further-more, Tyrrell and Taylor (1996) used values of 0.05 and 0.1 mmol m−3 (resp. for Emiliania huxleyi and diatoms) in a modelling study of the NE Atlantic. To represent a dras-tic P-limitation of phytoplankton assemblage, half-saturation constants for phosphate uptake were fixed one order of mag-nitude above those of the aforementioned literature, while that of bacteria was set at an average value (Thingstad, 2005). Moreover, the model of Geider et al. (1998) used in the pho-toacclimation module of our model shows Chl:N internal ra-tios increasing with decreasing growth rates. Thus, the Chl:N maximal quotas were chosen increasing from pico- to nano-and microphytoplankton, which remain the most phosphorus limited.
Finally, microzooplankton and mesozooplankton grazing rates were adapted to fit observed zooplankton biomass. Mi-crozooplankton maximum grazing rate was set to a relatively high value in agreement with high ingestion rates observed in the Rhone River plume (Christaki et al., 2009). On the contrary, the maximum grazing rate of mesozooplankton was fixed to a very low value according to in situ measurements from Gaudy et al. (1990).
3 Validation of the ecosystem modelling
A statistical analysis was carried out to evaluate the per-formances of the model to represent temperature, salinity and biogeochemical observations. The correlation coeffi-cient was traditionally calculated (R=0 non relationship,
R=1 perfect fit; Fig. 7a), with the significant threshold for each variable (white diamonds). The bias was also calculated (Fig. 7b) as well as the ratio of standard deviation of the data
[image:7.595.51.284.63.252.2]3238 P. A. Auger et al.: Functioning of the planktonic ecosystem on the Gulf of Lions shelf
Table 1. Statistical analysis of the relationship between salinity and total chlorophyll-aconcentration, chlorophyll-aconcentration in each phytoplankton size class, and contribution of each size class to total chlorophyll-aconcentration: the significance of the Pearson’s correlation coefficients (R) are calculated from the Pearson table and the number of samples (Sokal and Rohlf, 1995).
Chlorophyll-avs. Salinity Correlation coefficient (R) Significance
TChl-a −0.89 99 %
Chlorophyll by phytoplankton size class
Microphytoplankton −0.80 99 %
Nanophytoplankton −0.64 99 %
Picophytoplankton −0.41 85 %
Contribution of each size class
Microphytoplankton 0.04 null
Nanophytoplankton −0.09 null
Picophytoplankton 0.20 null
to model (RSD, Fig. 7c), which illustrates the differential dis-persion between model outputs and data. As previously used in some modelling studies (e.g. Allen et al., 2007), the cost function score was also computed (CF, Fig. 7d) to assess the model data misfits compared with the standard deviation of the data: CF<1 = very good, 1–2 = good, 2–3 = reasonable,
>3 = poor; see Radach and Moll (2006). 3.1 Validation of the hydrodynamic model
According to salinity measurements, the vertical structure of the sampled LSW lens is composed of three distinct lay-ers, which are accurately represented by the hydrodynamic model (not shown). Moreover, comparison of salinity model outputs against data shows a correct representation of the salinity gradient and freshwater plume extension (Fig. 8a). The statistical scores indicate a significant correlation coeffi-cient, low percent bias, and very good RSD and cost function scores (Fig. 7). The large number of samples (238) gives even more significance to these statistics. Regarding tem-perature (Fig. 8b), scores are globally very good despite an underestimation of simulated temperatures (∼0.4◦C). How-ever, the density distribution inside the river plume being mostly driven by salinity (Marsaleix et al., 1998), this bias has very little influence on this buoyant structure hydrody-namics’. Moreover, such a temperature underestimation cor-responds to a 2.8 % underestimation of theQ10temperature
function (see Eq. A57) and has then little effect on biogeo-chemical processes. In conclusion, both spatial extension and temporal evolution of the freshwater dilution area are accurately represented by the hydrodynamic model, both in terms of salinity and of temperature. This is actually an im-portant asset for a robust modelling of the ecosystem dynam-ics in the area.
3.2 Validation of the ecosystem model
Considering the spatial errors inherent to the coupled hydrodynamic-ecosystem model, an accurate point-by-point spatial comparison between ecosystem model outputs and field observations appeared definitely unsuitable. Since freshwater distribution has been demonstrated to mostly con-trol the biogeochemical processes within the plume (Naudin et al., 2001), an additional salinity criterion was consid-ered to produce the ecosystem model validations. Inside of 20 km square boxes centred on each BIOPRHOFI sta-tion, only model cells which answered to the criterion “|Salinitymodel−Salinityobservation|<0.25” were selected.
The corresponding biogeochemical values were then aver-aged and compared to measured data through both a visual analysis (stocks in Fig. 9 and fluxes in Fig. 10) and an ap-proach based on statistical scores (Fig. 7; e.g. Allen et al., 2007). By the way, a sensitivity test was conducted to assess the little influence of box size on the model/data comparison (not shown).
3.2.1 Stocks outputs
Model outputs of NO3and PO4concentrations fit quite
cor-rectly to in situ measurements (Fig. 9), which is confirmed by significant correlation coefficients (Fig. 7a). The model shows lower performances for reproducing NH4
concen-trations. Hence, cost function (Fig. 7d) and RSD scores (Fig. 7c) are good to very good except for ammonium. De-spite an overestimation of DIN (NO3+ NH4)concentrations
73
1
Figure 7. Model performance statistics: correlation coefficient (A), model bias (B), cost
2
function (C), ratio of standard deviation (D). White diamonds indicate the correlation
3
significance at 95% depending on the number of samples.
4
5
Fig. 7. Model performance statistics: correlation coefficient (A), model bias (B), cost function (C), ratio of standard deviation (D). White
diamonds indicate the correlation significance at 95 %, depending on the number of samples.
As attested by a significant correlation coefficient and very good cost function and RSD scores (Fig. 7), DOC concentra-tions appear correctly represented by the model. DON out-puts show a significant correlation coefficient, a good cost function score, but a poor RSD score; on the contrary, DOP concentrations are on the whole weakly represented (Fig. 9), as shown by a negative correlation coefficient and very poor cost function score (Fig. 7). Whereas DOC concentrations are underestimated (bias∼−10 %), both DON and DOP con-centrations are overestimated (resp. bias∼+20 % and +50 %) maybe due to inaccurate Rhone River loads in the model. Otherwise, the balance between phytoplankton exudation and bacterial consumption of dissolved organic matter could be rather correctly represented regarding carbon, but poorly regarding nitrogen and phosphorus. The effective coupling of exudation and uptake processes in the model could lead
to overestimate both nitrogen and phosphorus exudation by phytoplankton (see Eq. A26) since phytoplankton groups growing at the maximal N:C and P:C quotas (not shown) ap-pear to be nitrogen- and phosphorus-replete in the LSW lens. Finally, Naudin et al. (2001) pointed out a potential alteration of microbial assemblages along the salinity gradient, actu-ally confirmed by the analysis of BIOPRHOFI data (Joux et al., 2009). Very poor statistical scores for bacterial biomass (no correlation and bias∼−40 %) could reflect a too sim-plistic representation of bacterial communities in the model. A modification in the balance for biogenic elements needs by bacteria could therefore explain such overestimations of DON and DOP concentrations.
The three phytoplankton functional groups and the to-tal chlorophyll-a (TChl-a) contents are visually well pre-dicted by the model (Fig. 9), resulting in reasonable to
[image:9.595.59.542.67.471.2]3240 P. A. Auger et al.: Functioning of the planktonic ecosystem on the Gulf of Lions shelf
74 1
Figure 8. Comparison between observations and model outputs for salinity (A) and 2
temperature (B - °C). 3
[image:10.595.123.471.64.337.2]4
Fig. 8. Comparison between observations and model outputs for salinity (A) and temperature (B –◦C).
good statistical scores (Fig. 7). However, pico- and nanophytoplankton exhibit some underestimated values (bias
∼−20 %), whereas microphytoplankton and finally total chlorophyll biomass can be largely overestimated on some samples (bias>+40 %).
Despite excellent RSD and reasonable cost function scores, the model does not catch the variability of the nanozooplankton biomass (Fig. 9), as model outputs are found anti-correlated with data and exhibit marked over-estimations (Fig. 7, bias >+40 %) at low concentrations (∼1 mmolC m−3)and underestimations at high concentra-tions. Microzooplankton is parameterized to partly feed on nanozooplankton and may contribute to the nanozooplankton overestimation in the LSW lens, but diverse sensibility tests on the microzooplankton feeding preferences did not im-prove the results. In spite of a very good cost function score, the simulated microzooplankton biomass is found weakly correlated maybe due to a misrepresentation of predation processes. Nevertheless, the order of magnitude is in agree-ment with the measured data range (bias<−10 %). Besides, the mesozooplankton biomass is also found insignificantly correlated to data despite very good cost function scores and low bias on both trajectories (bias<+10 %). Both processes of vertical migration and aggregation are not considered in the model and could explain such discrepancy. Extreme val-ues are not well simulated, mesozooplankton biomass ap-pearing limited to a threshold of∼0.3 mmolC m−3. The use
of a closure term to simulate mesozooplankton consumption by higher trophic levels (see Eq. A44) could additionally in-duce a too strong control of mesozooplankton biomass within the LSW lens, as already attested by Mitra (2009).
75 1
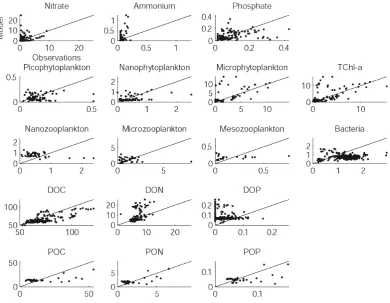
Figure 9. Comparison between observations (x-axis) and model outputs (y-axis) of 2
biogeochemical stocks measured during the BIOPRHOFI cruise. Units are mmol m-3 for 3
nutrients (expressed in N, P), mgChl m-3 for phytoplankton, mmolC m-3 for zooplankton and 4
bacteria, and mmol m-3 for dissolved and particulate organic matter (expressed in C, N, P). 5
[image:11.595.105.496.64.367.2]6
Fig. 9. Comparison between observations (x-axis) and model outputs (y-axis) of biogeochemical stocks measured during the BIOPRHOFI
cruise. Units are mmol m−3for nutrients (expressed in N, P), mgChl m−3for phytoplankton, mmolC m−3for zooplankton and bacteria, and mmol m−3for dissolved and particulate organic matter (expressed in C, N, P).
76 1
Figure 10. Comparison between observations (x-axis) and model outputs (y-axis) of bacterial 2
production (A - mgC m-3 d-1) and primary production (B - mgC m-3 d-1) measured during the 3
BIOPRHOFI cruise. 4
5
Fig. 10. Comparison between observations (x-axis) and model
out-puts (y-axis) of bacterial production (A – mgC m−3d−1)and pri-mary production (B – mgC m−3d−1)measured during the BIO-PRHOFI cruise.
77 1
Figure 11. Comparison between observed and simulated vertical profiles of particulate 2
organic carbon concentrations (mmolC m-3) in the LSW lens.
3
4
Fig. 11. Comparison between observed and simulated vertical
pro-files of particulate organic carbon concentrations (mmolC m−3)in the LSW lens.
[image:11.595.50.283.433.638.2] [image:11.595.305.548.454.650.2]3242 P. A. Auger et al.: Functioning of the planktonic ecosystem on the Gulf of Lions shelf 01/0 4 10/0 4 20/0 4 30/0 4 10/0 5 20/0 5 30/0 5 10/0 6 20/0 6 30/0 6 10/0 7 0 500 1000 1500 2000 2500 3000 3500 4000 R h o n e R iv e r ru n o ff s A 0 10 20 30 40 50 60 R a te o f P O C d e p o si tio n P hytoC S mall P OC Large P OC T otal P OC
[image:12.595.64.272.62.599.2]01/0 4 10/0 4 20/0 4 30/0 4 10/0 5 20/0 5 30/0 5 10/0 6 20/0 6 30/0 6 10/0 7 B -10 0 +10 +20 +30 +40 +50 "R E F n o P O M " (% ) 01/0 4 10/0 4 20/0 4 30/0 4 10/0 5 20/0 5 30/0 5 10/0 6 20/0 6 30/0 6 10/0 7 C P hytoC S mall P OC Large P OC T otal P OC
Fig. 12. Rhone River runoffs (A – m3s−1), daily particulate or-ganic carbon deposition rate averaged on the Gulf of lions shelf (B – mgC m−2d−1), and normalized difference between daily particu-late organic carbon deposition rates from reference and “noPOM” simulations (C – in %) from 1 April to 15 July 2006. Yellow stripe = BIOPRHOFI period.
79 1
2
Figure 13. Map of the particulate organic carbon deposition simulated by the model and 3
cumulated from April 1st to July 15, 2006 (mgC m-2). 4
5
Fig. 13. Map of the particulate organic carbon deposition
simu-lated by the model and cumusimu-lated from 1 April to 15 July 2006 (mgC m−2).
3.2.2 Flux outputs
The prediction of the transfer of carbon toward sediments and/or higher trophic levels requires a realistic assessment of carbon consumption (bacterial production) and gross pri-mary production (photosynthesis) by the model. First, the bacterial growth is only supported by the bacterial production (fraction of the DOC uptake, see Eq. A6) in the biogeochem-ical model. While bacterial biomass is poorly represented (see above), simulated fluxes show a reasonable agreement with those observed (Fig. 10a) as confirmed by a significant correlation coefficient and very good cost function and RSD scores (Fig. 7); the computation of bias however shows a slight underestimation (bias ∼−20 %). Second, simulated gross primary production rates by marine phytoplankton vi-sually fit to data (Fig. 10b) as confirmed by a significant correlation coefficient, very good RSD (close to 1) and cost function score (Fig. 7). The overall trend is however an over-estimation of carbon fixation with a mean bias of∼+45 %.
4 Results
[image:12.595.310.546.66.236.2]80 1
Figure 14. Map of the normalized difference cumulated from April 1st to July 15, 2006 2
between the particulate organic carbon deposition from reference and “noPOM” simulations 3
(in %). 4
5
Fig. 14. Map of the normalized difference cumulated from 1 April
to 15 July 2006 between the particulate organic carbon deposition from reference and “noPOM” simulations (in %).
4.1 POC deposition on the Gulf of Lions
It is assumed that the POC deposition rate is a function of the particulate organic carbon concentration near the bottom and its settling velocity. The pool of particulate organic carbon involved in this process is composed of microphytoplankton (hereafter PhytoC) as well as small and large organic detritus (DetSand DetLin the model, hereafter SPOC and LPOC) of
terrestrial or marine origin (see Eqs. A7 and A10).
The map of the POC deposition cumulated during the study period (Fig. 13) shows that the transfer to the sedi-ment is mainly located near the coast from the Rhone River mouth to the south-western exit of the Gulf of Lions. The mean cyclonic circulation actually induces the concentration of plume-originated material and its transport along the coast until reaching the deep sea. Spatially (not shown), the LPOC contribution is very limited to the river mouth vicinity. On the contrary, both SPOC and phytoplankton contributions mostly concern the entire shelf. As total POC (Fig. 13), both phytoplankton and SPOC contributions are found maximum between 20 and 50–70 m depth, in agreement with high ac-cumulation rates and high organic carbon contents observed in shelf sediments from 30 to 50 m depth (Durrieu de Madron et al., 2000). The model results also corroborate the along-shore predominant dispersion of the terrestrial material from the Rhone River, described from long-term data by Got and Aloisi (1990).
Durrieu de Madron et al. (2000) assessed the contributions of river supply, atmospheric depositions, and primary pro-duction and estimated the total deposition of particulate or-ganic carbon on the Gulf of Lions shelf (depth<200 m) in the range 20–67 mgC m−2d−1. This range is assessed at a secular scale and cannot represent seasonality and extreme events such as peak discharges acting at a daily scale.
Nev-ertheless, they are very close to our simulated values of or-ganic carbon deposition rates averaged over the Gulf of Li-ons shelf lying in the range 36–58 mgC m−2d−1 from 1 to
15 July 2006 (Fig. 12b).
During the study period, the daily total POC deposition on the shelf is dominated by the SPOC contribution (50–80 %), and then most of the time by the LPOC contribution (12– 37 %). The phytoplankton contribution is globally weaker (8–17 %), albeit it could punctually overcome the LPOC con-tribution (8 to 17 June). Peak discharges of the Rhone River up to 17 April clearly favour the LPOC contribution (Fig. 12a and b) when SPOC contributions are precisely found mod-erate. On the contrary, the phytoplankton contribution re-sponds slowly to river nutrients loads so that their contribu-tion turns maximal (9–11 June) when river runoffs weaken. 4.2 Influence of terrestrial POM inputs on POC
deposition
A sensitivity test is carried out to evaluate the influence of terrestrial inputs on the total POC deposition on the Gulf of Lions shelf. The Rhone River inputs of all types of particu-late organic matter (DetS and DetLin the model, expressed
in C, N, and P) are switched off (hereafter “noPOM” simu-lation). The outputs of POC deposition on the shelf from the “Reference” simulation are then compared to the results of the “noPOM” simulation in terms of normalized differences (%). The map of cumulated differences during the study pe-riod (Fig. 14) shows a positive pattern in the close vicinity of the Rhone River mouth extending over 30 km until 200 m depth. The prodelta region is the main deposition area of ter-restrial POC in the model, which is in agreement with numer-ous previnumer-ous studies (Calmet and Fernandez, 1990; Durrieu de Madron et al., 2000; Tesi et al., 2007). On the contrary, one could expect that such positive influence of terrestrial POM inputs on POC deposition would concern the entire Gulf of Lions. However, a negative pattern of greater ex-tension and same order of magnitude is clearly evidenced on the shelf from 50 to 500 m depth (Fig. 14). This pattern is of maximum intensity between 50 and 80 m depth alongshore, actually bordering the pattern of maximum POC deposition (Fig. 13). Such negative retroaction probably involves a re-action of the pelagic ecosystem dynamics to terrestrial POM inputs by the Rhone River.
The difference between the “Reference” and “noPOM” simulations was spatially averaged on the Gulf of Lions shelf (hereafter “signature”) and its time evolution was confronted to that of Rhone River runoffs (Fig. 12a and c). Phyto-plankton, small and large particulate organic carbon (here-after PhytoC, SPOC, and LPOC) contributions are differen-tiated to further evaluate the key factors actually controlling the total organic carbon deposition.
Results first show an increasing contribution of terres-trial POC to the total POC deposition during peak dis-charges (Fig. 12a and c), which can be explained by the
[image:13.595.52.285.64.245.2]3244 P. A. Auger et al.: Functioning of the planktonic ecosystem on the Gulf of Lions shelf linear dependence between Rhone River runoffs and
terres-trial POC inputs in the model (Semp´er´e et al., 2000). Ter-restrial inputs appear responsible for a net 20 % maximum increase of the total POC deposition at the whole shelf scale (Fig. 12c), split in maximal contributions of SPOC (+5 %) and LPOC (+50 %). We estimate that this corresponds to a 17 % maximum contribution of terrestrial POM inputs to the total POC deposition. The positive pattern previously evi-denced in the prodelta region (Fig. 14) is actually involved in this feature, as the total POC deposition in this region is mostly controlled by the terrestrial inputs from the Rhone River (Durrieu de Madron et al., 2000).
On the contrary, some biogeochemical mechanisms could be responsible for a negative influence of terrestrial inputs on POC deposition involving first, phytoplankton all along the study period (Fig. 12c); and second, particulate organic carbon (mainly SPOC) following peak discharges (Fig. 12a and c).
The presence of terrestrial POM inputs clearly reduces phytoplankton deposition. This is in apparent contradic-tion with the important remineralizacontradic-tion of terrestrial organic matter on the Gulf of Lions shelf (Durrieu de Madron et al., 2000) that should favour in fine the phytoplankton develop-ment. Therefore, a greater biomass of zooplankton exerting a stronger grazing pressure on phytoplankton could explain a lower deposition from phytoplankton origin (see Eq. A1).
The signature of total POC deposition generally turns neg-ative several days after a peak discharge. Although weakly marked in early May after the peak discharge of 12 April, it appears clearly after the last peak of 23 May since the signa-ture remains negative for more than one month from 26 May. This shift to negative signature is mainly attributable to the negative signatures of PhytoC (see above) but also of SPOC, and to a lesser extent of LPOC deposition. This behaviour actually explains the negative spatial pattern found on the western part of the shelf (Fig. 14). The reason for such sig-natures of SPOC and LPOC depositions may be found either in an increase of the grazing loss term or a decrease of the source terms, which are plankton mortality and zooplankton production of fecal pellets (see Eqs. A7 and A10).
Out of the prodelta area, the response of POC deposition to terrestrial inputs appears complex, suggesting a major role of biological processes, especially during a calm period fol-lowing a period of peak discharge that stimulated biological activity (e.g. after 23 May, Fig. 12a). At the scale of the whole shelf, this effect is probably masked during peak dis-charge events transporting high contents of terrestrial inputs. This could explain that the negative impact of the first peak discharge of April is not visible since a new peak of terres-trial inputs arises a few days after.
81 1
Figure 15. Normalized differences (in %) of phytoplankton (only microphytoplankton), 2
zooplankton (all zooplankton size classes), large and small particulate organic carbon stocks 3
between reference and “noPOM” simulations. Surface (A - 0-25m depth) and bottom layers 4
(B - 25m to bottom) are considered separately for each stock. 5
Fig. 15. Normalized differences (in %) of phytoplankton (only
microphytoplankton), zooplankton (all zooplankton size classes), large and small particulate organic carbon stocks between reference and “noPOM” simulations. Surface (A – 0–25 m depth) and bot-tom layers (B – 25 m to botbot-tom) are considered separately for each stock.
4.3 Influence of terrestrial POM inputs on POM contents in the water column
[image:14.595.342.511.64.354.2]82 1
2
Figure 16. Sensitivity analysis of the model results to micro- and mesozooplankton grazing 3
rates (UP = +50% and DOWN = -50% of grazing rates reference), considering the normalized 4
difference between reference and “noPOM” simulations (%) of the daily particulate organic 5
carbon deposition rates averaged on the Gulf of Lions shelf. 6
7
8
9
Fig. 16. Sensitivity analysis of the model results to micro- and
mesozooplankton grazing rates (UP = +50 % and DOWN =−50 % of grazing rates reference), considering the normalized difference between reference and “noPOM” simulations (%) of the daily par-ticulate organic carbon deposition rates averaged on the Gulf of Li-ons shelf.
At the surface (Fig. 15a), the evolution of both SPOC and LPOC signatures follows the Rhone River runoffs (Fig. 12a) and reaches two maxima (1–18 April and 12–21 May) corre-sponding to peak discharges of the Rhone River. In the same way, the zooplankton signature exhibits two peaks (22 April and 30 May), actually following similar peaks of SPOC and LPOC signatures (∼17 April and∼22 May). As a conse-quence, the zooplankton dynamics in the 0–25 m layer ap-pears mostly driven by SPOC dynamics (LPOC being not a food resource for zooplankton in the model).
The phytoplankton signature is different and exhibits a se-ries of alternatively negative and slightly positive peaks. Pri-marily found positive, it increases in the same way that both zooplankton and POC signatures from 1 to 10 April. The remineralization rates of particulate organic matter are prob-ably very high on the Gulf of Lions (Durrieu de Madron et al., 2000), and the phytoplankton would benefit from such an additional source of nutrients. This feature so empha-sizes a positive influence exerted by terrestrial POM inputs on the phytoplankton growth through remineralization pro-cesses (bottom-up control). On the contrary, from 10 April to the end of the study, the phytoplankton signature exhibits alternatively negative and positive peaks opposed to those of zooplankton. The phytoplankton growth is probably still favoured by terrestrial inputs of organic matter.
Neverthe-less, the zooplankton grazing pressure also increases (see above) and might finally end up controlling the phytoplank-ton growth through a usual top-down control.
In the bottom layer (Fig. 15b), the zooplankton signature is systematically positive all along the study period. Such sig-nature seems primarily driven by a positive sigsig-nature of food stocks near the bottom, namely phytoplankton and SPOC. The positive influence of terrestrial POM inputs on the zoo-plankton biomass therefore extends on the whole water col-umn. The LPOC signature is clearly positive in the bottom layer during the Rhone River peaks discharge and that of SPOC is also positive from 10 April to 12 May. In the same way, the phytoplankton signature is found positive at the very beginning of the study period (1 to 10 April), most probably enhanced by remineralization processes of terrestrial POM, as already suggested at the surface. After this initial phase of positive signatures, both phytoplankton and SPOC signa-tures turn negative in the bottom layer until the end of the study period. According to this evolution pattern, zooplank-ton could be primarily influenced by terrestrial POM inputs and then control both phytoplankton and SPOC contents in the water column. In other words, zooplankton would re-spond to terrestrial POM inputs near the river mouth and, in turn, zooplankton would control the POM contents (mostly of marine origin) further on the shelf and ultimately the depo-sition rates. This effect of trophic cascading would therefore explain the negative pattern of POC deposition previously found on the shelf (Fig. 14).
The latter results crucially depend on the model param-eters that control the large zooplankton grazing rates and biomass. We then processed a sensitivity analysis of our results to the micro- and mesozooplankton grazing rates (±50 % of the reference value). Figure 16 presents the re-sults of this sensitivity analysis considering the difference of POC deposition rates averaged on the Gulf of Lions shelf between “Reference” and “noPOM” simulations (previously presented on Fig. 12c). The results remain weakly modified by a modification of the mesozooplankton grazing rate, but they appear more sensitive to the microzooplankton grazing rate. This somehow suggests a stronger control exerted by this zooplankton size class on the POC deposition rates in the model. An explanation for such feature can be actually found in both higher biomass and maximum grazing rate parameter for micro- than for mesozooplankton. Thus, a decrease of the microzooplankton grazing rate seems to reduce the feed-back between zooplankton and POM terrestrial inputs. Nev-ertheless, the paradoxical negative signature following peak discharges from the Rhone River (see Sect. 4.2) appears con-sistent and thus ensures the robustness of our analysis.
5 Discussion
The ecosystem productivity of the Rhone River plume and the hydrodynamic environment of the Gulf of Lions are
[image:15.595.48.289.64.322.2]3246 P. A. Auger et al.: Functioning of the planktonic ecosystem on the Gulf of Lions shelf relatively well known (Naudin et al., 2001; Diaz et al., 2008;
Estournel et al., 2003). However, the mechanisms that drive the deposition of particulate organic carbon on the Gulf of Lions shelf remain poorly addressed. The quantitative mod-elling tool is used in science to improve our understanding of the natural world (Oreskes, 2003). Thus, following a heuris-tic approach and beyond simply evaluating the deposition of organic carbon on the Gulf of Lions shelf during spring, our efforts focused on better understanding the key factors that actually control the organic carbon sedimentation on the shelf. By the modelling approach we developed, the roles of Rhone River inputs and plankton dynamics in the control of organic matter fluxes in the water column have been investi-gated. Our results consistently suggest an important role of zooplankton in controlling the organic carbon deposition on the shelf.
5.1 Zooplankton control on POC deposition
According to our results, the POC deposition on the Gulf of Lions shelf depends on the control exerted by zooplankton on the POM contents in the water column. Zooplankton is at the interface between river and marine environments and can be considered as a key energetic link in the food web of river plumes (Breed et al., 2004). The consumption of fresh marine phytoplankton, as well as organic detritus of terrestrial and marine origins, leads to increased zooplankton biomass in plume environments in agreement with previous observations (Turner and Tester, 1989; Dagg et al., 2004). In the Gulf of Lions, the spatial distribution of zooplankton biomass then appears mostly constrained by the enrichment effect of Rhone River inputs contrasting with the oligotrophic influence of the Northern Mediterranean Current (Gaudy et al., 2003).
The observations of Gaudy et al. (2003) show a dominat-ing trophic mode of herbivory near the coast for zooplankton (both micro- and mesozooplankton size classes) then evolv-ing to omnivory in the offshore areas of the Gulf of Lions. Hence, in the Rhone River plume, zooplankton has been shown to consume mostly “fresh” carbon fixed by marine phytoplankton, rather than POM of marine and terrestrial ori-gin (Pagano et al., 1993; Gaudy et al., 2003). In fact, the feeding strategy of zooplankton probably responds to the car-bon richness of surrounding waters since the shift from her-bivorous to omnivorous feeding (carnivorous, detritivorous, etc.) has been evidenced between carbon-rich coastal water and Northern Mediterranean Current oligotrophic water at a fixed station off Marseille (Van Wambeke et al., 1996). On the whole, phytoplankton could provide up to 90 % of the di-etary carbon of mesozooplankton feeding in plume regions (Schlacher et al., 2009).
Then terrestrial organic matter would be of little direct nu-tritional importance to zooplankton in plume water. How-ever, the study of Gaudy et al. (2003) also shows that zoo-plankton (both micro- and mesozoozoo-plankton) can punctually
make an additional consumption of terrestrial POM to sup-ply the necessary energy for its growth, especially during the spring period. In this study, a significant correlation between zooplankton biomass and POC contents at the scale of the whole gulf has been shown, suggesting a rather omnivorous trophic behaviour during this period. These observed fea-tures support our results of a significant consumption of ter-restrial POM inputs by zooplankton in the river plume during the study period (Fig. 15).
According to our study, zooplankton is favoured by terres-trial POM inputs and high biological productivity within the plume. In turn, zooplankton reduces the phytoplankton and POC contents in the water column, and then the total POC deposition rates on the Gulf of Lions shelf. As already stated by Dagg et al. (2004), in marine areas under freshwater in-fluence, the conversion of POM in living organisms through an omnivorous behaviour of zooplankton actually increases the retention of organic matter in the food web and bypasses the bacterial remineralization. Moreover, the observations of Pagano et al. (1993) and Van Wambeke et al. (1996) on the metabolic O:N ratios measurements of mesozooplankton in the Rhone River plume area show a shift from herbivory within the plume layer to omnivory in marine water under the plume. These observations support our modelled results, which show an accentuated control of POC contents near the bottom by zooplankton.
5.2 POC deposition on the shelf
At the shelf scale, the organic carbon deposition is largely due to organic detritus (SPOC + LPOC) since their bution is estimated to range from 82 to 92 %. The contri-bution of living organisms (microphytoplankton) finally re-mains limited at an average of 13 % with a maximum of 17 % under specific conditions. Moreover, the model could under-estimate the POC contribution and overunder-estimate the phyto-plankton contribution (see Sect. 3.2.1).
At first order, the time evolution of the organic carbon de-position follows the river runoffs (Fig. 12a and b). This could be especially true for the prodelta area where the organic car-bon deposition is mainly constituted of terrestrial material (Cathalot et al., 2010), mostly LPOC in the model. As high-lighted by the results of our sensitivity analysis (Fig. 14) and in agreement with sedimentological data (Durrieu de Madron et al., 2000), terrestrial organic particles quickly sink on the prodelta area, remaining barely available for zooplankton consumption (Schlacher et al., 2009). Moreover, the phy-toplankton growth is mostly inhibited near the river mouth (Naudin et al., 2001). For these reasons, the deposition of marine organic material is limited in this region.
POC deposition further on the Gulf of Lions shelf. The role of zooplankton, as highlighted by our results, is then likely to be significant. Nutrient loads induced by the Rhone River discharge first stimulate phytoplankton growth in the region of freshwater influence, enhancing high primary productiv-ity and phytoplankton biomass (Naudin et al., 2001), as also observed in other plume regions (Dagg et al., 2004; Mallin et al., 2005). This results in the sedimentation of living phy-toplankton as well as organic detritus produced via phyto-plankton senescence. Terrestrial POM inputs and primary production also enhance zooplankton biomass through graz-ing processes. Primary and secondary productions are then favoured by high river runoffs. In that case, the senescence of both phytoplankton and zooplankton cells could finally fuel the pool of POM and increase the organic carbon depo-sition on the shelf. However, our results show that zooplank-ton communities are also favoured by high river runoffs and can finally consume both terrestrial inputs and marine pro-duction of POM before their deposition on the seabed. The retention of organic carbon in zooplankton is relatively in-creased during peak discharges, and biogenic elements from the Rhone River are then relatively more transferred in living organisms and less buried into shelf sediments. As a conse-quence, there is probably no linear relationship between river runoffs and organic carbon sedimentation within the shelf, out of the prodelta area at least. Given that high zooplank-ton biomass is favoured by high river discharge, the timing of peak discharges could also modulate the POC deposition on the shelf. Indeed, the fate of terrestrial inputs from a peak discharge of the Rhone River is likely to be different, de-pending on whether it occurs after a period of low or high river discharge.
According to our model study, the LSW system owing to their fertilizing ability in phosphorus (Diaz et al., 2008) could have a negative impact on the carbon deposition on the shelf. During the LSW life, trophic interactions within the plank-ton community involves occurrence of high phosphorus con-centrations. These unusual concentrations in phosphorus re-sult in the development of large phytoplankton that in turn enhances the development of large-sized zooplankton. Ac-cording to our findings, zooplankton would then reduce the organic matter contents in the water column and ultimately the deposition on the shelf.
During high river discharge, the effective carbon deposi-tion would be delayed toward the south-western exit of the shelf, or even further in the open sea and the Catalan shelf, through strong horizontal advection of zooplankton commu-nities through canyons on the slope (Kouwenberg, 1994; Qiu et al., 2010). Out of the shelf, these populations could col-lapse due to a lack of prey availability and then reach deep sediments under organic detritus form. However, the depth of the seabed increases between the shelf and the open sea and this is likely to make less efficient the carbon burial in sediments. The zooplankton biomass could also fuel small pelagic fishes outside of the Gulf of Lion, such as anchovy
and sardines mid-trophic species that were shown to play an important role within Mediterranean ecosystem as well as productive upwelling regions (Palomera et al., 2007; Cury et al., 2000).
6 Conclusions
A coupled hydrodynamic-biogeochemical modelling was carried out to understand the mechanisms responsible for the organic carbon deposition on the Gulf of Lions shelf in the North-Western Mediterranean Sea. A modelling approach was developed to represent the high level of complexity of the plankton ecosystem dynamics within the Rhone River plume area and further on the Gulf of Lions then ensuring a robust analysis. The calibration and validation of our model were led simultaneously from a thorough analysis of biogeo-chemical in situ data (BIOPRHOFI) in LSW lenses detached from the Rhone River plume. A robust validation of our model then ensured an accurate representation of the ecosys-tem dynamics along the salinity gradient from the Rhone River mouth to the LSW system formed on the Gulf of Lions. Our results suggest that biological processes mostly con-trol the POC deposition in the Gulf of Lions. The contri-bution of terrestrial POM inputs remains limited. Terres-trial POM inputs mainly sink on the prodelta area. How-ever, there is a tight coupling between zooplankton and POM inputs through grazing processes on both terrestrial and ma-rine material, especially microzooplankton. As consumers of particulate organic material including phytoplankton, bacte-ria and detritus of both terrestbacte-rial and marine origins, micro-and mesozooplankton significantly limits the organic carbon contents in the water column further on the Gulf of Lions shelf. Thus, peak discharges of the Rhone River increase the carbon deposition on the prodelta area and reduce it further offshore, thus increasing the gradient of carbon deposition on the shelf. The biogenic elements supplied by the Rhone River inputs are then exported further offshore through ad-vection of zooplankton communities. Actually delaying the organic carbon deposition on the seabed toward the exit of the Gulf of Lions, this functioning could make less efficient the carbon burial in deep sediments and inversely increase the carbon retention in the food web toward higher trophic levels as small pelagic fishes.
Although based on a strong experimental background, our modelling approach still remains preliminary. A similar high resolution modelling study implemented on a larger domain (NW Mediterranean) could allow us to evaluate the out-of-shelf fate of the organic carbon produced within the Gulf of Lions. The advancement in computation capacities should enable the realization of such expensive simulation strategies in the future. The use of modelling tools to improve our un-derstanding of the biological carbon pump in coastal areas and orientate future research efforts is anyway promising.