© European Geosciences Union 2008
Geophysicae
Storm time dynamics of auroral electrojets: CHAMP observation
and the Space Weather Modeling Framework comparison
H. Wang1,*, H. L ¨uhr2, A. Ridley1, P. Ritter2, and Y. Yu1
1Department of Atmospheric, Oceanic, and Space Sciences, University of Michigan, Ann Arbor, MI-48109, USA 2GeoForshungsZentrum Potsdam, 14473 Potsdam, Germany
*On leave from: College of Electronic Informatics, Wuhan University, Wuhan 430079, P. R. China
Received: 29 August 2007 – Revised: 14 January 2008 – Accepted: 28 January 2008 – Published: 26 March 2008
Abstract. We investigate variations of the location and in-tensity of auroral currents during two magnetic storm periods based on magnetic field measurements from CHAMP sepa-rately for both hemispheres, as well as for the dayside and nightside. The corresponding auroral electrojet current den-sities are on average enhanced by about a factor of 7 com-pared to the quiet time current strengths. The nightside west-ward current densities are on average 1.8 (2.2) times larger than the dayside eastward current densities in the Northern (Southern) Hemisphere. Both eastward and westward cur-rents are present during the storm periods with the most intense electrojets appearing during the main phase of the storm, before the ring current maximizes in strength. The eastward and westward electrojet centers can expand to 55◦ MLat during intense storms, as is observed on 31 March 2001 withDst=−387 nT. The equatorward shift of auroral
currents on the dayside is closely controlled by the southward IMF, while the latitudinal variations on the nightside are bet-ter described by the variations of theDst index. However,
the equatorward and poleward motion of the nightside auro-ral currents occur earlier than theDst variations. The Space
Weather Modeling Framework (SWMF) can capture the gen-eral dynamics of the storm time current variations. Both the model and the actual data show that the currents tend to sat-urate when the merging electric field is larger than 10 mV/m. However, the exact prediction of the temporal development of the currents is still not satisfactory.
Keywords. Ionosphere (Auroral ionosphere; Electric fields and currents; Modeling and forecasting)
Correspondence to: H. Wang ([email protected])
1 Introduction
The intensification and equatorward expansion of the auro-ral electrojet are characteristic features of geomagnetic storm disturbances (Chapman and Bartels, 1940; Feldstein et al., 1997). The auroral electrojet indices (AE, AL, AU) are intro-duced for the description of the intensity of electrojets (Davis and Sugiura, 1966). The AE index tends to saturate during the main phase of the intense magnetic storm, which is re-garded as an artifact caused by the equatorward shift of the auroral electrojet beyond the standard AE network (Akasofu, 1981; Feldstein et al., 1997). Around midnight, the electro-jet center lies typically at∼60◦MLat (magnetic latitude) for
Dst∼−100 nT while at∼54◦MLat forDst∼−300 nT (e.g.
Feldstein et al., 1997), which is well equatorward of the 12 AE observatories, located between 63◦and 70◦MLat (Feld-stein et al., 1997). However, several studies argued that the main electrojet centers never shift equatorward of 60◦MLat regardless of the magnetic storm levels (e.g. Weimer et al., 1990; Ahn et al., 2005), although the conclusion of Ahn et al. (2005) was based on the events when the lowest AE station was on the nightside. In this aspect, the AE saturation is as-sumed to be real and a result of the nonlinear nature of the magnetosphere-ionosphere coupling (Kan et al., 1988).
Meng (1986) reported that the dayside aurora was dis-placed by a few degrees less equatorward than the nightside region near the peak of the magnetic storm, and the midnight auroral oval recovered more slowly than the noon sector dur-ing the storm recovery phase. Wang et al. (2006) found that the equatorward shift of field-aligned currents (FACs) on the dayside was closely correlated with the southward IMFBz
while the equatorward expansion of the nightside FACs was better described by the variations of theDstindex. Since
In addition, eastward and westward electrojets are found to behave differently during storms. For example, the equa-torward shift was much more pronounced for the eastward currents than for the westward (Rostoker and Phan, 1986). Kamide (1979) concluded that eastward electrojets disap-peared when westward electrojets were very intense, thus, ALAU was reported during the storm main phases. In contrast, Feldstein et al. (1997) found that eastward electro-jets existed in every magnetic storm, and eastward electroelectro-jets moved only equatorward while westward electrojets moved both poleward and equatorward. They pointed out if only the region of auroral latitudes was considered, the impres-sion can be created that eastward electrojets disappeared dur-ing the course of intense magnetic storms. Previous studies showed that the most intense westward electrojet was most often observed around 03:15 MLT and the eastward electro-jet around 17:30 MLT (Allen and Kroehl, 1975). With satel-lite observations close to these two local time sectors, com-parative investigations of eastward and westward electrojets dynamics during storm periods can be performed.
The discussions and suggestions about the relationship between the auroral electrojet and ring current are quite controversial. For example, some authors claimed that the ring current intensification occurred earlier than the auroral electrojet (e.g. Akasofu and Chapman, 1963; Akasofu and Yoshida, 1966). Others showed that auroral electrojets often increased before the ring current increased (Pudovkin et al., 1968), therefore, the ring current formation was claimed to be caused by the substorm events (Rostoker, 1997). How-ever, Siscoe and Petschek (1997) indicated that there was no direct relation between substorm and ring current inten-sification and they were more like the two independent pro-cesses which are caused possibly by the same source (Grafe and Feldstein, 2000). By comparing the dynamics of auro-ral electrojets with the variations ofDst this problem will be
examined in this study.
This work includes: (1) a report on the high resolution CHAMP observations of the dayside and nightside auroral electrojet current density and position during the 31 March 2001 and 17 April 2002 storms; (2) an investigation of the variation of the dayside and nightside electrojets in associa-tion withDst and solar wind parameters; (3) a comparison
of the storm time dynamics of the eastward and westward auroral electrojets; and (4) a comparison between CHAMP observations and the Space Weather Modeling Framework (SWMF) model outputs. In the following section we de-scribe the instrumentation and data processing. The SWMF model will also be briefly introduced. The event analysis of the observations and data-model comparison is presented in Sect. 3. In Sect. 4 the results are discussed in the context of previous publications. Section 5 summarizes the conclusions drawn from the observations and data-model comparison.
2 Instrumentation and data processing
The geoscientific satellite CHAMP was launched on 15 July 2000 from the Russian cosmodrome Plesetsk into a circular, near-polar orbit (87.3◦ inclination, ∼93 min or-bit period) (Reigber et al., 2002). During the two con-sidered storms CHAMP was approximately in the late af-ternoon (daytime) – early morning (nighttime) meridian (15:00∼03:00 MLT at 475 km height for the March 2001 storm and 16:00∼04:00 MLT at 421 km height for the April 2002 storm). This constellation enables us to study the de-pendence of the dayside and nightside auroral currents on solar wind parameters and storm phases. The ionospheric Hall currents, here the source-free ionospheric current com-ponents, are determined from the scalar magnetic field mea-surements. The Hall current is approximated by a series of infinite line currents, separated by 1 degree, which are placed in the ionospheric E region at a height of 115 km. The tech-nique of determining the current strength of each line by inverting the variations in the total magnetic field has been developed by Olsen (1996). Moretto et al. (2002) has ap-plied this method later to Ørsted data. The reliability of this approach has been demonstrated in a statistical study where current density estimates from CHAMP were directly com-pared with independent determinations from ground (Ritter et al., 2004). The solar wind parameters used in this study are measured by the ACE satellite. The solar wind data have been propagated from the ACE satellite to the magnetopause with the minimum variance method outlined in Weimer et al. (2003).
The Space Weather Modeling Framework (SWMF) model will only be described briefly since it has been fully detailed elsewhere (e.g. T´oth et al., 2005). The SWMF has the ability to couple numerical domain models flexibly and efficiently, including models of the solar corona, the heliosphere, the magnetosphere, ionosphere and thermosphere. This frame-work enables simulations that were not possible with the in-dividual physics models and it is possible to be run in al-most real time on large computer systems. The SWMF used in this work includes the BATSRUS model to simulate the magnetosphere of the Earth (Powell et al., 1999), RCM to simulate the Inner Magnetosphere domain (Toffoletto et al., 2003), and the model by Ridley et al. (2004) to describe the ionospheric electrodynamics. The time-varying IMF and so-lar wind conditions measured by the ACE satellite are used as inputs at the front boundary (32RE). Various papers have
−60 −30 0 30
B x
(nT)
−60 −20 20 60
B y
(nT)
−60 −20 20 60
B z
(nT)
0 12 24 36 48
−500 −250 0
D ST
(nT)
Storm Time ( hour )
400 600 800 1000
V sw
(km/s)
0 20 40 60
Pd (nPa)
0 20 40
E m
(mV/m)
0 12 24 36 48
0 1 2 3
4x 10
13
Storm Time ( hour )
ε
[image:3.595.124.473.66.335.2](J/s)
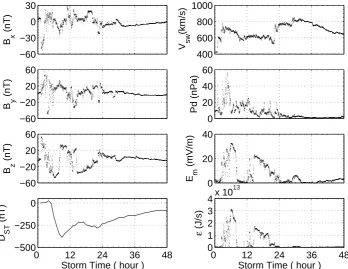
Fig. 1. Typical storm-time solar wind parameters including IMFBx,By,Bzcomponents in GSM coordinate system, as well as velocity,
vsw, dynamic pressure,Pd, merging electric field,Em, Akasofu parameter,ε, andDst variations on 31 March–1 April 2001.
3 Events studies
3.1 The storms on 31 March–1 April 2001
A succession of two intense storms occurred on 31 March– 1 April 2001 and were accompanied by extreme geophys-ical conditions. We will refer to the individual hours as Storm Time (ST). Figure 1 shows the time history of 8 quantities related to the magnetic activity on these two days. From left to right it contains the components of the IMFBx, By,Bz in GSM coordinates, Dst index, solar
wind velocity,vsw, dynamic pressure, Pd, merging electric
field,Em=vsw
q B2
y+Bz2sin2(θ/2)(Kan and Lee, 1979), and
Akasofu parameter, ε=1/µ0vsw(Bx2+By2+Bz2)sin4(θ/2)l02 (Akasofu, 1979), whereθis the clock angle, andl0is a con-stant scale length,'7 Earth radii.
We use the Dst index to characterize the two storm
in-tervals. The minimum Dst index was −387 nT around
09:00 UT and −284 nT around 22:00 UT. The IMF Bz
decreased to −47.5 nT around 06:35 UT and to −37 nT around 14:58 UT. The peak values of the energy input, as defined by ε, were about 3.1×10¹³J/s around 06:18 UT and 1.7×10¹³J/s around 14:57 UT, almost at the same time Em peaks attained values of about 32.7 mV/m and
22.9 mV/m, respectively. Thevswjumped towards 782 km/s
and 773 km/s around 03:00 and 29:10 UT, respectively. Pd
peaked at about 59.8 nPa around 04:43 UT.
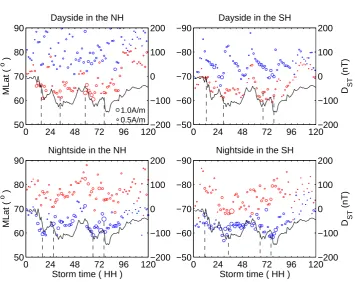
Figure 2 shows the MLat and UT distribution of the peak eastward and westward ionospheric currents as deduced from CHAMP measurements. The density of the currents are in-dicated by the circle size. Separate frames are used for the dayside and nightside in both hemispheres. Red circles cor-respond to eastward currents and blue westward currents. Overplotted is the variation of theDst index.
Both eastward and westward currents occur during storm periods with the most intense appearing in the storm main phase before the Dst peaks. The peak densities are not
always found in the most equatorward currents, and these strong currents do not coincide with the peak values ofEm
orεin a one to one correspondence. At daytime peak east-ward current densities are larger than westeast-ward, while on the nightside peak westward current densities are larger than the eastward. In the following, we consider mainly eastward currents (electrojets) on the daytime and westward currents (electrojets) on the nighttime in this study, if not state differ-ently.
0 12 24 36 48 40
50 60 70 80 90
MLat (
o )
Dayside in the NH
0.5A/m 1.0A/m
−530 −318 −106 106 318 530
0 12 24 36 48
40 50 60 70 80 90
MLat (
o )
Storm time ( HH ) Nightside in the NH
−530 −318 −106 106 318 530
0 12 24 36 48
−90
−80
−70
−60
−50
−40
Dayside in the SH
−530 −318 −106 106 318 530
D ST
(nT)
0 12 24 36 48
−90
−80
−70
−60
−50
−40
Storm time ( HH ) Nightside in the SH
−530 −318 −106 106 318 530
D ST
[image:4.595.123.478.67.335.2](nT)
[image:4.595.51.546.443.555.2]Fig. 2. The time and location of the peak eastward and westward ionospheric currents per orbit observed by CHAMP at the daytime (15:00 MLT) (top) and nighttime (03:00 MLT) (bottom) sectors in the Northern (left) and Southern (right) Hemispheres on 31 March–1 April 2001. The current densities are indicated by the circle size. Eastward electrojets are denoted as red while westward as blue. The vertical dashed lines indicate the maximum densities of the equatorward part of the auroral currents.
Table 1. The peak current density of the auroral electrojets on the dayside and nightside in the Northern (Southern) Hemispheres for the
March 2001 (1∼2) and April 2002 (1∼4) events.
north south
day night day night
UT(HH) MLat(◦) j(A/m) UT(HH) MLat(◦) j(A/m) UT(HH) MLat(◦) j(A/m) UT(HH) MLat(◦) j(A/m)
March storm-1 07:23 55 1.03 07:41 60 −1.57 06:56 −55 0.93 08:12 −54 −2.12
March storm-2 18:13 55 0.84 20:04 57 −2.08 20:50 −55.1 0.78 19:00 −62.8 −1.65 April storm-1 15:05 66.3 0.89 16:25 59.5 −0.98 12:34 −69.2 0.56 11:11 −67.5 −1.26 April storm-2 33:30 63.88 0.67 27:15 63.2 −1.03 29:30 −61.3 0.56 34:24 −62.3 −1.21 April storm-3 58:18 66.1 1.21 65:48 59.1 −1.18 68:12 −63.3 0.56 65:12 −62.9 −0.91 April storm-4 76:48 66.2 0.76 76:30 65.7 −1.44 78:54 −62.0 0.56 76:06 −58.8 −1.21
than the dayside current in the Northern (Southern) Hemi-sphere for the first storm and 2.5 (2.12) for the second storm. The peak densities of electrojets for the first storm are not always larger than those for the second storm althoughDst
is significantly larger for the first one. However, we should recall that the CHAMP spacecraft samples each polar region only once every 93 min and may have missed several larger events. A detailed summary of the peak eastward and west-ward currents for these events is given in Table 1. The table lists the time, MLat, and value of the largest current density detected by CHAMP for both the day and nightside in both the Northern and Southern Hemispheres.
The total current intensities of the eastward and westward currents are compared with the variations ofDst, as shown in
0 12 24 36 48 −40
−20 0 20 40
Total currents (A * 10
5
)
Dayside in the NH
−530 −265 0 265 530
0 12 24 36 48 −40
−20 0 20 40
UT (hh)
Total currents (A * 10
5
)
Nightside in the NH
−530 −265 0 265 530
0 12 24 36 48 −40
−20 0 20 40
Dayside in the SH
−530 −265 0 265 530
D ST
(nT)
0 12 24 36 48 −40
−20 0 20 40
UT (hh) Nightside in the SH
−530 −265 0 265 530
D ST
[image:5.595.124.478.67.330.2](nT)
Fig. 3. Storm-time integrated eastward (red) and westward (blue) currents observed by CHAMP together with the variations ofDst index
(black) in the daytime (top) and nighttime (bottom) sectors in the Northern (left) and Southern (right) Hemispheres on 31 March–1 April 2001. The vertical dashed lines indicate the maximum intensities of the equatorward part of the total auroral currents.
−50 −25 0 25 50
40 50 60 70 80
R = 0.50 td = 20min
B z (nT)
MLat (
o )
Dayside in the NH
−50 −25 0 25 50
−80
−70
−60
−50
−40
R = −0.66 td = 20min
B z (nT)
MLat (
o )
Dayside in the SH
−50040 −300 −100 100 50
60 70 80
R = 0.70 td = 40min
D ST (nT)
MLat (
o )
Nightside in the NH
−500 −300 −100 100
−80
−70
−60
−50
−40
R = −0.63 td = 40min
D ST (nT)
MLat (
o )
Nightside in the SH
Fig. 4. Correlation analysis of the MLat of the peak current densities with the 20 min time delayed IMFBzand the 40 min time delayed
Dst in both hemispheres on 31 March–1 April 2001. The correlation coefficient and the time delay are shown. In the top row the eastward
[image:5.595.122.474.396.655.2]−1.5 −0.5 0.5
1.5 UT = 2.84
NH − 20010331
−1.5
−0.50.5
1.5 UT = 4.41
−1.5
−0.50.5
1.5 UT = 5.98
−1.5 −0.5 0.5
1.5 UT = 7.55
Jh (A/m)
−1.5 −0.5 0.5 1.5
UT = 9.10
−1.5
−0.50.5
1.5 UT = 10.65
40 60 80 80 60 40
−1.5 −0.5 0.5
1.5 UT = 12.19
MLat (o)
−1.5 −0.5 0.5 1.5
SH − 20010331
UT = 2.06
−1.5
−0.50.5
1.5 UT = 3.63
−1.5
−0.50.5
1.5 UT = 5.22
−1.5 −0.5 0.5
1.5 UT = 6.79
−1.5 −0.5 0.5 1.5
UT = 8.35
−1.5
−0.50.5
1.5 UT = 9.90
−40 −60 −80 −80 −60 −40 −1.5 −0.5 0.5 1.5
MLat (o)
[image:6.595.126.471.61.361.2]UT = 11.44
Fig. 5. Storm-time auroral electrojets for individual CHAMP passes over the north and south poles between 02:00 UT and 13:00 UT, covering the main phase of the first storm on 31 March 2001. Black is CHAMP observation and red is SWMF model prediction. For each orbit segment, left part is on the dayside and right is on the nightside. The positive current on the dayside corresponds to an eastward electrojet, while on the nightside it corresponds to a westward electrojet.
Another point that can be seen in Fig. 2 is the equatorward expansion of both the eastward and westward currents asDst
decreases. The peak density of the eastward electrojet on the dayside shifts to 55◦MLat, and the westward electrojet on the nightside shift below 45◦MLat. The latitudinal width of the westward electrojet region on the nightside spreads over a wide range of about 20◦in latitude (not shown in the figures). The equatorward expansion and poleward retreat of the au-roral currents occur earlier than the variation of Dst. The
equatorward boundary of the dayside electrojet is poleward of the nightside electrojet by about 10◦during the first storm but equatorward of the nightside electrojet by about 5◦during the second one. The times at which the nightside westward electrojets reach their minimum latitudes occur later than that of the dayside eastward electrojets, and the dayside eastward electrojets show a more obvious poleward retreat than the nightside westward electrojets. The motion of the equator-ward borders of the intense electrojets on the nightside seem to correlate withDstreasonably well. But on the dayside the
motion of the equatorward boundaries of electrojets does not as well correlate withDst. It demonstrates that the latitudinal
variation of the electrojet on the dayside followed IMFBz
quite well. These features become clearer when looking at
Fig. 4, where the latitudes of the peak densities of electrojet currents in both hemispheres on the dayside (nightside) are compared with the variations of the 20 min (40 min) time de-layedBz(Dst). The time delay (20 and 40 min) is obtained
from a cross-correlation. It can be seen from Fig. 4, when
Bz<−25 nT orDst<−300 nT the latitudinal position of the
dayside or the nightside electrojets tend to saturate in both hemispheres.
−2 −1 0 1 2 −2
−1 0 1 2
JhCHAMP (A/m)
Jh
SWMF
(A/m)
Northern Hemisphere
Jmd/J = 1.6
Jmd/J = 0.8
50 60 70 80 90
50 60 70 80 90
MLatCHAMP (o)
MLat
SWMF
(
o )
dLat = 1.4o
−2 −1 0 1 2
−2 −1 0 1 2
JhCHAMP (A/m)
Jh
SWMF
(A/m)
Southern Hemisphere
Jmd/J = 1.1
Jmd/J = 0.8
−90 −80 −70 −60 −50 −90
−80
−70
−60
−50
MLatCHAMP (o)
MLat
SWMF
(
o )
[image:7.595.123.473.64.362.2]dLat = 1.4o
Fig. 6. The top two panels show the peak eastward and westward current densities observed by CHAMP versus those predicted by SWMF
in both hemispheres. The bottom two panels display the MLat of the peak current densities observed by CHAMP versus those predicted by SWMF in both hemispheres.
of the amplitudes of westward electrojets and an overestima-tion of the amplitudes of eastward electrojets, which is more obvious in the Northern Hemisphere. Weak eastward eletro-jets (negative) are found equatorward of the dominant west-ward electrojet (positive) on the nightside after 05:00 UT, which are thought to be associated with the sub-auroral po-larization stream (SAPS). Burke et al. (2000) reported also observations of SAPS appearing continuously during the ring current buildup associated with the main phase of a geomag-netic storm. The model cannot reproduce the SAPS features. The model currents tend to be more poleward than the obser-vations, especially between 05:00 and 09:00 UT. These fea-tures can be seen more clearly in Fig. 6, where the top two panels show the peak eastward (positive) and westward (neg-ative) currents observed by CHAMP versus those predicted by SWMF in both hemispheres. The average ratio between the model and observations are about 1.6 (1.1) for the east-ward electrojets and about 0.8 (0.8) for the westeast-ward elec-trojets in the Northern (Southern) Hemispheres. The bottom two panels show the latitudes of the peak current densities observed by CHAMP versus those predicted by SWMF. The SWMF currents tend to be located about 1.4◦ MLat more poleward in both hemispheres than the observations.
3.2 The storms on 17–21 April 2002
The observations of the four successive April storms will be presented in the same format as the March storms. Figure 7 shows the time history of 8 quantities related to the magnetic activity on 17–21 April 2002. From left to right it contains the components of the IMFBx,By,Bzin GSM coordinates,
Dst index, solar wind velocity,vsw, dynamic pressure, Pd,
merging electric field,Em, and Akasofu parameter,ε.
TheDst index reached−98,−127,−126, and−149 nT,
around 18:00, 32:00, 67:00, and 81:00 ST. The IMFBz
fluc-tuated a lot during the main phase of the first storm with a miminum of −31 nT around 15:35 ST. It exhibited an-other three minima of−13.6,−18.6,−19.2 nT around 29:28, 60:00, 72:07 ST. The peak values of the energy input, as defined by ε, were about 11, 2, 5.2, 5.3×10¹²J/s around 15:35, 25:30, 58:30, 72:30 ST. Almost at the same timeEm
peaks attained values of about 16.1, 7, 13.1, 11.2 mV/m. The
vsw jumped up to 625, 700, 666 km/s around 22:00, 57:30,
77:30 ST. Pd peaked at 26.2, 7.4, 13.6 nPa around 11:42,
58:30, 76:36 ST, respectively.
−30 −10 10 30
B x
(nT)
−30 −10 10 30
B y
(nT)
−30 −10 10 30
B z
(nT)
0 24 48 72 96 120 −150
−100 −50 0
D ST
(nT)
Storm Time ( hour )
300 500 700
V sw
(km/s)
0 10 20 30
Pd (nPa)
0 5 10 15
E m
(mV/m)
0 24 48 72 96 120 0
3 6
9x 10
12
Storm Time ( hour )
ε
[image:8.595.123.473.68.350.2](J/s)
Fig. 7. The same as Fig. 1 but for the 17–21 April 2002 event.
0 24 48 72 96 120 50
60 70 80 90
MLat (
o )
Dayside in the NH
0.5A/m 1.0A/m
−200 −100 0 100 200
0 24 48 72 96 120 50
60 70 80 90
MLat (
o )
Storm time ( HH ) Nightside in the NH
−200 −100 0 100 200
0 24 48 72 96 120 −90
−80
−70
−60
−50
Dayside in the SH
−200 −100 0 100 200
D ST
(nT)
0 24 48 72 96 120 −90
−80
−70
−60
−50
Storm time ( HH ) Nightside in the SH
−200 −100 0 100 200
D ST
(nT)
[image:8.595.122.478.368.650.2]0 24 48 72 96 120 −30
−20 −10 0 10 20 30
Total currents (A * 10
5
)
Dayside in the NH
−200 −100 0 100 200
0 24 48 72 96 120 −30
−20 −10 0 10 20 30
UT (hh)
Total currents (A * 10
5
)
Nightside in the NH
−200 −100 0 100 200
0 24 48 72 96 120 −30
−20 −10 0 10 20 30
Dayside in the SH
−200 −100 0 100 200
D ST
(nT)
0 24 48 72 96 120 −30
−20 −10 0 10 20 30
UT (hh) Nightside in the SH
−200 −100 0 100 200
D ST
[image:9.595.124.477.68.330.2](nT)
Fig. 9. The same as Fig. 3 but for the 17–21 April 2002 event.
the main phase of the storms, before the ring current (Dst)
peaked. The peak current densities do not coincide with the most equatorward currents in both hemispheres, neither with the maxima ofEm norε. During the first storm, the
west-ward electrojets on the nightside are larger by a factor of 1.11 (2.25) when compared to the eastward electrojets on the dayside in the Northern (Southern) Hemisphere. A de-tailed summary of the peak current densities is also given in Table 1. In the next section we will discuss the similarities and differences of auroral current characteristics for all the events.
The integrated current intensities in comparison with the variations of theDst index are shown in Fig. 9. Similar to
the March storm, the total intensities of westward currents are larger than the eastward parts on the dayside, but differ-ently from the March storms, the total intensities of west-ward currents are smaller than or comparable to the eastwest-ward parts on the nightside, which is more obvious in the North-ern Hemisphere than in the SouthNorth-ern Hemisphere. The lat-itudinal width of currents located poleward is much wider than those with opposite polarity more equatorward. This is valid on the dayside and nightside. The integrated currents and the current density values attain their peaks almost syn-chronously.
Figure 8 exhibits the equatorward expansion of both the eastward and westward currents as the storm develops. For the first storm, the eastward electrojets on the dayside shift to 62◦MLat, and the westward electrojets on the nightside shift
below 58◦MLat. The equatorward expansion and poleward retreat of auroral currents occur both earlier than the varia-tion ofDst. The auroral currents shift to their lowest latitude
beforeDstreaches its minimum. The equatorward boundary
of currents on the dayside is found poleward of that on the nightside by about 2◦on average. The nightside westward electrojets reach their minima latitudes later than the day-side eastward electrojets, and the dayday-side eastward currents exhibit a more obvious poleward retreat than the nightside westward currents. The motion of the equatorward borders of intense currents on the nightside seems to correlate reason-ably well withDst. But on the dayside the boundary motion
does not well correlate withDst. It demonstrates that the
lat-itudinal variation of the peak current densities on the dayside follows IMFBz. These features are clearer when looking at
Fig. 10, where the most-equatorward boundaries of currents densities on the dayside (nightside) are compared with the variations of 20 min (40 min) time delayed IMFBz(Dst) in
the same format as Fig. 4. The motion of the equatorward borders of intense currents on the dayside correlates withBz,
while on the nightside it correlates reasonably well withDst.
−20 −10 0 10 20 50
60 70 80 90
R = 0.69 td = 20min
B z (nT)
MLat (
o )
Dayside in the NH
−20 −10 0 10 20
−90
−80
−70
−60
−50
R = −0.60 td = 20min
B z (nT)
MLat (
o )
Dayside in the SH
−20050 −100 0
60 70 80 90
R = 0.50 td = 40min
D ST (nT)
MLat (
o )
Nightside in the NH
−200 −100 0
−90
−80
−70
−60
−50
R = −0.49 td = 40min
D ST (nT)
MLat (
o )
[image:10.595.123.473.68.347.2]Nightside in the SH
Fig. 10. The same as Fig. 4 but for the 17–21 April 2002 event.
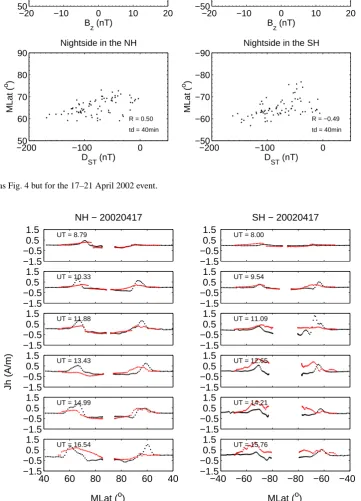
−1.5 −0.5 0.5 1.5
UT = 8.79
NH − 20020417
−1.5 −0.5 0.5 1.5
UT = 10.33
−1.5 −0.5 0.5 1.5
UT = 11.88
−1.5 −0.5 0.5 1.5
UT = 13.43
Jh (A/m)
−1.5 −0.5 0.5 1.5
UT = 14.99
40 60 80 80 60 40 −1.5 −0.5 0.5 1.5
UT = 16.54
MLat (o)
−1.5 −0.5 0.5 1.5
SH − 20020417
UT = 8.00
−1.5 −0.5 0.5 1.5
UT = 9.54
−1.5 −0.5 0.5 1.5
UT = 11.09
−1.5 −0.5 0.5 1.5
UT = 12.65
−1.5 −0.5 0.5 1.5
UT = 14.21
−40 −60 −80 −80 −60 −40
−1.5 −0.5 0.5 1.5
MLat (o)
UT = 15.76
[image:10.595.118.480.164.666.2]−2 −1 0 1 2 −2
−1 0 1 2
Jh CHAMP
Jh
SWMF
Northern Hemisphere
Jmd/J = 0.7
Jmd/J = 1.0
50 60 70 80 90
50 60 70 80 90
MLat CHAMP
MLat
SWMF
dLat = 1.8o
−2 −1 0 1 2
−2 −1 0 1 2
Jh CHAMP
Jh
SWMF
Southern Hemisphere
Jmd/J = 2.1
Jmd/J = 1.3
−90 −80 −70 −60 −50 −90
−80
−70
−60
−50
MLat CHAMP
MLat
SWMF
[image:11.595.120.474.64.365.2]dLat = −0.5o
Fig. 12. The same as Fig. 6 but for the 17–21 April 2002 event.
correspond to eastward electrojets while on the nightside cor-respond to westward electrojets. SWMF underestimates the amplitudes of currents in the Northern Hemisphere and over-estimates the amplitudes of currents in the Southern Hemi-sphere. In addition, model currents tend to be located more poleward than the observations, which is more obvious in the Northern Hemisphere than in the Southern Hemisphere. The top two panels in Fig. 12 show a comparison of the peak eastward (positive) and westward (negative) currents observed by CHAMP versus predictions by SWMF in both hemispheres. The average ratio between the model results and observations is about 0.7 (2.1) for eastward electrojets and about 0.8 (1.3) for westward electrojets in the North-ern (SouthNorth-ern) Hemispheres. The bottom two panels show the latitudes of peak current densities observed by CHAMP versus predictions by SWMF. The model tend to locate cur-rents 1.8◦(0.1◦) poleward of the observations in the North-ern (SouthNorth-ern) Hemisphere. In summary, the present sim-ulations can yield ranges of current densities and locations “quite well”, although the exact prediction of the time series is still impossible.
4 Discussion
In the previous section we have presented observations of electrojets and some other features during the geomagnetic storms of March 2001 and April 2002. During these storms the CHAMP satellite was orbiting the Earth close to the early morning (nighttime) and late afternoon (daytime) meridian. This orbit allows us to compare features of the auroral cur-rents on the dayside and nightside.
4.1 Current density
The above analysis shows that both eastward and westward electrojets flow during the storm periods, with the most in-tense currents appearing during the main phase of the storm, beforeDst reaches its maximum. The peak current densities
31 March 2001
0 10 20 30
0 0.5 1 1.5 2 E m (mV/m)
Jh
CHAMP
(A/m)
R = 0.79
0 10 20 30
−2 −1.5 −1 −0.5 0 E
m (mV/m)
Jh
CHAMP
(A/m)
R = −0.74
0 10 20 30
0 0.5 1 1.5 2 E m (mV/m)
Jh
CHAMP
(A/m)
R = 0.61
0 10 20 30
−2 −1.5 −1 −0.5 0 E
m (mV/m)
Jh
CHAMP
(A/m)
R = −0.87
0 10 20 30
0 0.5 1 1.5 2 E m (mV/m)
Jh
SWMF
(A/m)
R = 0.81
0 10 20 30
−2 −1.5 −1 −0.5 0 E
m (mV/m)
Jh
SWMF
(A/m)
R = −0.76
0 10 20 30
0 0.5 1 1.5 2 E m (mV/m)
Jh
SWMF
(A/m)
R = 0.11
0 10 20 30
−2 −1.5 −1 −0.5 0 E
m (mV/m)
Jh
SWMF
(A/m)
R = −0.59
17 April 2002
0 10 20 30
0 0.5 1 1.5 2 E m (mV/m)
Jh
CHAMP
(A/m)
R = 0.64
0 10 20 30
−2 −1.5 −1 −0.5 0 E
m (mV/m)
Jh
CHAMP
(A/m)
R = −0.80
0 10 20 30
0 0.5 1 1.5 2 E m (mV/m)
Jh
CHAMP
(A/m)
R = 0.49
0 10 20 30
−2 −1.5 −1 −0.5 0 E
m (mV/m)
Jh
CHAMP
(A/m)
R = −0.57
0 10 20 30
0 0.5 1 1.5 2 E m (mV/m)
Jh
SWMF
(A/m)
R = 0.59
0 10 20 30
−2 −1.5 −1 −0.5 0 E
m (mV/m)
Jh
SWMF
(A/m)
R = −0.62
0 10 20 30
0 0.5 1 1.5 2 E m (mV/m)
Jh
SWMF
(A/m)
R = 0.64
0 10 20 30
−2 −1.5 −1 −0.5 0 E
m (mV/m)
Jh
SWMF
(A/m)
[image:12.595.101.497.64.369.2]R = −0.54
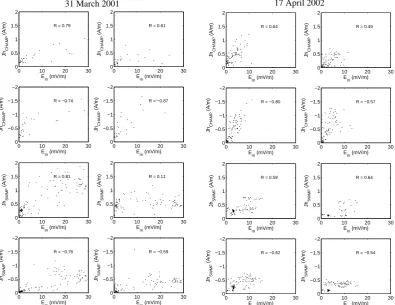
Fig. 13. The peak densities of the eastward and westward currents versus the merging electric field,Em. The left panels are for the March
storm and the right are for the April storm. The top two rows are for the CHAMP observations and the bottom are for the SWMF outputs. The model results are in the interval of 5 min.
the westward and eastward electrojet, Jh, from CHAMP (top two rows) and SWMF (bottom two rows) withEm for both
March and April storm events. Good correlations are found for them. It can be seen that Jh tends to increase asEm
in-creases, which is the same for both the model and the obser-vation. The saturation effect atEm>10 mV/m is also evident
for both CHAMP data and SWMF prediction, suggesting the model can match the physical trend.
The current densities determined for these storm studies are on average a factor of 7 larger than the average electrojet density (0.2 A/m). The westward electrojets on the nightside are on average larger by a factor of 1.8 (2.2) than the east-ward electrojets on the dayside in the Northern (Southern) Hemisphere, therefore, making AL larger than AU during an intense storm (Kamide, 1979). The comparison of integrated current values on the dayside and nightside shows different pictures of the current densities. For the March storm the intensities of the integrated westward electrojets are larger than the eastward electrojets, but for the April storms, the in-tensities of the integrated eastward (westward) electrojets are larger than the westward (eastward) electrojets on the night-side (daynight-side). This is not surprising since the integrated cur-rent values take into account not only the intensity but also the electrojet width.
4.2 Latitudinal variation
During periods of enhanced solar wind input into the magne-tosphere the auroral oval expands equatorward. Our results show that the centers of the peak densities of the eastward and westward auroral electrojets can expand to below 60◦ MLat during the intense March storm (see Table 1). This is confirmed by Fig. 14, which shows the relationship be-tween the MLat of the maximum westward and eastward electrojets versus the magnitudes of their current densities during these storms. The black dots denote CHAMP obser-vations and the red circles SWMF outputs. The center of the currents during relatively quiet periods with current density lower than 0.5 A/m can be found from latitudes higher than ±75◦to as low as±60◦. The auroral oval tends to expand equatorward as the current density increases, which is less obvious in the model data. The center of the electrojets can expand to±55◦when the peak current density is larger than 1 A/m for the March storm, with a minimunDst=−387 nT.
The electrojet center shifts equatorward below ±60◦ when the peak current density is larger than 1 A/m for the April storm, with a minimumDst=−149 nT. Therefore the current
−2 −1.5 −1 −0.5 0 0.5 1 1.5 2 50
60 70 80 90
Jh (A/m)
MLat (
o )
NH − 20010331−0401
−2 −1.5 −1 −0.5 0 0.5 1 1.5 2 −90
−80
−70
−60
−50
Jh (A/m)
MLat (
o )
SH − 20010331−0401
−2 −1.5 −1 −0.5 0 0.5 1 1.5 2 50
60 70 80 90
Jh (A/m)
MLat (
o )
NH − 20020417−0421
−2 −1.5 −1 −0.5 0 0.5 1 1.5 2 −90
−80
−70
−60
−50
Jh (A/m)
MLat (
o )
[image:13.595.121.475.64.362.2]SH − 20020417−0421
Fig. 14. The peak densities of the eastward and westward currents, as observed by CHAMP (black dot) and predicted by SWMF (red circle)
versus the MLat where they were recorded. Results are from the 2001 (top) and 2002 (bottom) storms. Left is in the Northern Hemisphere and right is in the Southern Hemisphere.
−40 −20 0 20 40
−250 −150 −50 50 150
Total currents (A*10 5)
0.2*(AU,AL) (nT)
NH−20010331−0401
−40 −20 0 20 40
−250 −150 −50 50 150
Total currents (A*10 5)
0.2*(AU,AL) (nT)
SH − 20010331−0401
Fig. 15. The intensities of the integrated eastward and westward currents versus the amplitudes of AL, AU indices during the March storms.
Left is in the Northern Hemisphere and right is in the Southern Hemisphere.
during moderate and intense geomagnetic storms. Thus the reported index may be substantially lower than the real val-ues. To test this statement the integrated current intensities together with the magnitudes of AU, AL indices for the in-tense March storm are shown in Fig. 15. Both AU and AL are averaged over the time period it takes CHAMP to pass the
[image:13.595.121.475.429.584.2]It is shown that the dayside current boundary is displaced by a few degrees less equatorward than the nightside region near the peak of the magnetic storm, which is consistent with previous studies (Meng, 1986; Wang et al., 2005). The latitu-dinal variations of the auroral electrojets are compared with the variations ofDst and the interplanetary magnetic field
componentBz in order to determine how these parameters
control the current configuration in the auroral region. As shown in Figs. 4 and 10, on the dayside, the equatorward shift of the eastward auroral electrojets appears to be con-trolled closely by the southward IMFBz, while on the
night-side the poleward retreat of the westward currents is more gradual during the recovery phase and the latitudinal motion of the equatorward boundary more correlated with the vari-ation ofDst than withBz. These results also show that the
nightside equatorward and poleward movement, and the en-hancement of the electrojets happen earlier than the devel-opment of the ring current. These findings suggest a closer relation of the ring current intensity with the processes in the magnetospheric tail and indicate that the nightside electrojets can be part of the ring current circuit (Pudovkin et al., 1968; Rostoker, 1997).
It is also noticed that westward electrojets cover a wider range of latitudes than the eastward electrojets for the March storm. The westward electrojets expand both poleward and equatorward while the eastward electrojets move only equa-torward. A possible explanation could be the different drivers of the electrojets, the plasma convection and the explosive in-jection. In case of the early morning westward electrojet the intensified convection moves the currents equatorward and the substorm electrojet is characterized by a poleward jump. On the other hand both types of drivers make the eastward electrojet move equatorwards (Feldstein et al., 1997). This can explain the phenomena during the March storm. How-ever, this is not true for the April storm during which east-ward currents on the nightside cover a much wider region than westward currents.
4.3 Data-model comparison
When comparing satellite observations with SWMF outputs, we find that the model can reproduce the ranges of the cur-rent densities and locations well. In addition to the general correct trend, it is also found that the currents may be satu-rating forEm>10 mV/m, which has been shown in both the
model and actual data, suggesting that the model can match the physical trend. However, the exact prediction of the tem-poral development is still not good. For the March storm, on average, the model underestimates the westward current den-sity by about 20% on the nightside, while it overestimates the eastward current by about 30% on the dayside. For the April storm, the model underestimates the currents in the North-ern Hemisphere by about 30%, but overestimate the current systems in the Southern Hemisphere by about 70%.
The peak current densities occur not necessarily simul-taneous in the CHAMP observations and SWMF results. For the March event, the model currents tend to be located 1.4◦MLat poleward of the observations in both hemispheres. For the April event, the model currents tend to be located 1.8◦ poleward of the observations in the Northern Hemi-sphere, while they fit very well (0.1◦) the observations in the Southern Hemisphere. One may notice that the cur-rents observed by CHAMP are located more poleward in the Southern Hemisphere than in the Northern Hemisphere for the April storm, which may account for the hemispheric dif-ference of the model performance. In general, the location of the maximum in the current density derived from SWMF suggests a polar cap boundary several degrees poleward of that observed by satellites during storm periods. This is con-sistent with previous studies which found that the locations of the maxima in the ionospheric potential and FAC density derived from SWMF are several degrees poleward of those observed by satellites during storm periods (Wang et al., 2008). Partially, this can be attributed to the inner bound-ary of the model (3.5RE), corresponding to 55◦MLat in the
ionosphere. Current systems at lower latitude cannot be re-produced. However, during severe storms, the currents are observed to expand equatorward beyond 50◦MLat, which is far below the inner boundary of the model.
Previous studies have proposed a number of different methods allowing the model currents to shift more equator-ward, but all have disadvantages (e.g. Ridley et al., 2001). For example, one option is to move the inner boundary of the model closer to the Earth. However, this requires to take the higher wave speed into account and reduce the time step of the simulation. Another approach might be to increase the model’s resolution in the inner boundary. Either of these so-lutions will cause the model to run much slower, a trade off which must be made in order to maintain accuracy. Other methods include coupling the MHD code to a more sophisti-cated inner magnetosphere model (e.g. Liemohn et al., 2001) or including artificial, simplistic R2 currents (Ridley et al., 2002). These may allow the equatorward part of FACs to be more accurately modeled.
5 Conclusions
In this study, we have investigated the Northern and Southern Hemisphere auroral current characteristics during the March 2001 and April 2002 magnetic storms. We have identified a number of auroral current characteristics during these storms. 1. The peak current intensities determined during the storms are on average a factor of 7 larger than avearge electrojets intensities.
3. Both eastward and westward electrojets are present dur-ing storm periods. The most intense currents appear during the main phase of the storm. The current den-sities are correlated best with the merging electric field and tend to saturate whenEm>10 mV/m.
4. The integrated current intensity of the westward cur-rents are larger than that of the eastward curcur-rents on both the dayside and the nightside for the March storm, but for the April storm the currents further poleward are larger than those located more equatorward with oppo-site polarity.
5. The peak eastward, and westward auroral electrojet centers can expand to below 55◦ MLat during intense storms. These electrojets flow well equatorward of the AE index monitoring stations.
6. The equatorward motion of currents on the dayside is, in general, correlated with the strength of the IMF south-ward component. The latitudinal motion of the equator-ward currents in the nightside sector appears to be more correlated with the variation of theDst index. When
Bz<−25 nT or Dst<−300 nT, the latitudinal position
of the electrojets saturates in both hemispheres. 7. The SWMF model can reproduce the ranges of the
den-sities and locations of the storm time auroral currents well. Both the model and actual data show that the cur-rents tend to saturate whenEm>10 mV/m, suggesting
that the model can match the physical trend. However, the prediction of the temporal development of the cur-rents is still not satisfatory.
A larger statistical study involving more magnetic storms is required to verify our results.
Acknowledgements. We thank ACE teams for providing solar wind
and IMF data, and WDC C2 for Geomagnetism at Kyoto for
pro-viding AU, AL, andDstindices data. The operational and data
pro-cessing supports of the CHAMP mission by the German DLR and BMBF are greatly appreciated. We thank the CSEM at University of Michigan for developing the SWMF model. This work is supported by the NASA research grant F010639, NSF grant ATM0639336, and National Nature Science Foundation of China (No. 40604017). Topical Editor M. Pinnock thanks J.-C. Cerisier and A. Viljanen for their help in evaluating this paper.
References
Ahn, B.-H., Chen, G. X., Sun, W., Gjerloev, J. W., Kamide, Y., Sigwarth, J. B., and Frank, L. A.: Equatorward expansion of the westward electrojet during magnetically disturbed periods, J. Geophys. Res., 110, A01305, doi:10.1029/2004JA010553, 2005. Akasofu, S. I.: Interplanetary energy flux associated with
magneto-spheric substorms, Planet. Space. Sci., 27, 425–431, 1979. Akasofu, S.-I.: Relationships between the AE and Dst indices
dur-ing geomagnetic storms, J. Geophys. Res., 86, 4820–4822, 1981.
Akasofu, S.-I. and Chapman, S.: Magnetic Storms: The Simultane-ous Development of the Main Phase (DR) and of Polar Magnetic Substorms (DP), J. Geophys. Res., 68, 3155–3158, 1963. Akasofu, S.-I. and Yoshida, S.: Growth and Decay of the Ring
Cur-rent and the Polar Electrojets, J. Geophys. Res., 71, 231–240, 1966.
Allen, J. H. and Kroehl, H. W.: Spatial and temporal distributions of magnetic effects of auroral electrojets as derived from AE in-dices, J. Geophys. Res., 80, 3667–3677, 1975.
Burke, W. J., Rubin, A. G., Maynard, N. C., Gentile, L. C., Sul-tan, P. J., Rich, F. J., de La Beaujardi`ere, O., Huang, C. Y., and Wilson, G. R.: Ionospheric disturbances observed by DMSP at middle to low latitudes during the magnetic storm of June 4-6, 1991, J. Geophys. Res., 105, 18 391–18 406, doi:10.1029/ 1999JA000188, 2000.
Chapman, S. and Bartels, J.: “Geomagnetism”, Clarendon, Oxford, 1940.
Davis, T. N. and Sugiura, M.: Auroral Electrojet Activity Index AE and Its Universal Time Variations, J. Geophys. Res., 71, 785– 803, 1966.
De Zeeuw, D. L., Sazykin, S., Wolf, R. A., Gombosi, T. I., Ridley, A. J., and T´oth, G.: Coupling of a global MHD code and an inner magnetospheric model: Initial results, J. Geophys. Res., 109, A12219, doi:10.1029/2003JA010366, 2004.
Feldstein, Y. I., Grafe, A., Gromova, L. I., and Popov, V. A.: Auro-ral electrojets during geomagnetic storms, J. Geophys. Res., 102, 14 223–14 236, doi:10.1029/97JA00577, 1997.
Grafe, A. and Feldstein, Y.: About the relationship between auroral electrojets and ring currents, Ann. Geophys., 18, 874–886, 2000, http://www.ann-geophys.net/18/874/2000/.
Kamide, Y.: Relation between substorms and storms, in: Dynamics of the magnetosphere, edited by: Akasofu, S. I., pp. 425–443, D. Reidel, Norwell, 1979.
Kan, J. R. and Lee, L. C.: Energy coupling function and solar wind-magnetosphere dynamo, Geophys. Res. Lett., 6, 577–580, 1979. Kan, J. R., Zhu, L., and Akasofu, S. I.: A theory of substorm: onset
and subsidence, J. Geophys. Res., 93, 5624–5640, 1988. Liemohn, M. W., Kozyra, J. U., Thomsen, M. F., Roeder,
J. L., Lu, G., Borovsky, J. E., and Cayton, T. E.: Dom-inant role of the asymmetric ring current in producing the
stormtime Dst∗, J. Geophys. Res., 106(A6), 10 883–10 904,
doi:10.1029/2000JA000326, 2001.
Meng, C. I.: Dynamic Variation of the Auroral Oval During Intense Magnetic Storms, J. Geophys. Res., 89, 227–235, 1986. Moretto, T., Olsen, N., Ritter, P., and Lu, G.: Investigating the
au-roral electrojets with low altitude polar orbiting satellites, Ann. Geophys., 20, 1049–1061, 2002,
http://www.ann-geophys.net/20/1049/2002/.
Olsen, N.: A new tool for determining ionospheric currents from magnetic satellite data, Geophys. Res. Lett., 23, 3635–3638, doi: 10.1029/96GL02896, 1996.
Powell, K. G., Roe, P. L., Linde, T. J., Gombosi, T. I., and Zeeuw, D. L. D.: A solution-adaptive upwind scheme for ideal magneto-hydrodynamics, J. Comp. Phys., 154, 284–309, 1999.
Pudovkin, M., Shumilov, O., and Zaitzeva, S.: Polar storms and development of the DR currents, Planet. Space Sci., 16, 891– 898, 1968.
Ridley, A. J., De Zeeuw, D. L., Gombosi, T. I., and Powell, K. G.: Using steady state MHD results to predict the global state of the magnetosphere ionosphere system, J. Geophys. Res., 106, 30 067–30 076, 2001.
Ridley, A. J., Hansen, K. C., T´oth, G., De Zeeuw, D. L., Gombosi, T. I., and Powell, K. G.: University of Michigan MHD results of the Geospace Global Circulation Model metrics challenge, J. Geophys. Res., 107, A101290, doi:10.1029/2001JA000253, 2002.
Ridley, A. J., Gombosi, T. I., and DeZeeuw, D. L.: Ionospheric control of the magnetosphere: Conductance, Ann. Geophys., 22, 567–584, 2004,
http://www.ann-geophys.net/22/567/2004/.
Ritter, P., L¨uhr, H., Viljanen, A., Amm, O., Pulkkinen, A., and Sil-lanp¨a¨a, I.: Ionospheric currents estimated simultaneously from CHAMP satellite and IMAGE ground-based magnetic field mea-surements: A statistical study at auroral latitudes, Ann. Geo-phys., 22, 417–430, 2004,
http://www.ann-geophys.net/22/417/2004/.
Rostoker, G.: The role of substorms in the formation of the ring current, in: Workshop on the Earth’s trapped environment, edited by: Reeves, G. D., p.33–38, Woodbury, NY, 1997.
Rostoker, G. and Phan, T. D.: Variation of auroral electrojet spatial location as a function of the level of magnetospheric activity, J. Geophys. Res., 91, 1716–1722, 1986.
Siscoe, G. L. and Petschek, H. E.: On storm weakening during sub-storm expansion phase, Ann. Geophys., 15, 211–216, 1997, http://www.ann-geophys.net/15/211/1997/.
Toffoletto, F., Sazykin, S., Spiro, R., and Wolf, R.: Inner magne-tospheric modeling with the Rice Convection Model, Space Sci. Rev., 107, 175–196, 2003.
T´oth, G., Sokolov, I. V., Gombosi, T. I., Chesney, D. R., Clauer, C. R., De Zeeuw, D. L., Hansen, K. C., Kane, K. J., Manchester, W. B., Oehmke, R. C., Powell, K. G., Ridley, A. J., Roussev, I. I., Stout, Q. F., Volberg, O., Wolf, R. A., Sazykin, S., Chan, A., Yu, B., and K´ota, J.: Space Weather Modeling Framework: A new tool for the space science community, J. Geophys. Res., 110, A12226, doi:10.1029/2005JA011126, 2005.
T´oth, G., Zeeuw, D., Gombosi, T. I., Manchester, W. B., Ridley, A. J., Sokolov, I. V., and Roussev, I. I.: Sun-to-thermosphere simulation of the 28–30 October 2003 storm with the Space Weather Modeling Framework, Space Weather, 5, S06003, doi:10.1029/2006SW000272, 2007.
Wang, H., L¨uhr, H., Ma, S. Y., and Ritter, P.: Statistical study of the substorm onset: its dependence on solar wind parameters and solar illumination, Ann. Geophys., 23, 2069–2079, 2005, http://www.ann-geophys.net/23/2069/2005/.
Wang, H., L¨uhr, H., Ma, S. Y., Weygand, J., and Skoug, R.: Field-aligned currents observed by CHAMP during the intense 2003 geomagnetic storm events, Ann. Geophys., 24, 311–324, 2006, http://www.ann-geophys.net/24/311/2006/.
Wang, H., Ridley, A. J., and L¨uhr, H.: Validation of
the Space Weather Modeling Framework with observa-tions from DMSP and CHAMP, Space Weather, in press, doi:10.1029/2007SW000355, 2008.
Weimer, D. R., Reinleitner, L. A., Kan, J. R., Zhu, L., and Akasofu, S.-I.: Saturation of the auroral electrojet current and the polar cap potential, J. Geophys. Res., 95, 18 981–18 987, 1990. Weimer, D. R., Ober, D. M., Maynard, N. C., Collier, M. R.,