Biogeosciences, 10, 2803–2814, 2013 www.biogeosciences.net/10/2803/2013/ doi:10.5194/bg-10-2803-2013
© Author(s) 2013. CC Attribution 3.0 License.
EGU Journal Logos (RGB)
Advances in
Geosciences
Open Access
Natural Hazards
and Earth System
Sciences
Open Access
Annales
Geophysicae
Open Access
Nonlinear Processes
in Geophysics
Open Access
Atmospheric
Chemistry
and Physics
Open Access
Atmospheric
Chemistry
and Physics
Open Access
Discussions
Atmospheric
Measurement
Techniques
Open Access
Atmospheric
Measurement
Techniques
Open Access
Discussions
Biogeosciences
Open Access Open Access
Biogeosciences
DiscussionsClimate
of the Past
Open Access Open Access
Climate
of the Past
Discussions
Earth System
Dynamics
Open Access Open Access
Earth System
Dynamics
Discussions
Geoscientific
Instrumentation
Methods and
Data Systems
Open Access
Geoscientific
Instrumentation
Methods and
Data Systems
Open Access
Discussions
Geoscientific
Model Development
Open Access Open Access
Geoscientific
Model Development
Discussions
Hydrology and
Earth System
Sciences
Open Access
Hydrology and
Earth System
Sciences
Open Access
Discussions
Ocean Science
Open Access Open Access
Ocean Science
Discussions
Solid Earth
Open Access Open Access
Solid Earth
Discussions
The Cryosphere
Open Access Open Access
The Cryosphere
Discussions
Natural Hazards
and Earth System
Sciences
Open Access
Discussions
How do tree competition and stand dynamics lead to spatial patterns
in monospecific mangroves?
M. N. I. Khan1,2,3,*, S. Sharma3, U. Berger2, N. Koedam4, F. Dahdouh-Guebas1,4, and A. Hagihara3
1Laboratory of Systems Ecology and Resource Management, D´epartement de Biologie des Organismes, Facult´e des Sciences,
Universit´e Libre de Bruxelles – ULB, CP 264/1, Avenue F.D. Roosevelt 50, 1050 Brussels, Belgium
2Institute of Forest Growth and Forest Computer Sciences, TU Dresden, P.O. 1117, 01735 Tharandt, Germany 3Laboratory of Ecology and Systematics, Faculty of Science, University of the Ryukyus, 1 Senbaru, Nishihara-cho,
Okinawa 903-0213, Japan
4Laboratory of Plant Biology and Nature Management, Faculty of Sciences and Bio-engineering Sciences, Vrije Universiteit
Brussel-VUB, Pleinlaan 2, 1050 Brussels, Belgium
*present address: Laboratory of Systems Ecology and Resource Management, D´epartement de Biologie des Organismes,
Facult´e des Sciences, Universit´e Libre de Bruxelles – ULB, Campus de la Plaine, CP 264/1, Avenue F.D. Roosevelt 50, 1050 Brussels, Belgium
Correspondence to: M. N. I. Khan ([email protected], [email protected])
Received: 28 December 2012 – Published in Biogeosciences Discuss.: 31 January 2013 Revised: 8 April 2013 – Accepted: 11 April 2013 – Published: 30 April 2013
Abstract. Information on mangrove stand development is rare because long-term monitoring data is often lacking. Such information is important in order to plan manage-ment measures effectively. Novel approaches based on ex-isting datasets are required to bridge this gap of knowledge. This study uses a unique combination of field data analyses with simulation experiments in order to demonstrate how in-formation on mangrove dynamics can be extracted if data are sparse. The paper provides a baseline characterization of stand development in a monospecific pioneer mangrove stand of Kandelia obovata. Point pattern analyses revealed that in the young stage, self-thinning has started but has not yet lead to a regularity of spatial tree distribution in the entire stand, and trees located in smaller clumps hinder each other in growth but do not lead to a significant size class differ-entiation. However, after ca. 2 decades the self-thinning and the size class differentiation start to become more visible. A mutual inhibition of growth was observed within 2 m circular distance (r) in the young stage and within 3 m distance after two decades of stand development as confirmed by the neg-ative values of mark correlation function. As a stand grows older the spatial pattern of individuals become more regular from a clustered pattern. In order to understand and predict the future stand development, simulation experiments were carried out by means of the individual-based model KiWi.
1 Introduction
Mangroves dominate the intertidal zone of the tropical and subtropical coasts, and play a major role in the food webs and nutrient cycles, also in the adjacent marine ecosystems (Alongi et al., 2000; Machiwa and Hallberg, 2002; Mumby et al., 2004; Kristensen et al., 2008). Although the ecological and economic significance (R¨onnb¨ack, 1999) of mangroves is highly acknowledged, the ecological processes driving their dynamics are still poorly understood (Kathiresan and Bingham, 2001; Comley and McGuinness, 2005; Khan et al., 2007; Berger et al., 2008; Cannicci et al., 2008; Krauss et al., 2008) because of the absence of long-term monitoring data. While numerous studies address the effect of abiotic condi-tions (Cintron et al., 1978; Ball, 1988; Clarke and Allaway, 1993) and disturbances (Piou et al., 2006) on forest dynam-ics, the importance of biotic interactions and their impact on the temporal, vertical and horizontal patterns of mangrove forests is still under-represented in scientific investigations (Berger and Hildenbrandt, 2000, 2003).
for photosynthetic light in the canopy (Clarke and All-away, 1993; Khan et al., 2004), microtopography (Dahdouh-Guebas et al., 2007; Di Nitto et al., 2008), vegetation com-position (Jayatissa et al., 2002; Kairo et al., 2002), sedi-ment chemistry (Thiobodeau and Nickerson, 1986; Clarke and Allaway, 1993; McKee, 1995; Alongi et al., 2004), tidal elevation (Clarke and Myerscough, 1993), salinity (Clarke and Allaway, 1993; Krauss et al., 2008), dispersal patterns (Rabinowitz, 1978; Clarke and Myerscough, 1991; Clarke, 1993), and the competitive ability of species (Clarke and My-erscough, 1993; Berger and Hildenbrandt, 2000, 2003; Can-ham et al., 2004).
There are differences in structural patterns (e.g. tree size, species composition, soil–plant interaction, etc.) between ter-restrial (Manabe et al., 2000; Hegland et al., 2001; Souza and Martins, 2004; Wilson et al., 2004; Kubota, 2006; Salas et al., 2006) and mangrove (Osunkoya and Greese, 1997; Krause et al., 2001; Kairo et al., 2002; Dahdouh-Guebas and Koedam, 2006) forest systems. Structural patterns in mangrove forests depend on the distance to the sea or proximate water channel (e.g. Osunkoya and Greese, 1997; Kairo et al., 2002), eleva-tion (Castaneda-Moya et al., 2006) or even latitudinal gra-dients (DeLange and DeLange, 1994). In mangrove forests, the spatial patterns of individuals have been analysed based on the distance from the sea to the forest (Osunkoya and Greese, 1997), on soil resources regulators and the hydrope-riod (Castaneda-Moya et al., 2006) or on the ecosystem level (Krause et al., 2001). However, the relationship between lo-cal competition among trees as one of the major driving fac-tors and the resulting size and spatial distribution of individ-uals remains little explained. This is essential for a general understanding of mangrove forest dynamics. In order to anal-yse mangrove forest dynamics, it is thus critical to analanal-yse comprehensively both the structural and spatial distribution patterns of individuals and their temporal change.
[image:2.595.310.545.116.259.2]The analysis of the self-thinning process (Shinozaki and Kira, 1961; Yoda et al., 1963; Lonsdale, 1990; Osawa and Allen, 1993; Enquist et al., 1998, 1999; Hagihara, 2013) and spatial point process (Stoyan and Stoyan, 1994; Stoyan and Penttinen, 2000; Law et al., 2009) of individual trees based on a time series, for example, provides insights about the density-dependent mortality induced by local competition and its effect on the overall size of the surviving plants. In the present study, we aimed at addressing the following re-search questions, in particular: how are individual trees in a monospecific pioneer mangrove stand spatially distributed in the course of stand development? How does tree competition influence the demographic events, such as growth, mortal-ity, biomass, etc. during the stand development? How do tree competition and stand dynamics lead to spatial patterns in monospecific mangroves?
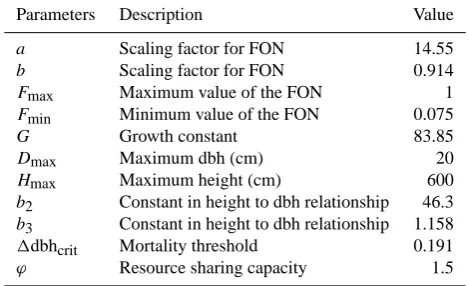
Table 1. Parameters used for the simulations of the mangrove Kan-delia obovata obtained according to procedure of pattern-oriented
modelling (POM) (Grimm et al., 1996, 2005; Fontalvo-Herazo et al., 2011) and field data.
Parameters Description Value
a Scaling factor for FON 14.55
b Scaling factor for FON 0.914
Fmax Maximum value of the FON 1
Fmin Minimum value of the FON 0.075
G Growth constant 83.85
Dmax Maximum dbh (cm) 20
Hmax Maximum height (cm) 600
b2 Constant in height to dbh relationship 46.3
b3 Constant in height to dbh relationship 1.158
1dbhcrit Mortality threshold 0.191
ϕ Resource sharing capacity 1.5
Note: FON-field of neighbourhood (Berger and Hildenbrandt, 2000).
2 Materials and methods
2.1 Experiment setup and study site
In order to investigate on the temporal change of structural and spatial patterns of individual trees in the mangrove stand, simulation experiments were performed using the individual-based model KiWi (Berger and Hildenbrandt, 2000), which was originally applied for a neotropical mangrove forest (Piou et al., 2006; Berger et al., 2008; Fontalvo-Herazo et al., 2011). For this purpose, at first field data were collected to parameterize the KiWi model so that the model could mimic the dynamic growth, competition and mortality in the monospecific mangrove stand of Kandelia obovata (S., L.) Yong (Table 1). The values of the model parameters were obtained according to the procedure of pattern-oriented mod-elling (POM) (Grimm et al., 1996, 2005; Fontalvo-Herazo et al., 2011).
Okinawa Island
20 km
Nuha River
East China Sea
Kyushu
Pacific Ocean
Ryu kyu
Isla nds
125 Eo 130 Eo 135 Eo 35 No
30 No
25 No JAP
AN
Kokuba River
Mangroves
sample plot
East China Sea
N
0.5 km
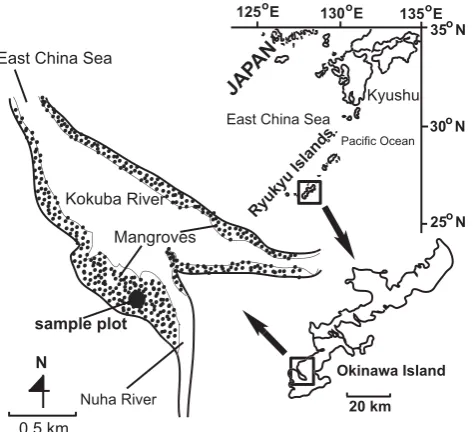
[image:3.595.51.288.62.278.2]Fig. 1
Fig. 1. Location of the study site in the Manko Mangroves,Oki-nawa, Japan.
stem position and neighbourhood competition. The mortal-ity increases with growth reduction. The establishment of new saplings depends on both environmental conditions at the particular location and competition strength at this loca-tion exerted by the already established trees (described by the sum of their FONs). A detailed description of the model fol-lowing the ODD (Overview, Design concepts, Details) proto-col for describing the individual-based models (Grimm and Railsback, 2005; Grimm et al., 2006, 2010) is provided in Table 2.
For the purpose of field validation, the modelled results were compared with field datasets, which were collected over two decades of stand development. The study site was located in the mangroves at Manko Wetland (26◦110N and 127◦400E), Okinawa Island, Japan (Fig. 1). The
man-grove Kandelia obovata (S., L.) Yong has formed continuous monospecific stands in the Manko Wetland. The species K. obovata is considered as a pioneer species in mangrove suc-cession. The stem diameter, height and thex−ycoordinates of all the trees in a 20×20 m2plot in a monospecific K. obo-vata stand were recorded at different time steps of stand de-velopment. In the study site, the mean tree height and den-sity in the monospecific stand (ca. 12 yr old) were recorded as ca. 4 m and 15 450 trees ha−1, respectively. Near the study site, the mean minimum, mean maximum and mean an-nual temperatures were 16.8◦C, 28.8◦C and 23.2◦C, respec-tively. Rainfall was over 100 mm month−1 throughout the year, and the mean annual rainfall was 2086 mm yr−1(Khan et al., 2004). The study plot was assumed to be equiformal (isotropic), i.e. without any effective gradient in terms of tidal inundation within the plot.
2.2 Data analyses
Using the field datasets, the coefficient of variation (CV %) of tree diameter and height against the cumulative sample area was used to describe the stand structure and to investigate the existence of horizontal heterogeneity of tree sizes in the Kandelia obovata stand.
Point pattern analyses were carried out (Stoyan and Stoyan, 1994; Stoyan and Penttinen, 2000) in order to gain a deeper understanding of the ecological drivers behind the spatial patterns. The pair correlation function (PCF) g(r), which is related to Ripley’sK function (Ripley, 1979), pro-vides a measure of the density of neighbouring plants and gives a general notion of a “plant’s eye” view (Turking-ton and Harper, 1979; Mahdi and Law, 1987; Law et al., 2009) of a vegetation assemblage. The PCF was used to de-tect uniform, clumped or random patterns in tree occurrence where trees are considered as points in a spatial point process (Stoyan and Stoyan, 1994):
g (r)= 1
2π r· dK(r)
dr , (1)
whereK(r)is the Ripley’s K function (Ripley, 1979) and r is the particular search radius. Provided thatP (r)is the probability of detecting points at locationsxandy within a distancer, andλis the intensity of the point process (Stoyan and Stoyan, 1994):
P (r)=λ2·g(r)·dx·dy, (2) where trees are completely randomly distributed (uniform Poisson process), then p(r)=λ2 and g(r)=1. Values g(r) <1 suggest that the trees are more regularly distributed. Values greater than 1 suggest a clustering.
In order to detect the dynamics of intraspecific competition over stand development, a mark correlation function (MCF) kmm(r)using dbh as marks (Stoyan and Stoyan, 1994; Getzin
et al., 2008; Law et al., 2009) was used. The MCF provides the distance-dependent size correlation of trees and detects whether competition affects tree growth. The MCF quantifies the similarity and dissimilarity between dbh marks of two neighbouring trees occurring at a distancerby the function f (m1, m2)=m1×m2, wherem1 andm2 are dbh values of the two trees. The termkmm(r)is defined as the normalized
mean value off (m1, m2)for all marks at distancer. Marks are considered independent, positively or negatively corre-lated at distancer ifkmm(r)=1,kmm(r) >1 orkmm(r) <1,
respectively. A positive mark correlation suggests a “mutual stimulation”, i.e. facilitation, and a negative mark correlation suggests a “mutual inhibition”. The MCF can be written in the following form:
kmm(r)=
E[f (m1, m2)]
E[f (M, M0)], (3)
Table 2. Model description following the ODD protocol (Grimm and Railsback, 2005; Grimm et al., 2006, 2010).
Overview
Purpose of the model The purpose of this study was to analyse the temporal change of the spatial distribution pattern of trees and stand
development in the monospecific mangrove K. obovata, where the trees compete with their neighbours for spatially limited resources such as space and light.
State variables and Individual trees are described primarily by their stem position, stem diameter (dbh), and age. Other descriptors such as
scales stem height or the dimension of the field-of-neighbourhood (FON), used to describe local neighbourhood competition
among trees, are derived from the dbh as shown in the growth function (see below). Species-dependent tree growth is calculated annually. The spatial dimension and shape of the forest stand are variable. Plot sizes of the simulation area
of 100 m×100 m were used for this study.
Process overview The following processes occur each year: establishment of new saplings, growth of existing trees, and tree mortality.
and scheduling The stem diameter of all trees is updated synchronously and the derived parameters such as tree height and FON
radius are re-calculated.
Design concepts
Emergence Population dynamics emerge from the life processes modified by tree-to-tree competition, e.g. oscillation dynamics
of tree densities and basal areas, or variations in the spatial distributions of trees ranging from clumped to random to regular, among others.
Interactions Trees compete for all spatially distributed resources (not explicitly specified) via their FONs.
Sensing Trees “sense” the distance, size and explicit location of their neighbours by their overlapping FONs.
Stochasticity Saplings establish randomly, depending on local conditions. There is a random mortality in addition to the density
dependent mortality, which is completely deterministic.
Observations The model provides yearly tracking of all state variables and derived parameters for all trees.
Details
Initialization Scenario 1: the forest area is to be colonized by trees located identically to the real plot, keeping the original tree
positions, original tree dbh and 12 yr as starting age. Scenario 2: stand development based on random tree
positions, an initial height of 1.37 m and a stem dbh of 2.5±0.25 cm, 1 yr as starting stand age and varying initial
stand densities (ca. 5000, 10 000, 15 000 and 20 000 at 12 yr stand age).
Input Yearly recruitment rates define the establishment of new saplings. Abiotic factors such as topography, inundation
height, inundation frequency, pore water salinity and nutrient availability can be addressed explicitly by user-supplied maps corresponding to the simulated forest stand; but for the purpose of this study they were considered to be optimal for the whole forest.
Submodels
Description of a A tree is described by itsx–yposition, dbh, and FON. The latter describes the area within which a tree influences its
single tree neighbours and is influenced by its neighbours. The radiusRof the FON increases with dbh:R=a·(dbh/2)b,
whereaandbare species-specific scaling factors (Table 1). The intensity of FON (r)=e−c(r−(dbh/2)).
Recruitment and Seedling growth is not explicitly modelled due to the lack of field data. Seedling growth and mortality, however, are
establishment implicitly included in the sapling recruitment rates. Saplings can establish if tree density and the resulting
intraspecific competition are below a certain threshold at the potential, randomly chosen location. This threshold mimics a given shade tolerance of the species.
Tree growth The model uses a JABOWA-type growth function, where the annual stem increment is a function of dbh and stem
heightH:11tdbh=
hG·dbh·{1−dbh·H /(dbh
max·Hmax)} 274+3b2·dbh−4b3dbh2
i
·(1−ϕ·CFON), withH=137+3b2·dbh−4b3dbh2.
This function is parameterized for optimal growth conditions. The growth multiplier (1 –ϕ.CFON)corrects the stem
increment depending on tree neighbourhood competition, whereϕrepresents the resource sharing capacity andCFON
represents the FON intensity in each individual tree. The growth multiplier stands at one for no neighbouring trees.
Competition The intensity of the FONs of all neighbouring trees on the FON of a focal tree is taken as a measure of the
competition strength the focal tree suffers. This value is related to the area of the FON of the focal tree, assuming that the influence of larger trees on smaller ones is stronger than vice versa.
Mortality The model considers mortality due to a prolonged period of growth depression. Since there is no field data available on
Self-thinning refers to the time trajectory of mean phy-tomasswand densityρof any specific population over time, and when density-dependent mortality is occurring (Yoda et al., 1963; Enquist et al., 1998, 1999). The time trajectory of wapproaches a line of constant slope with respect toρalong with the progress of growth and mortality. The relationship betweenwandρis given as
w=cρ−α. (4)
In the linearized form
lnw=lnc−α·lnρ, (5)
where α specifies the slope of the self-thinning line, and ln c the intercept with the vertical axis. The value of the intercept depends on the species and units of measurement (Yoda et al., 1963; Enquist et al., 1998, 1999; Silvertown and Charlesworth, 2001; Berger and Hildenbrandt, 2003). Based on different initial densities and the relationships ofwat dif-ferent stand ages to the correspondingρin the whole plot, the time trajectory (Ogawa, 2001; Ogawa and Hagihara, 2003; Ogawa, 2005) ofwandρwas approximated as
w=Kρ−α(1−ρ/ρ0)b, (6)
whereKandarepresentcandα, respectively, in Eq. (4),ρ0
specifies the initial density andbis a constant.
The individual tree weight was approximated using the al-lometric relationships which were established for the same stand as reported in a previous study (Khan et al., 2005). All data analyses were performed using R software version 2.15.2 (R Development Core Team, 2011); the point pattern analysis (pair correlation and mark correlation), in particular, was performed using the “spatstat” package of R (Baddeley and Turner, 2005).
2.3 Sensitivity analysis
Sensitivity analysis was performed using the extended Fourier amplitude sensitivity test (eFAST), a variance-based global sensitivity method (Cukier et al., 1978; Saltelli et al., 1999, 2000) for tracing the contribution of model parameters and of the corresponding processes in individual tree size. The eFAST is model-independent and is applicable irrespec-tive of the degree of linearity or additivity of the model. The method quantifies the contribution of the individual input pa-rameters to the variance of the output variables. It reveals both parameter main effects on the model output and the sum of the effects due to its higher-order interactions with other parameters (Saltelli et al., 2000; Saloranta and Ander-sen, 2007). At first, the model parameters were obtained (Ta-ble 1) according to procedure of pattern-oriented modelling (POM) (Grimm et al., 1996, 2005; Fontalvo-Herazo et al., 2011). Then following the specific sampling procedure of the SimLab software package (SimLab, 2011), different parame-ter sets were calculated with−10 % to+10 % ranges in each
a b G
0.0
0.2
0.4
0.6
0.8
1.0
Fmin Dmax Hmax b2 b3 dbhcrit φ
Model parameters
Proportions of the total variance
[image:5.595.312.548.62.197.2]Fig. 2
Fig. 2. Proportions of the total variance explained by model
param-eters (Table 1) with regard to the model output (mean tree weight at stand age 20 yr) analysed by the extended Fourier amplitude sen-sitivity test (eFAST) method. The white area (main effect) denotes the portion of total variance explained by the particular parameter alone, and the grey area (interactions) similarly the part explained by all parameter interactions where the particular parameter is in-cluded.
parameter described in Table 1 (exceptFmax, which is
con-stant for all the simulations). Next, the parameter sets were used for multiple simulation runs (65×10 parameters=650 simulations) and the model output (mean tree weight at time step 20) in each simulation was recorded. Finally, the in-put parameter sets (total 650) and the corresponding model output were used to perform the eFAST sensitivity analysis (Fig. 2) using the “sensitivity” package (Pujol et al., 2012) in R (R Development Core Team, 2011).
3 Results
3.1 Stand structure
The coefficient of variation (CV %) of tree diameter and height (field data) was plotted against the cumulative sample area (Fig. 3). It was observed that the CV of both height and diameter increases with increasing cumulative sample area, but after 200 m2area the CV is not influenced by the increas-ing sample area. This suggests the existence of little horizon-tal heterogeneity of tree size in the Kandelia obovata stand.
3.2 Modelling stand dynamics
The eFAST sensitivity analysis (Fig. 2) suggested that of the model parameters (Table 1) used in the simulation experi-ments,bis the most influential followed by the mortality pa-rameter1dbhcritand the growth parameterG. The parameter
0 100 200 300 400
Cumulative sample area (m )
Coefficient of
v
a
riation in tree diameter (%)
10 20 30 40
5 10 15 20
Coefficient of v
a
riation in tree height (%)
2
[image:6.595.51.289.59.260.2]Fig. 3
Fig. 3. Relationships of coefficient of variation of tree diameter andheight to cumulative sample area in the Kandelia obovata sample plot (◦diameter,•height).
in individual trees, and that the probability of death of an in-dividual tree depends on its growth performance.
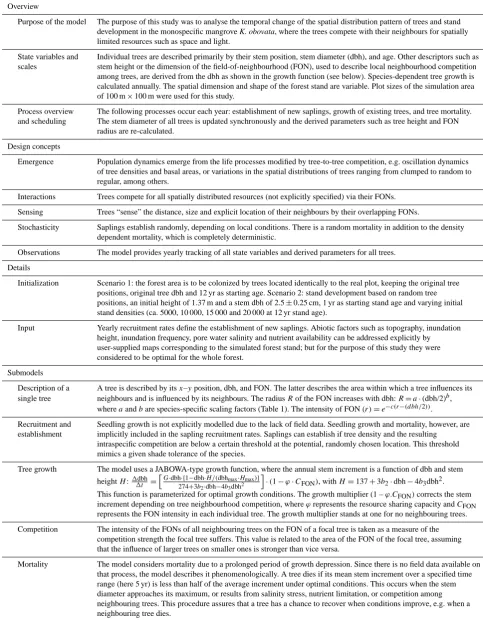
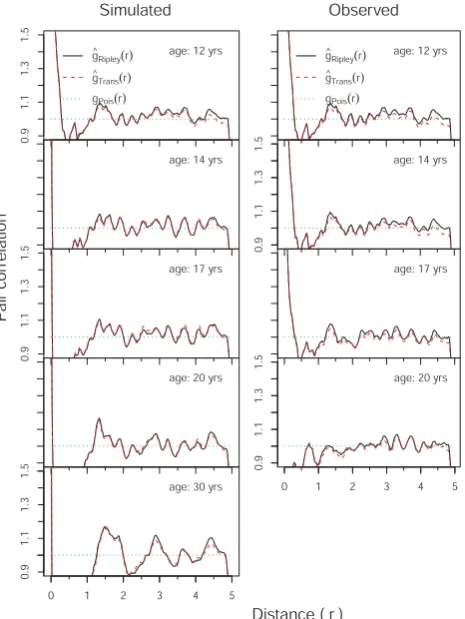
In the simulation experiments with an initialization (Sce-nario 1, Table 2) of forest area by trees located identically to the original tree positions, original tree dbh and 12 yr as starting age, it was evident that the time trajectory of mean tree weightwand densityρ(Fig. 4) in the Kandelia obovata stand follows the self-thinning line in the course of stand development. The simulated values of dynamic mean tree weight showed strong similarity to that of field data, sug-gesting the robustness of the KiWi model for predicting the dynamics in stand development of the mangrove K. obovata. Likewise, the relationships of pair correlation functiong(r) to distancerat different stand ages using the simulated and field datasets showed strong similarities (Fig. 5). In the young stage (12 yr old),g(r)shows large values (>“1”) for search radii smaller than 50 cm, verifying the clumping of trees in short distances (Fig. 5). The curve dropping below “1” for distances between 50 cm and 150 cm shows that trees tend to occur slightly regularly within these distances irrespective of age and dbh. However,g(r)specifies overall spatial random-ness in tree locations for larger distances. After the stand age reaches 20 yr (Fig. 5),g(r)shows changes from clumping to slight regularity for search radii smaller than 50 cm, and this trend continues up to a distance of 2 m. As stand growth pro-ceeds, theg(r)values for search radii of<2 m indicated that the spatial pattern of trees changes from clumped to more uniform distribution (Fig. 5).
In the young stage (12 yr old), the mark correlation func-tionkmm(r)confirmed the existence of intraspecific
compe-tition in the stand (Fig. 6) as indicated by the curve drop-ping below “1” (negative mark correlation) for distances up
Tree density (ha−1)
Mean tree w
eight (kg)
1000 10000 40000
1 10 100
Progress of stand age 12 yr 20 yr 30 yr
slope = −1.5
Fig. 4
Fig. 4. Time trajectory of mean tree weight (kg) in Kandeliaobo-vata in relation to stand development (•observed,◦simulated). The
curve represents the Eq. (6) fitted (R2=0.967) on the observed
dataset, where the coefficients are K=2.202×10⁶, a=1.299,
ρ0=3.164×10⁴andb=0.503. The straight line indicates the
so-called self-thinning line.
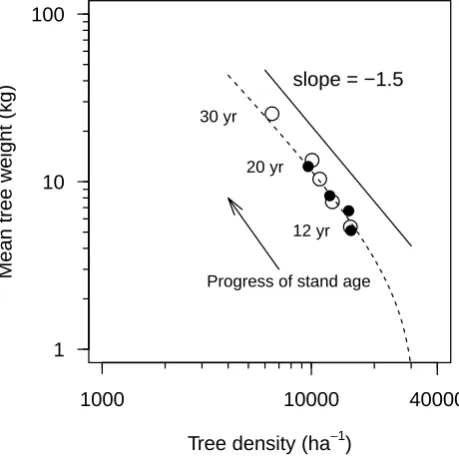
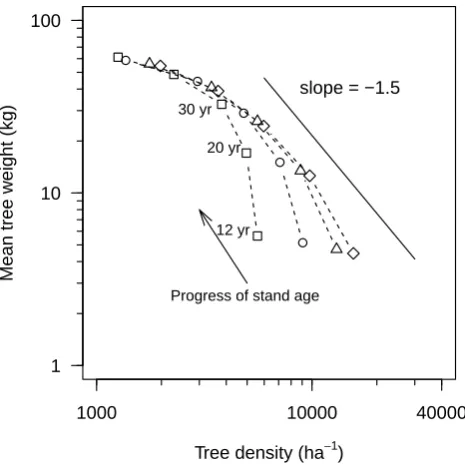
to 2 m. This suggests that neighbouring trees within 2 m dis-tance are dissimilar in size (dbh), confirming a growth inhi-bition among the neighbours, and large trees (similar in size) maintain a distance among themselves. This inhibition dis-tance reached up to 3 m after two decades of stand devel-opment (Fig. 6). The size distribution of mortality of trees confirmed that the smaller sized trees are more prone to die (Fig. 7), triggering the regularity of spatial pattern over stand development. The phenomenon of clumping in short dis-tances (Fig. 5) in young stage (observed data) and the spatial randomness in larger distances (observed and simulated data) are in agreement with the dynamics of tree size distribution indicating the high proportion of mortality in smaller trees. The mortality process in relation to stand density is further clarified by the simulation experiments with an initialization (Scenario 2, Table 2) of forest area by trees located on ran-dom initial tree positions, an initial height of 1.37 m and a stem dbh of 2.5±0.25 cm, 1 yr as starting age and varying stand densities. It was confirmed that the higher the initial stand density, the higher the rate of mortality and the quicker the stand reaches the so-called self-thinning line (Fig. 8).
4 Discussion
[image:6.595.312.542.64.295.2]0.9
1.1
1.3
1.5
g ^
Ripley(r)
g ^
Trans(r)
gPois(r)
age: 12 yrs
age: 14 yrs
0.9
1.1
1.3
1.5
age: 17 yrs
age: 20 yrs
0 1 2 3 4 5
0.9
1.1
1.3
1.5
age: 30 yrs
g ^
Ripley(r)
g ^
Trans(r)
gPois(r)
age: 12 yrs
0.9
1.1
1.3
1.5
age: 14 yrs
age: 17 yrs
0 1 2 3 4 5
0.9
1.1
1.3
1.5
age: 20 yrs
Distance ( r )
P
air correlation
Simulated Observed
Fig. 5
Fig. 5. Relationships of pair correlation functiong(r)to distancer at different stand age in the Kandelia obovata stand initiated with existing density and based on tree positions obtained from field
data. The solid lines indicate isotropic-corrected estimate ofg(r),
the dashed lines indicate translation-corrected estimate ofg(r)and
the dotted lines indicate Poisson’s expectation.
starting with the present configuration of the study sites, pro-vided a forecast of the stand development to be expected in the future. The combined analysis of empirical and simulated data was useful for both finding the baseline for stand devel-opment and producing a time series usually not available for mangrove forests, because of the absence of long-term mon-itoring data.
Although the modelled results of this study were validated based on a 400 m2 plot, which seems to be a small sample plot for a vegetation study, it was observed (Fig. 3) that after 200 m2cumulative area, the coefficient of variation (CV %) of tree diameter and height is not influenced by the increasing cumulative sample area, indicating the existence of less hor-izontal heterogeneity of tree sizes in the stand for a sample area larger than 200 m2. Thus, the sample plot is considered as a suitable representative of the model based on changes of the CV of tree diameter and height in relation to the cumu-lative sample area (Thompson, 1992). Considering the hori-zontal heterogeneity of tree sizes, larger sample plots would
0.90
1.00
1.10
1.20 kmmiso^(r) kmmtrans^ (r)
k
mm iid(r)
age: 12 yrs
age: 14 yrs
0.90
1.00
1.10
1.20 age: 17 yrs
age: 20 yrs
0 1 2 3 4 5
0.90
1.00
1.10
1.20 age: 30 yrs
age: 12 yrs
0.90
1.00
1.10
1.20 age: 14 yrs
age: 17 yrs
0 1 2 3 4 5
0.90
1.00
1.10
1.20 age: 20 yrs
Distance ( r )
Mar
k correlation
Simulated Observed
kmmiso^(r) kmmtrans^ (r)
k
mm iid(r)
[image:7.595.53.286.62.372.2]Fig. 6
Fig. 6. Relationships of mark correlation functionkmm(r)to
dis-tance r at different stand age in the Kandelia obovata stand
ini-tiated with existing density and based on tree positions obtained from field data. The solid lines indicate isotropic-corrected estimate ofkmm(r), the dashed lines indicate translation-corrected estimate
ofkmm(r)and the dotted lines indicate Poisson’s expectation.
not change the overall stand structure (if the site quality is assumed to be unchanged).
[image:7.595.315.546.62.371.2]0 5 10 15 20
0
1500
3000 age: 12 yrs
0 5 10 15 20
0
1500
3000
0 5 10 15 20
0
1500
3000 age: 14 yrs
0 5 10 15 20
0
1500
3000
0 5 10 15 20
0
1500
3000 age: 17 yrs
0 5 10 15 20
0
1500
3000
0 5 10 15 20
0
1500
3000 age: 20 yrs
0 5 10 15 20
0
1500
3000 age: 12 yrs
0 5 10 15 20
0
1500
3000
0 5 10 15 20
0
1500
3000 age: 14 yrs
0 5 10 15 20
0
1500
3000
0 5 10 15 20
0
1500
3000 age: 17 yrs
0 5 10 15 20
0
1500
3000
0 5 10 15 20
0
1500
3000 age: 20 yrs
Frequency (ha
−
1 )
dbh (cm)
Fig. 7
[image:8.595.311.544.61.294.2]Simulated Observed
Fig. 7. Frequency distribution of tree dbh along with the mortality
distribution in relation to stand development. Shaded bars indicate dead trees (with respect to previous census) and white bars indicate live trees.
(2009), are very suitable for describing stand parameters on higher hierarchical levels of the ecosystem (e.g. yield) but are not appropriate for the analysis, description and predic-tion of dynamic spatial patterns we are focusing on in the frame of this study. The parameters used for the experiments were tuned based on field experience, as well as results of previous reports (Khan et al., 2004, 2005, 2007, 2009) on the same study sites, where the simulated results were validated with real field data, for instance stand biomass production (Khan et al., 2009).
The mean tree weight (Fig. 4) and frequency distribution of dbh (Fig. 7) in simulated trees (Initialization: Scenario 1, Table 2) corresponded well to the observed datasets. This is a sign of validity of simulated results with observed data (see also Khan et al., 2009). The data points as time series of two decades reveal that density-dependent mortality already oc-curs and the self-thinning process has started. As shown in Fig. 8, the tree growth rate in independent populations having a low stand density is high, even if the populations are of the same age. If the tree growth is limited by resource availabil-ity, individuals are forced to compensate for their size, which in turn results in the mortality of some individuals. This ef-fect is popularly known as the competition–density (C–D) effect in non-self-thinning populations (Shinozaki and Kira, 1956; Silvertown and Doust, 1993; Xue and Hagihara, 2002, 2008; Hagihara, 2013). In the time trajectory, the slope a (i.e.αin the self-thinning line) values in the curves (Fig. 4, dashed line) were estimated as−1.299, which is not as steep
Tree density (ha−1)
Mean tree w
eight (kg)
1000 10000 40000
1 10 100
Progress of stand age 12 yr
20 yr 30 yr
slope = −1.5
Fig. 8
Fig. 8. Relationships of mean tree weight (kg) to tree density (ha−1) in relation to stand development. The arrow indicates the progress of time during stand development based on different initial densities
(5000, 10 000, 415 000, ♦20 000 trees ha−1). The straight
line indicates the so-called self-thinning line.
as the so-called self-thinning slope:−1.5 (i.e.−3/2). This is, however, very close to −1.333 (i.e. −4/3) as suggested by some investigators (e.g. Lonsdale, 1990; Osawa and Allen, 1993; Enquist et al., 1998, 1999). In agreement with Zeide (1985), Weller (1987), and Berger and Hildenbrandt (2003), however, no particular slope value is claimed. The pattern of density-dependent mortality (Fig. 7) suggests a higher mor-tality of smaller trees in older stands due to intraspecific com-petition (Xue et al., 1999; Ogawa and Hagihara, 2003), which is supported by the earlier findings that K. obovata is intoler-ant to shade (Khan et al., 2004), and the trees strongly com-pete for light as is true for other heliophytes (T¨uffers et al., 1999; Ball et al., 1988). In the case of a closed-canopy stand when larger trees obstruct light to smaller ones, the smaller trees are thinned out because of the shade of larger ones re-sulting in low photosynthetic production in the former, which still have a respiration cost (Weiner and Whigham, 1988; Suwa et al., 2006).
[image:8.595.51.288.61.305.2]growth (Fig. 6). The causes of the clumping process can be manifold, ranging from heterogeneities in seed availability due to stochasticity in seed dispersal to heterogeneities in micro-environmental conditions influencing the growth and survival of the plants (Clarke and Allaway, 1993; Frelich et al., 1993; Osunkoya and Greese, 1997; Yamada and Suzuki, 1997; Dahdouh-Guebas et al., 2007; Krauss et al., 2008). The regularity among the individuals, as indicated by the drop-ping ofg(r)values below “1” along with the increasing stand ages, reflects the intraspecific competition in the monospe-cific stand. When a short search radius is concerned, after the stand grows older the disappearance of clumping and the change of the spatial pattern of trees to more regularity in-dicates the existence of intraspecific competition resulting in a density-dependent mortality. The intraspecific competition and the density-dependent mortality would cause the spatial pattern of individuals to become more regular over stand de-velopment. The negative spatial association between trees of different sizes (mutual inhibition of growth), as indicated by the negative values ofkmm(r)within 2 m distance during the
early stage and within 3 m distance after two decades of stand development, is an indication that small trees are associ-ated with large neighbouring trees if competition suppresses growth (Law et al., 2009). The overall spatial randomness in tree locations for larger distances (>2 m in young stage and >3 m after two decades) might be related to a smaller tree crown in the K. obovata as a light-loving species (Khan et al., 2004; Suwa et al., 2006) and dwarf mangrove type (Lee, 1989), and the trees are not large enough to pose any shading threat to neighbours at large distances.
In conclusion, this study is based on a combination of empirical and simulated data describing the early stage of mangrove stand development. Simulation experiments used the current constellation of the empirical plots as the initial configuration, providing a forecast of future stand develop-ment. The experiments were carried out by means of the mangrove forest simulator KiWi, being the first individual-based model parameterized to South-east Asian mangroves. This study provides insights on spatial patterns of individual trees along with the stand dynamics: in young stage smaller clumps have been detected and self-thinning has started but has not yet lead to a regularity of spatial tree distribution in the entire stand; trees located in smaller clumps hinder each other in growth but do not lead to a significant size class dif-ferentiation; after ca. 2 decades the self-thinning and the size class differentiation start to become visible; as stand grows older the spatial pattern of individuals becomes more regular from a clustered pattern; and the mutual inhibition of growth and the resultant mortality of smaller size class would cause the change of the spatial pattern. Although this study repre-sents a constrained species-specific model (every important point that is specific for this model as compared to a more generic mangrove) towards understanding the dynamics of spatial distribution of individual trees along with stand de-velopment, we hope that it will stimulate further research
in this direction. In this work, we described the changes in spatial patterns in light of competition. However, other driv-ing forces, such as environmental factors or dispersal pattern may also show profound influence on the changes in tree spa-tial patterns.
Acknowledgements. We are grateful to L. Alhamd and S. M. Feroz
who provided invaluable assistance during data collection. We thank Juliane Vogt for her assistance with the parameterization of the KiWi model for the simulation experiments. We also thank the Ministry of Environment, Japan, for access to the wildlife sanctuary, and the Tomigusuku Community for permitting us to use their land. This study was partially supported by a Grant-in-Aid for Scientific Research from the Ministry of Education, Culture, Sports, Science, and Technology, Japan (nos. 16201009 and 16651009), and by the 21st Century COE program – University of the Ryukyus, Japan. The simulation experiments and data analysis performed in the Institute of Forest Growth and Forest Computer Sciences, Technische Universit¨at Dresden (Germany) were supported by the Alexander von Humboldt Foundation, Germany. The study was completed after combing additional field data and simulation experiments as part of the project “Ecological functionality and stability of mangrove ecosystems: a modeling approach” under the grant type “Mandat d’Impulsion Scientifique” (MIS ID 1765914) of the National Science Foundation (FNRS), Belgium. We also would like to thank the anonymous reviewers for their valuable comments to improve the manuscript. This paper was presented at the conference MMM3: Meeting on Mangrove ecol-ogy, functioning and Management, Galle, Sri Lanka, 2–6 July 2012.
Edited by: S. Behara
References
Alongi, D. M., Tirendi, F., and Clough, B. F.: Below-ground de-composition of organic matter in forests of the mangroves,
Rhi-zophora stylosa and Avicennia marina, along the arid coast of
Western Australia, Aquat. Bot., 68, 97–122, doi:10.1016/S0304-3770(00)00110-8, 2000.
Alongi, D. M., Sasekumar, A., Chong, V. C., Pfitzner, J., Trott, L. A., Tirendi, F., Dixon, P., and Brunskill, G. J.: Sedi-ment accumulation and organic material flux in a managed mangrove ecosystem: estimates of land-ocean-atmosphere ex-change in peninsular Malaysia, Mar. Geol., 208, 383–402, doi:10.1016/j.bbr.2011.03.031, 2004.
Asaeda, T. and Kalibbala, M.: Modelling growth and primary pro-duction of the marine mangrove (Rhizophora apiculata BL): A dynamic approach, J. Exp. Mar. Biol. Ecol., 371, 103–111, doi:10.1016/j.jembe.2009.01.009, 2009.
Baddeley, A. and Turner, R.: Spatstat: an R package for analyzing spatial point patterns, J. Stat. Softw., 12, 1–42, 2005.
Ball, M. C.: Salinity tolerance in the mangroves Aegiceras
cornic-ulatum and Avicennia marina. I. Water use in relation to growth,
carbon partitioning, and salt balance, Aust. J. Plant Physiol., 15, 447–464, 1988.
water loss in a tropical mangrove forest, Aust. J. Plant Physiol., 15, 263–276, doi:10.1071/PP9880263, 1988.
Berger, U. and Hildenbrandt, H.: A new approach to spatially ex-plicit modelling of forest dynamics: spacing, ageing and neigh-bourhood competition of mangrove trees, Ecol. Model., 132, 287–302, doi:10.1016/S0304-3800(00)00298-2, 2000.
Berger, U. and Hildenbrandt, H.: The strength of
compe-tition among individual trees and the biomass-density
trajectories of the cohort, Plant Ecol., 167, 89–96,
doi:10.1023/A:1023965512755, 2003.
Berger, U., Rivera-Monroy, V. H., Doyle, T. W., Dahdouh-Guebas, F., Duke, N. C., Fontalvo-Herazo, M. L., Hildenbrandt, H., Koedam, N., Mehlig, U., Piou, C., and Twilley, R. R.: Advances and limitations of individual-based models to analyze and pre-dict dynamics of mangrove forests: a review, Aquat. Bot., 89, 260–274, doi:10.1016/j.aquabot.2007.12.015, 2008.
Canham, C. D., LePage, P. T., and Coates, K. D.: A neighborhood analysis of canopy tree competition: effects of shading versus crowding, Can. J. Forest Res., 34, 778–787, doi:10.1139/X03-232, 2004.
Cannicci, S., Burrows, D., Fratini, S., Lee, S. Y., Smith III, T. J., Offenberg, J., and Dahdouh-Guebas, F.: Fau-nal impact on vegetation structure and ecosystem function in mangrove forests: a review, Aquat. Bot., 89, 186–200, doi:10.1016/j.aquabot.2008.01.009, 2008.
Castaneda-Moya, E., Rivera-Monroy, V. H., and Twilley,
R. R.: Mangrove zonation in the dry life zone of the Gulf of Fonseca, Honduras, Estuar. Coasts, 29, 751–764, doi:10.1007/BF02786526, 2006.
Chen, R. and Twilley, R. R.: A gap dynamic model of man-grove forest development along gradients of soil salinity and nutrient resources, J. Ecol., 86, 37–51, doi:10.1046/j.1365-2745.1998.00233.x, 1998.
Cintron, G., Lugo, A. E., Pool, D. J., and Morris, G.: Mangroves of arid environment in Puerto Rico and adjacent islands, Biotropica, 10, 110–121, 1978.
Clarke, P. J.: Dispersal of grey mangrove (Avicennia marina) propagules in south eastern Australia, Aquat. Bot., 45, 195–204, doi:10.1016/0304-3770(93)90021-N, 1993.
Clarke, P. J. and Allaway, W. G.: The regeneration niche of grey mangrove (Avicennia marina): effects of salinity, light and sed-iment factors on establishment, growth and survival in the field, Oecologia, 93, 548–556, doi:10.1007/BF00328964, 1993. Clarke, P. J. and Myerscough, P. J.: Buoyancy of Avicennia marina
propagules in south-eastern Australia, Aust. J. Bot., 39, 77–83, doi:10.1071/BT9910077, 1991.
Clarke, P. J. and Myerscough, P. J.: The intertidal distribution of the grey mangrove (Avicennia marina) in southeastern Australia: the effects of physical conditions, interspecific competition and pre-dation on propagule establishment and survival, Aust. J. Ecol., 18, 307–315, doi:10.1111/j.1442-9993.1993.tb00458.x, 1993. Comley, B. W. T. and McGuinness, K. A.: Above- and
below-ground biomass, and allometry, of four common north-ern Australian mangroves, Aust. J. Bot., 53, 431–436, doi:10.1071/BT04162, 2005.
Cukier, R. I., Levine, H. B., and Shuler, K. E.: Nonlinear sensitivity analysis of multi-parameter model systems, J. Comput. Phys., 26, 1–42, doi:/10.1016/0021-9991(78)90097-9, 1978.
Dahdouh-Guebas, F. and Koedam, N.: Empirical estimate of the reliability of the use of the Point-Centred Quarter Method (PCQM): Solutions to ambiguous field situations and
descrip-tion of the PCQM+ protocol, Forest Ecol. Manag., 228, 1–18,
doi:10.1016/j.foreco.2005.10.076, 2006.
Dahdouh-Guebas, F., Kairo, J. G., De Bondt, R., and Koedam, N.: Pneumatophore height and density in relation to microtopogra-phy in the grey mangrove Avicennia marina, Belg. J. Bot., 140, 213–221, 2007.
DeLange, W. P. and DeLange, P. J.: An appraisal of factors control-ling the latitudinal distribution of mangrove (Avicennia marina var. resinifera) in New Zealand, J. Coastal Res., 10, 539–548, 1994.
Di Nitto, D., Dahdouh-Guebas, F., Kairo, J. G., Decleir, H., and Koedam, N.: Digital terrain modelling to investigate the effects of sea level rise on mangrove propagule establishment, Mar. Ecol.-Prog. Ser., 356, 175–188, doi:10.3354/meps07228, 2008. Ellison, A. M.: Macroecology of mangroves: large-scale patterns
and processes in tropical coastal forests, Trees, 16, 181–194, doi:10.1007/s00468-001-0133-7, 2002.
Enquist, B. J., Brown, J. H., and West, G. B.: Allometric scaling of plant energetics and population density, Nature, 395, 163–165, doi:10.1038/25977, 1998.
Enquist, B. J., West, G. B., Charnov, E. L., and Brown, J. H.: Allo-metric scaling of production and life-history variation in vascular plants, Nature, 401, 907–911, doi:10.1038/44819, 1999. Fontalvo-Herazo, M. L., Piou, C., Vogt, J., Saint-Paul, U., and
Berger, U.: Simulating harvesting scenarios towards the sustain-able use of mangrove forest plantations, Wetl. Ecol. Manag., 19, 397–407, doi:10.1007/s11273-011-9224-4, 2011.
Frelich, L. E., Calcote, R. R., Davis, M. B., and Pastor, J.: Patch formation and maintenance in an old-growth hemlock-hardwood forest, Ecology, 74, 513–527, doi:10.2307/1939312, 1993. Getzin, S., Wiegand, K., Schumacher, J. and Gougeon, F.
A.: Scale-dependent competition at the stand level assessed from crown areas, For. Ecol. Manage., 255, 2478–2485, doi:10.1016/j.foreco.2008.01.007, 2008.
Grimm, V. and Railsback, S. F. (Eds.): Individual-based Modelling and Ecology, Princeton Series in Theorical and Computational Biology, Princeton University Press, 2005.
Grimm, V., Franka, K., Jeltsch, F., Brandla, R., Uchmariskib, J. and Wissela, C.: Pattern-oriented modelling in population ecology, The Science of the total environment, 183, 151–166, doi:10.1016/0048-9697(95)04966-5, 1996.
Grimm, V., Revilla, E., Berger, U., Jeltsch, F., Mooij, W. M., Rails-back, S. F., Thulke, H.-H., Weiner, J., Wiegand, T. and DeAn-gelis, D. L.: Pattern-oriented modeling of agent-based com-plex systems: lessons from ecology., Science, 310, 987–91, doi:10.1126/science.1116681, 2005.
Grimm, V., Berger, U., DeAngelis, D. L., Polhill, J. G., Giske, J., and Railsback, S. F.: The ODD protocol: a review and first update, Ecol. Model., 221, 2760–2768, doi:10.1016/j.ecolmodel.2010.08.019, 2010.
Hagihara, A.: Deriving the mean mass–density trajectory by recon-ciling the competition–density effect law with the self-thinning law in even-aged pure stands, J. Forest Res.-Jpn., in press, doi:10.1007/s10310-013-0393-2, 2013.
Hegland, S. J., van Leeuwen, M., and Oostermeijer, J. G. B.: Pop-ulation structure of Salvia pratensis in relation to vegetation and management of Dutch dry floodplain grasslands, J. Appl. Ecol., 38, 1277–1289, 2001.
Jayatissa, L. P., Dahdouh-Guebas, F., and Koedam, N.: A review of the floral composition and distribution of mangroves in Sri Lanka, Bot. J. Linn. Soc., 138, 29–43, 2002.
Kairo, J. G., Dahdouh-Guebas, F., Gwada, P. O., Ochieng, C., and Koedam, N.: Regeneration status of Mangrove forests in Mida Creek, Kenya: a compromised or secured future?, Ambio, 31, 562–568, doi:10.1579/0044-7447-31.7.562, 2002.
Kathiresan, K. and Bingham, B. L.: Biology of mangroves and mangrove ecosystems, Adv. Mar. Biol., 40, 81–251, doi:10.1016/S0065-2881(01)40003-4, 2001.
Khan, M. N. I., Suwa, R., Hagihara, A., and Ogawa, K.: Intercep-tion of photosynthetic photon flux density in a mangrove stand of Kandelia candel (L.) Druce, J. For. Res.-Jpn., 9, 205–210, doi:10.1007/s10310-003-0074-7, 2004.
Khan, M. N. I., Suwa, R., and Hagihara, A.: Allometric rela-tionships for estimating the aboveground phytomass and leaf area of mangrove Kandelia candel (L.) Druce trees in the Manko Wetland, Okinawa Island, Japan, Trees, 19, 266–272, doi:10.1007/s00468-004-0377-0, 2005.
Khan, M. N. I., Suwa, R., and Hagihara, A.: Carbon and nitrogen pools in a mangrove stand of Kandelia obovata (S., L.) Yong: vertical distribution in the soil-vegetation system, Wetl. Ecol. Manag., 15, 141–153, doi:10.1007/s11273-006-9020-8, 2007. Khan, M. N. I., Suwa, R., and Hagihara, A.: Biomass and
above-ground net primary production in a pioneer mangrove
Kan-delia obovata (S., L.) Yong at Manko Wetland, Okinawa Island,
Japan, Wetl. Ecol. Manag., 17, 585–599, doi:10.1007/s11273-009-9136-8, 2009.
Krause, G., Schories, D., Glaser, M., and Diele, K.: Spatial patterns of mangrove ecosystems: the Bragantinian mangroves of north-ern Brazil (Braganc¸a, Par´a), Ecotropica, 7, 93–107, 2001. Krauss, K. W., Lovelock, C. E., McKee, K. L., L´opez-Hoffman, L.,
Ewe, S. M., and Sousa, W. P.: Environmental drivers in mangrove establishment and early development: a review, Aquat. Bot., 89, 105–127, doi:10.1016/j.aquabot.2007.12.014, 2008.
Kristensen, E., Bouillon, S., Dittmar, T., and Marchand, C.: Organic carbon dynamics in mangrove ecosystems: a review, Aquat. Bot., 89, 201–219, doi:10.1016/j.aquabot.2007.12.005, 2008. Kubota, Y.: Spatial pattern and regeneration dynamics in a
temper-ate Abies–Tsuga forest in southwestern Japan, J. For. Res.-Jpn., 11, 191–201, doi:10.1007/s10310-006-0205-z, 2006.
Law, R., Illian, J., Burslem, D., Gratzer, G., Gunatilleke, C., and Gunatilleke, I.: Ecological information from spatial patterns of plants: insights from point process theory, J. Ecol., 97, 616–628, doi:10.1111/j.1365-2745.2009.01510.x, 2009.
Lee, S. Y.: Litter production and turnover of the mangrove
Kan-delia candel (L.) druce in a Hong Kong tidal shrimp pond, Estuar.
Coast. Shelf S., 29, 75–87, 1989.
Liao, W. B., Lan, C. Y., Zan, Q. J., Wong, Y. S., and Tam, N. F. Y.: Growth dynamics and self-thinning of the dominant populations in the mangrove community, Acta. Bot. Sin., 46, 522–532, 2004. Lonsdale, W. M.: The self-thinning rule: dead or alive?, Ecology,
71, 1373–1388, doi:10.2307/1938275, 1990.
Machiwa, F. and Hallberg, R. O.: An empirical model of the fate of organic carbon in a mangrove forest partly affected by anthro-pogenic activity, Ecol. Model., 147, 69–83, doi:10.1016/S0304-3800(01)00407-0, 2002.
Mahdi, A. and Law, R.: On the spatial organization of plant species in a limestone grassland community, J. Ecol., 75, 459–476, 1987. Manabe, T., Nishimura, N., Miura, M., and Yamamoto, S.: Popu-lation structure and spatial patterns for trees in a temperate old-growth evergreen broad-leaved forest in Japan, Plant Ecol., 151, 181–197, doi:10.1023/A:1026512404110, 2000.
McKee, K. L.: Seedling recruitment patterns in a
Be-lizean mangrove forest: effects of establishment ability and physico-chemical factors, Oecologia, 101, 448–460, doi:10.1007/BF00329423, 1995.
Mumby, P. J., Edwards, A. J., Arias-Gonz´alez, J. E., Lindeman, K. C., Blackwell, P. G., Gall, A., Gorczynska, M. I., Har-borne, A. R., Pescod, C. L., Renken, H., Wabnitz, C. C. C., and Llewellyn, G.: Mangroves enhance the biomass of coral reef fish communities in the Caribbean, Nature, 427, 533–536, doi:10.1038/nature02286, 2004.
Ogawa, K.: Time trajectories of mass and density in a
Chamae-cyparis obtusa seedling population, Forest Ecol. Manag., 142,
291–296, doi:10.1016/S0378-1127(00)00358-3, 2001.
Ogawa, K.: Time-trajectory of mean phytomass and density dur-ing a course of self-thinndur-ing in a sugi (Cryptomeria
japon-ica D. Don) plantation, Forest Ecol. Manag., 214, 104–110,
doi:10.1016/j.foreco.2005.03.067, 2005.
Ogawa, K. and Hagihara, A.: Self-thinning and size variation in a sugi (Cryptomeria japonica D. Don) plantation, Forest Ecol. Manag., 174, 413–421, doi:10.1016/S0378-1127(02)00062-2, 2003.
Osawa, A. and Allen, R. B.: Allometric theory explains self-thinning relationships of mountain beech and red pine, Ecology, 74, 1020–1032, doi:10.2307/1940472, 1993.
Osunkoya, O. O. and Greese, R.: Population structure, spatial pat-tern and seedling establishment of the grey mangrove, Avicennia
marina, var. Australasia, in New Zealand, Aust. J. Bot., 45, 707–
725, doi:10.1071/BT96070, 1997.
Piou, C., Feller, I. C., Berger, U., and Chi, F.: Zonation patterns of belizean offshore mangrove forests 41 years after a catas-trophic hurricane, Biotropica, 38, 365–374, doi:10.1111/j.1744-7429.2006.00156.x, 2006.
Pujol, G., Iooss, B., and Janon, A.: Sensitivity: Sensitivity Analy-sis. R package version 1.6. http://CRAN.R-project.org/package= sensitivity, 2012.
R Development Core Team: R: A language and environment for sta-tistical computing. R Foundation for Stasta-tistical Computing, Vi-enna, Austria, ISBN 3-900051-07-0, http://www.R-project.org/, 2011.
Ripley, B. D.: Test of randomness for spatial point patterns, J. Roy. Stat. Soc. B., 41, 368–374, 1979.
R¨onnb¨ack, P.: The ecological basis for economic value of seafood production supported by mangrove ecosystems, Ecol. Econ., 29, 235–252, doi:10.1016/S0921-8009(99)00016-6, 1999.
Salas, C., LeMay, V., Nunez, P., Pacheco, P., and Espinosa, A.: Spatial patterns in an old-growth Nothofagus obliqua for-est in south-central Chile, Forfor-est Ecol. Manag., 231, 38–46, doi:10.1016/j.foreco.2006.04.037, 2006.
Saloranta, T. M. and Andersen, T.: MyLake – a multi-year lake simulation model code suitable for uncertainty and sensitivity analysis simulations, Ecol. Model., 207, 45–60, doi:10.1016/j.ecolmodel.2007.03.018, 2007.
Saltelli, A., Tarantola, S., and Chan, K. P. S.: A quantitative model-independent method for global sensitivity analysis of model out-put, Technometrics, 41, 39–56, doi:10.2307/1270993, 1999. Saltelli, A., Chan, K., and Scott, E. M. (Eds.): Sensitivity Analysis,
John Wiley & Sons, Chichester, UK, 2000.
Sherman, R. E., Fahey, T. J., and Martinez, P.: Spatial patterns of biomass and aboveground net primary productivity in a man-grove ecosystem in the Dominican Republic, Ecosystems, 6, 384–398, doi:10.1007/s10021-002-0191-8, 2003.
Shinozaki, K. and Kira, T.: Intraspecific competition among higher plants. VII. Logistic theory of the C-D effect, Journal of the In-stitute of Polytechnics, Osaka City University, 7, 35–72, 1956. Shinozaki, K. and Kira, T.: The C-D rule, its theory and practical
uses. (Intraspecific competition among higher plants X.), Journal of Biology Osaka City University, 12, 69–82, 1961.
Shugart, H. H.: A Theory of Forest Dynamics: The Ecological Im-plications of Forest Succession Models, Springer-Verlag, New York, 1984.
Silvertown, J. W. and Charlesworth, D. (Eds.): Introduction to plant population biology, Blackwell Science Ltd., Oxford, UK, 2001. Silvertown, J. W. and Doust, J. L. (Eds.): Introduction to plant
pop-ulation biology, Blackwell Science Ltd., Oxford, UK, 1993. SimLab: Version 2.2. Simulation Environment for Uncertainty and
Sensitivity Analysis, developed by the Joint Research Centre of the European Commission. http://simlab.jrc.ec.europa.eu/, 2011 Souza, A. F. and Martins, F. R.: Population structure and
dy-namics of a neotropical palm in fire-impacted fragments of the Brazilian Atlantic Forest, Biodivers. Conserv., 13, 1611–1632, doi:10.1023/B:BIOC.0000029326.44647.7f, 2004.
Stoyan, D. and Penttinen, A.: Recent Applications of Point Pro-cess Methods in Forestry Statistics, Stat. Sci., 15, 61–78, doi:10.1214/ss/1009212674, 2000.
Stoyan, D. and Stoyan, H. (Eds.): Fractals, random shapes, and point fields: methods of geometrical statistics. Chichester, John Wiley & Sons, 1994.
Suwa, R., Khan, M. N. I., and Hagihara, A.: Canopy photosynthe-sis, canopy respiration and surplus production in a subtropical mangrove Kandelia candel forest, Okinawa Island, Japan, Mar. Ecol.-Prog. Ser., 320, 131–139, doi:10.3354/meps320131, 2006. Thibodeau, F. R. and Nickerson, N. H.: Differential oxidation of mangrove substrate by Avicennia germinans and Rhizophora
mangle, Am. J. Bot., 73, 512–516, 1986.
Thompson, S. K.: Sampling. John Wiley & Sons, Inc., New York, 1992.
T¨uffers, A. V., Naidoo, G., and Willert, D. J. V.: The contribution of leaf angle to photoprotection in the mangroves Avicennia
ma-rina (Forssk.) Vierh. and Bruguiera gymnorrhiza (L.) Lam. under
field conditions in South Africa, Flora, 194, 267–275, 1999. Turkington, R. and Harper, J. L.: The growth, distribution and
neighbour relationships of Trifolium repens in a permanent pas-ture. I Ordination, pattern and contact, J. Ecol., 67, 201–218, 1979.
Weiner, J. and Whigham, D. F.: Size variability and self-thinning in wild-rice (Zizania aquatica), Am. J. Bot., 75, 445–448, 1988.
Weller, D. E.: A re-evaluation of the−3/2 power rule of plant
self-thinning, Ecol. Monogr., 57, 23–43, 1987.
Wilson, R. J., Thomas, C. D., Fox, R., Roy, D. B., and Kunin, W. E.: Spatial patterns in species distributions reveal biodiversity change, Nature, 432, 393–396, doi:10.1038/nature03031, 2004. Xue, L. and Hagihara, A.: Growth analysis on the C–D effect in
self-thinning Masson pine (Pinus massoniana) stands, Forest Ecol. Manag., 165, 249–256, doi:10.1016/S0378-1127(01)00622-3, 2002.
Xue, L. and Hagihara, A.: Growth analysis of the competition– density effect in non-self-thinning Populus deltoids and
Popu-lus×euramericana plantations, J. For. Res-Jpn., 13, 241–248,
doi:10.1007/s10310-008-0070-z, 2008.
Xue, L., Ogawa, K., Hagihara, A., Liang, S., and Bai, J.: Self-thinning exponents based on the allometric model in Chinese pine (Pinus tabulaeformis Carr.) and Prince Rupprecht’s larch (Larix principis-rupprechtii Mayr) stands, Forest Ecol. Manag., 117, 87–93, doi:10.1016/S0378-1127(98)00472-1, 1999. Yamada, T. and Suzuki, E.: Changes in spatial distribution
dur-ing the life history of a tropical tree, Scaphium
macropo-dum (Sterculiaceae) in Borneo, J. Plant. Res., 110, 179–186,
doi:10.1007/BF02509306, 1997.
Yoda, K., Kira, T., Ogawa, H., and Hozumi, K.: Self-thinning in overcrowded pure stands under cultivated and natural conditions. (Intraspecific competition among higher plants XI.), Journal of Biology Osaka City University, 14, 107–129, 1963.
Zeide, B.: Tolerance and self-tolerance of trees, Forest Ecol.
Manag., 13, 149–166, doi:10.1016/0378-1127(85)90031-3,