Creative Components Iowa State University Capstones, Theses and Dissertations
Fall 2018
Effect of Population Density Changes and Ear Style on Kernel Size
Effect of Population Density Changes and Ear Style on Kernel Size
and Yield in Grain Corn
and Yield in Grain Corn
Doug Becher
Iowa State University, [email protected]
Follow this and additional works at: https://lib.dr.iastate.edu/creativecomponents
Part of the Agriculture Commons
Recommended Citation Recommended Citation
Becher, Doug, "Effect of Population Density Changes and Ear Style on Kernel Size and Yield in Grain Corn" (2018). Creative Components. 44.
https://lib.dr.iastate.edu/creativecomponents/44
1
EFFECT OF POPULATION DENSITY CHANGES AND EAR STYLE ON KERNEL SIZE AND YIELD IN GRAIN CORN
by
Doug Becher
A creative component submitted to the graduate faculty
in partial fulfillment of the requirements for the degree of
MASTER OF SCIENCE
Major: Agronomy
Program of Study Committee: A. Susana Goggi, Major Professor
Andrew W. Lenssen Mark E. Westgate
Iowa State University
Ames, Iowa
2018
2
TABLE OF CONTENTS
Page
Introduction ……….. 3
Materials and Methods ………. 7
Results .………. 10
Discussion and Conclusion ...……….. 15
References ... 21
3
INTRODUCTION
“Ear flex” in corn (Zea mays L.) is defined as the variability of ear size which results
from environmental conditions throughout the growing season (Anderson, 2000). Ear flex is
determined by three components; ear length (number of ovaries per row), ear girth (number
of rows around the ear) and kernel size (volume/kernel). Of these components, kernel size is
often overlooked. Kernel size takes into account the depth, width, length, and weight of the
individual kernels (Penn State Extension, 2014). The number of kernel rows in ears of hybrid
corn typically range from 10 to 24. The final kernel row number is determined by branching
patterns at the rachis apex around V6 growth stage of the plant. The number of ovaries per
row of the ear is complete about one to two weeks before silk emergence occurs and the final
ear length (cm) is determined after anthesis. (Purdue Agronomy Department, 2002). The
environmental conditions during these developmental stages impact potential kernel number.
Some of the factors that limit kernel set include; the lack of moisture, too much moisture,
lack of nutrients, insufficient light reception, various diseases, and/or pest issues to list a few.
Ideal growing conditions enable the development of more kernel rows and more ovaries per
row or longer ear length. Both of these factors are determined primarily by genetics. The
number of ovary rows is fairly stable across environments. Ovaries per row, however, can be
more variable.
Once the number of potential kernels has been set, the next step of kernel yield
development is the ability of the plant to fill this preset grain potential. This development is
also dependent on and determined by the environmental conditions during the remainder of
the season. The growing conditions between pollination and black layer formation (defined
4
terminology) can impact the size and weight of each kernel (Borras et al., 2004). When
growing conditions are ideal, kernel size is maximized, leading to larger, heavier seed.
Conversely, when the crop is growing under stressful environmental conditions, the kernel
size is reduced.
Genetic makeup is also a major contributor to potential ear development. “A hybrids
genetics is instrumental in determining the potential number of rows per ear, environmental
factors have a lesser influence” (Iowa State University, 2006). Each corn hybrid has a
genetically predetermined range of kernel rows. Certain hybrids produce ears with fewer
rows of kernels (from 10-16 rows) while others produce ears with 18-24 rows. Logically,
hybrids that produce 18-24 kernel rows should yield more than hybrids with 10-16 rows.
However, this is not always the case. For example, ears with high kernel counts may have
smaller kernels and, therefore, it takes more kernels to make a bushel. The combination of
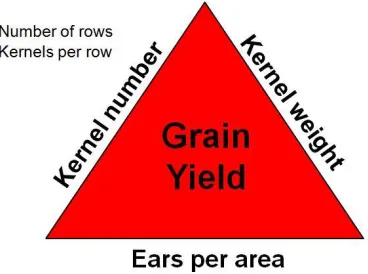
these factors contribute to the final grain yield components of corn: kernel number, kernel
[image:5.612.230.414.488.625.2]weight, and ears per area as demonstrated in Figure 1 (Lauer, 2006)
5
Each year prior to harvest, growers, consultants, and agronomist conduct general
yield estimates in corn fields. Often these yield estimates are truly estimates. If the same
formula is used for all hybrids, and the kernel size is not taken into consideration, the
estimates do not compare very well to actual yields. Bruce Due, Mycogen Agronomist has
done a kernel size study for the last several years (pers. comm., 2015). He evaluated
different hybrids and recorded the number of kernels from each hybrid in a bushel of grain.
Harvest populations (final plant count with viable ear at harvest) were collected at each site
by hybrid. His results illustrated there can be large differences in kernel size across hybrids.
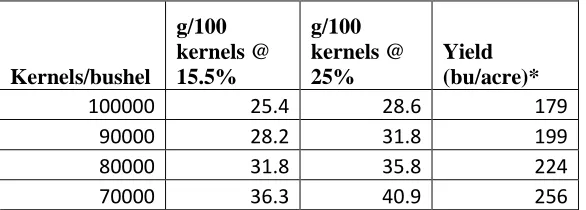
Penn State Extension suggests using similar kernel estimates when trying to estimate yield as
shown in Table 1 below. Kernel count per bushel ranged from 70,000 kernels in the high
yield environment to 100,000 kernels/bushel in low yield environment (Penn State
[image:6.612.100.393.476.581.2]Extension, 2014).
Table 1. Impact of kernel size on grain yield in corn (Adopted from Penn State – Corn yields and kernel size)
Kernels/bushel g/100 kernels @ 15.5% g/100 kernels @ 25% Yield (bu/acre)*
100000 25.4 28.6 179
90000 28.2 31.8 199
80000 31.8 35.8 224
70000 36.3 40.9 256
*assuming 16 kernel rows, 35 kernels/row and an ear count of 32,000/acre
Higher plant populations may create additional stresses and limitations, such as
reduced light interception or nutrient supply, which could negatively affect grain fill.
6
large kernel number (3500 to 5500 kernels m-2), depended more on reserve mobilization than
large-kernel hybrids (KW >300mg) with reduced kernel number (2800 to 4000 kernels m-2)”.
These results show the interactions between source versus sink limitations within plants and
their effect on grain fill and kernel abortion. Similarly, yield reductions under high plant
populations may be the result of limitations in the endosperm’s capacity for growth, either by
number, size, or activity of the endosperm cells (Sangoi, 2001). A study done by Jeremy
Milander at University of Nebraska-Lincoln showed kernel weights decreased linearly from
30.1 grams to 27.0 grams per 100 kernels as populations increased from 65,000 plant/ha to
105,000 plant/ha (Milander, 2015).
My personal experience from field observations is that hybrids with more kernel rows
are more responsive to increases or decreases in seeding rate or number of kernels planted
per acre. These hybrids seeded at lower population rates have shown a positive yield
response in commercial production fields, which seems counter intuitive. Since individual
kernel size on an ear with more kernel rows should be smaller, an increase in the planting
population should result in more kernels. This observation lead me to the hypothesis that
these kinds of hybrids have more “kernel flex” or variation of kernel size in response to low
plant population density. This variation in seed size could impact the plants’ ability to
completely fill all kernels (kernel number) during grain fill, which is dependent on
environmental conditions.
This experiment compares four corn hybrids, at three plant populations, across three
locations to determine how these variables can impact final kernel size weight. The
7
size based on hybrid selection for number of kernel rows; and to evaluate if final kernel size
variation could be predicted or correlated to these variables.
MATERIALS AND METHODS Locations
The experimental plan included three Dow AgroScience research locations across
southern Minnesota and Northern Iowa during the 2016 growing season. Two locations were
in Minnesota near Blue Earth and Olivia, and one location near George, Iowa. Two
additional locations were planted but were not used in the analysis. Data from these locations
were lost to weed competition and the other to planting error. The soil type at Blue Earth,
MN was 197 Kingston Silty Clay Loam (Fine-silty, mixed, superactive mesic Aquic
Hapludolls); at Olivia, MN was 927 Harps-Glencoe-Seaforth Complex (Harps Clay Loam:
Fine-loamy, mixed, superactive, mesic Typic Calciaquolls; Glencoe Clay Loam: Fine-loamy,
mixed, superactive, mesic Cumulic Endoaquolls; Seaforth Loam: Fine-loamy, mixed,
superactive, mesic Aquic Calciudolls), and at George, IA was 310B Galva Silty Clay Loam
(Fine-silty, mixed, superactive, mesic Typic Hapludolls) (USDA Soil Web Survey, 2018).
Experimental Design
Four hybrids were planted at each location using three plant population densities. Each
hybrid was randomized within each population and location. These four hybrids included
two hybrids, A and B, that produce 16 kernel rows or more and two hybrids, C and D, that
8
(Almaco 360 Seed Pro with Sky Trip, Nevada, IA) at three plant populations in increments of
5,000 plant/acre (12,355 plant/hectare) as shown in Table 2. The “medium” plant
[image:9.612.93.551.251.408.2]populations were set according to the typical planting recommendations for the area.
Table 2 – List of research site locations and plant populations at each location.
Plant Populations
Locations: City State Low Medium High
Location 1 Olivia MN 30,000 35,000 40,000
Location 2 Blue Earth MN 29,000 34,000 39,000
Location 3 George IA 29,000 34,000 39,000
Evaluation Process
Final plant populations for each hybrid and location were recorded when ear samples were
harvested. A measurement of 2.4 m (10 ft) was made from the alley to determine the first ear
in each row to harvest. The next ten consecutive ears, from each hybrid and population, were
harvested by hand. Each ear was placed in an individually labeled mesh bag and then each of
these bags were placed into a larger mesh bag labeled for each hybrid by population per
location. After all ear samples collected from each research location, ears were dried to
approximately 15.0% moisture utilizing a laboratory/research seed dryer.
Each ear sample was evaluated individually. The number of kernel rows and the number
9
sheller (Agriculex SCS-2; Guelph, Ontario Canada) and kernel samples from each ear were
saved. The shelled kernel samples were screened, weighed, and the total kernel weight per
ear was recorded. The kernel samples were counted using an automated seed counter
(Agriculex ESC-2; Guelph, Ontario Canada) to acquire kernel counts used in analysis. The
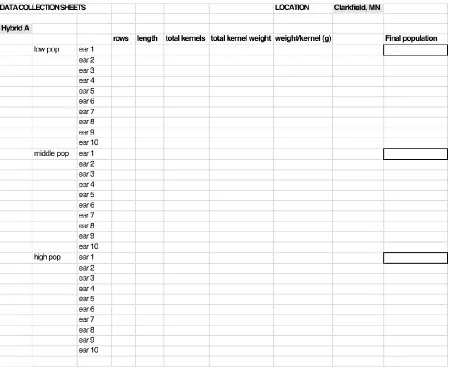
total kernel weight per ear was divided by the total number of kernels per ear to obtain the
[image:10.612.92.542.276.646.2]individual kernel weight. An example of a “Data Collection” sheet is included in Figure 2.
10
Statistical Analysis
Regression equations between the different ear flex parameters and yield were calculated.
The experimental design is a split-block design with locations as blocks. Data for kernel
rows, kernels per row, kernels per ear, and grams per kernel were collected from this
experiment were also analyzed using ANOVA. Hybrid and population were considered
fixed effects, while location was considered random. Error terms (all interactions of main
effects with location) were computed using the random statement in SAS and these error
terms were used to test fixed effects according to expected mean squares generated. These
tests were run on each of the dependent variables; rows per ear, kernels per row, kernels per
ear, grams per kernel, and yield. The means for the main effects of hybrid and population
were LSD at p≤0.05. The raw data can be found in Appendix A.
RESULTS
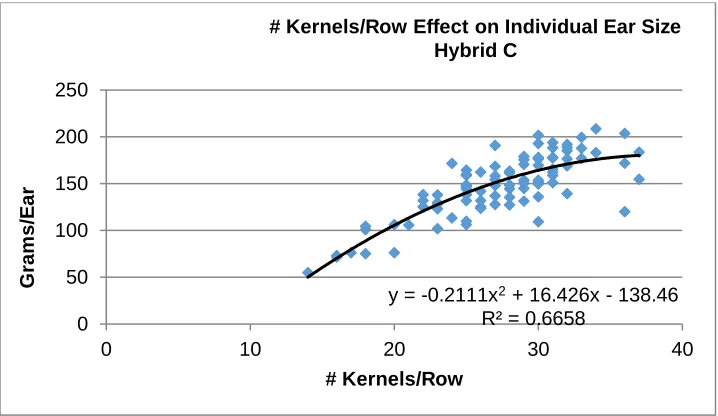
Regression equations between the various parameters of ear flex were calculated to
understand their relationships to grain yield. The R2 value for most regression equations were
very low, with the exception of the number of kernels per row and ear size expressed as
grams of grain per ear. Figures 2 through 5 show the regression equations and corresponding
R2 values for each hybrid tested, respectively. As the number of kernels per row increased,
so did ear size (grams/ear). The R2 values for these equations ranged from 0.56 to 0.73,
indicating that number of kernels per row explained 56 to 73 percentage of the variation
11
Figure 2 – Regression equation between number of kernels/row and ear size expressed in
grams of grain per ear for Hybrid A.
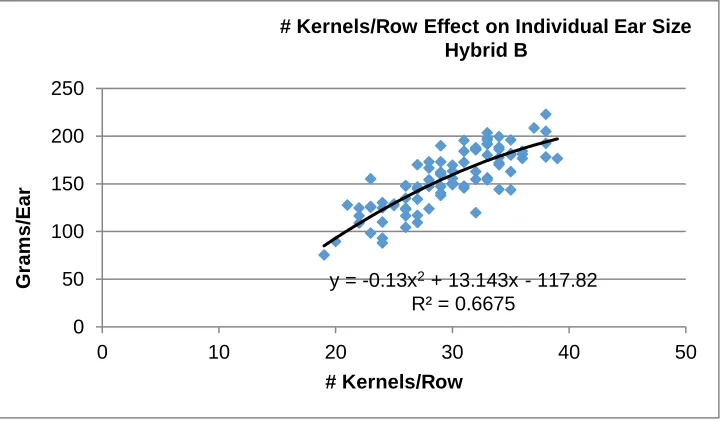
Figure 3 – Regression equation between number of kernels/row and ear size expressed in
grams of grain per ear for Hybrid B.
y = 0.0456x2+ 4.1494x - 1.5706
R² = 0.7262
0 50 100 150 200 250
0 10 20 30 40
G ra m s /E a r # Kernels/Row
# Kernels/Row Effect on Individual Ear Size Hybrid A
y = -0.13x2+ 13.143x - 117.82
R² = 0.6675 0 50 100 150 200 250
0 10 20 30 40 50
G ra m s /E a r # Kernels/Row
[image:12.612.92.453.497.708.2]12
Figure 4 – Regression equation between number of kernels/row and ear size expressed in
[image:13.612.90.449.126.334.2]grams of grain per ear for Hybrid C.
Figure 5 – Regression equation between number of kernels/row and ear size expressed in
grams of grain per ear for Hybrid D.
y = -0.2111x2+ 16.426x - 138.46
R² = 0.6658 0 50 100 150 200 250
0 10 20 30 40
G ra m s /E a r # Kernels/Row
# Kernels/Row Effect on Individual Ear Size Hybrid C
y = 0.0838x2- 0.9767x + 85.423
R² = 0.5751
0 50 100 150 200 250
0 10 20 30 40 50
G ra m s /E a r # Kernels/Row
13
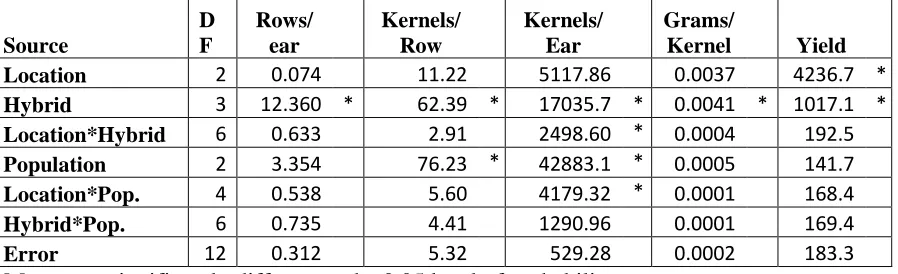
The Analysis of Variance for all ear parameters measured in this experiment are summarized
in Table 3. The results indicated there were no significant (p≤0.05) hybrid by plant
population density interactions for number of rows per ear, number of kernels per row,
number of kernels per ear, grams per kernel and yield. The interactions between location and
hybrid, and location and plant population density were not significant (p≤0.05) for most
[image:14.612.94.543.321.458.2]parameters measured, with the exception of number of kernels per ear.
Table 3. Mean Square values from the analysis of variance for location, hybrid and plant population density effects and their interactions.
Source D F Rows/ ear Kernels/ Row Kernels/ Ear Grams/
Kernel Yield
Location 2 0.074 11.22 5117.86 0.0037 4236.7 *
Hybrid 3 12.360 * 62.39 * 17035.7 * 0.0041 * 1017.1 *
Location*Hybrid 6 0.633 2.91 2498.60 * 0.0004 192.5
Population 2 3.354 76.23 * 42883.1 * 0.0005 141.7
Location*Pop. 4 0.538 5.60 4179.32 * 0.0001 168.4
Hybrid*Pop. 6 0.735 4.41 1290.96 0.0001 169.4
Error 12 0.312 5.32 529.28 0.0002 183.3
*Means are significantly different at the 0.05 level of probability
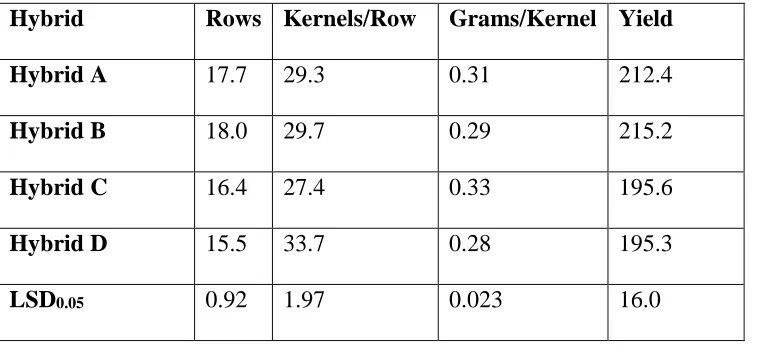
The main effect means for hybrid and population interactions were then evaluated using
the results of the t-Test and corresponding LSD values. These results are summarized in
Tables 4 and 5 respectively.
14
Table 4. Mean values for number of rows per ear (Rows), number of kernels per row
(Kernel/Row), weight of a kernel in grams (Grams/Kernel), and yield in bushels per acre
(Yield) for four hybrids overall locations and plant populations. Least significant difference
(LSD) values are calculated at the 0.05 level of probability.
Hybrid Rows Kernels/Row Grams/Kernel Yield
Hybrid A 17.7 29.3 0.31 212.4
Hybrid B 18.0 29.7 0.29 215.2
Hybrid C 16.4 27.4 0.33 195.6
Hybrid D 15.5 33.7 0.28 195.3
LSD0.05 0.92 1.97 0.023 16.0
Table 5. Mean values for number of rows per ear (Rows), number of kernels per row
(Kernel/Row), number of kernels per ear (Kernels/Ear), weight of a kernel in grams
(Grams/Kernel), and yield in bushels per acre. (Yield) for three plant population densities
overall locations and hybrids. Least significant difference (LSD) values are calculated at the
0.05 level of probability.
Population Rows Kernels/Row Grams/Kernel Yield
Low 17.4 32.4 0.31 208.5
Medium 17.0 30.3 0.30 203.4
High 16.3 27.4 0.30 201.9
[image:15.612.90.468.516.661.2]15
In the evaluation of the hybrid effect there were several noteworthy findings. The number
of rows per ear in Hybrids A and B were significantly greater (P<0.05) than Hybrids C and
D. These same hybrids (A and B) also yielded significantly greater (P<0.05) in this
experiment.
The evaluation of the population effect did indicate an impact on the various parameters
of ear development. The number of rows per ear was significantly fewer in high population
density than in low population and significantly fewer (p<0.05) than both the low and
medium population for kernels per row and total number of kernels per ear. These changes
in population density, however, did not lead to a significant difference (p≤0.05) in yield.
The hybrid did not indicate any significant difference (p≤0.05) in grams per kernel that
corresponded to the hybrid groups of A and B versus C and D, either both higher or both
lower, as initially suspected at the onset of this experiment. The population effect on grams
per kernel showed no significant difference (p≤0.05) either.
DISCUSSION AND CONCLUSION
The driving question behind this research was how hybrid selection, based on genetic
tendency for number of kernel rows on an ear, might vary across population densities and
locations. The purpose of this experiment was to identify interactions among ear-types and
changing plant populations. It was hypothesized that hybrids with more kernel rows per ear
would show more “kernel flex” or variation per individual kernel size than hybrids with
fewer kernel rows in response to an imposed stress factor, specifically plant population
16
The results from this study did not support the hypothesis; however, valuable information
was obtained from the experiment. First, the selection process for the hybrids, based on rows
per ear influenced by genetic tendencies, could produce significantly different hybrid groups
and variation among the products selected for this experiment. This selection process was
important because it is the first step for determining hybrid choices for different locations.
Secondly, the remaining ear components from each hybrid were evaluated; kernels per row,
kernels per ear, and finally weight per kernel. If hybrids with more kernel rows per ear are
influenced by plant population management decisions, then hybrids A and B should have
been significantly different than hybrids C and D, especially in regards to grams per kernel.
However, results from this experiment did not support this assumption. The four hybrids did
not respond consistently based simply on their rows per ear. For example, Hybrid B and D
were the two hybrids with the largest mean difference in rows per ear. Hybrid B had 18.0
rows per ear and hybrid D had 15.5 rows per ear as shown in Table 4. Even though these two
hybrids have different numbers of kernels per row and yield, they had the same grams per
kernel or grain weight. This relates back to the Yield Components of Corn triangle that was
discussed in the introduction (Lauer, 2006). Yield is driven by the number of ears per area
(plant population), by the number of kernels per ear or the combination of kernel rows by
kernels per row, and by the weight of the grain. Each corn plant reaches its maximum yield
potential through a different combination of these yield components, which falls somewhere
different within the yield triangle. This variability was evident in this research and was
shown by the variability of the ear components from hybrid to hybrid.
Stresses throughout the growing season can impact corn developmental processes, which
17
Milander (2015), early season stress has the potential to reduce the number of ears,
late-season stress has the potential to reduce kernel weight, and midlate-season stress has the potential
to reduce the number of kernels. Midseason stress can impact the kernel set on the ear, first
the number of rows around and then the length potential of the ear. Late season stress can
impact how well the individual kernels are filled. The locations used for this experiment did
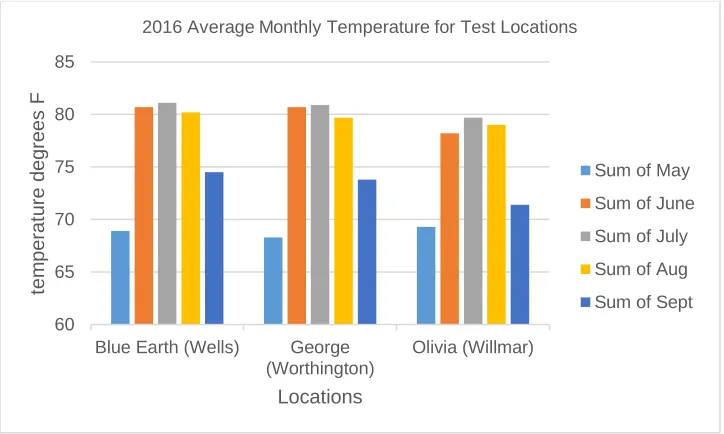
not experience prolonged stressful weather conditions throughout the 2016 growing season.
The average monthly temperatures for each test location are shown in Figure 6. The average
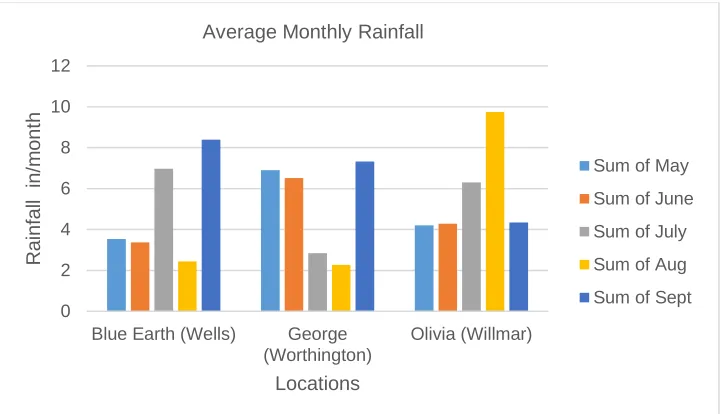
monthly rainfall amounts by location are shown in Figure 7. Monthly temperatures at all
locations were very similar, while rainfall was evenly distributed throughout the growing
[image:18.612.90.452.458.675.2]season.
Figure 6 – Average monthly temperatures at Blue Earth and Olivia, MN and George, IA in
2016 (created from MN DNR annual data, 2018)
60 65 70 75 80 85
Blue Earth (Wells) George (Worthington) Olivia (Willmar) tem perat u re degr ees F Locations
2016 Average Monthly Temperature for Test Locations
Sum of May
Sum of June
Sum of July
Sum of Aug
18
Figure 7 – Average monthly rainfall at Blue Earth and Olivia, MN and George, IA in 2016
(created from MN DNR annual data, 2018)
The favorable growing conditions across all locations produced very similar growing
environments that had little or no effect on the grain yield parameters measured. Future
experiments should consider evaluating similar variables under various circumstances based
on environmental conditions and time. The first option would be to use a single testing
location, with better control over environmental stress (e.g. irrigated plots). The experiment
should also include multiple replications at a single site and/or with hybrids exhibiting wider
ranges in kernel rows. If under these controlled environments, a consistent correlation
between the number of rows and the other ear components is established, then using multiple
locations may have merit. The second option would be to conduct a longitudinal study over
several years in order to collect data on natural changing weather patterns and analyze trends
and data over time.
The number of kernel rows is variable in corn production and can be impacted by both
genetics (as demonstrated by this experiment) and by environmental conditions and their
0 2 4 6 8 10 12
Blue Earth (Wells) George (Worthington) Olivia (Willmar) Ra inf al l i n/m ont h Locations Average Monthly Rainfall
Sum of May
Sum of June
Sum of July
Sum of Aug
19
interactions. A study conducted by Bokanski et al. (2009) established inbred tendencies for
phenotypic characteristics correlated with yield. They observed the best correlation with
hybrid yield from selecting inbreds with longer ears and taller plant height on one side of the
hybrid cross, and inbreds with greater number of kernel rows and heavier kernel weight on
the other side.
The corn seed production industry currently relies more on marker assisted breeding efforts
to help identify, prior to planting new hybrids in the field, inbreds and hybrids that have more
desirable phenotypic characteristics. The advancements in this particular field of study have
been tremendous over the last couple decades. An early study by Stuber et al. (Stuber et al.,
1986) recognized that additive gene action for ear components (ear number, kernel rows, and
ear grain weight) could be useful in identifying quantitative trait loci. Being able to identify
how these ear component affect consistent yield outcomes is valuable information for
breeders and producers.
A more recent and ongoing study by Tianru Lan and colleagues “QTL mapping and genetic
analysis for corn kernel size and weight in multi-environments” (Lan et al., 2018), evaluated
ear components of kernel length, width, thickness and weight over seven environments.
They identified variation in these ear components due to population density changes. Using
genetic mapping to identify novel plant characteristics and understand how these
characteristics may change in various environmental situations, could be one of the next big
advancements in modern agricultural.
The corn plant is an amazing production factory with many ways to compensate for
changes in the growing environment in order to complete its primary task of developing and
20
and seasonal influences on individual ear development is very interesting. Even though this
experiment did not support my original hypothesis, this project created a better understanding
and appreciation of corn production. There is limited information on the topic of individual
parameters of ear development but this experiment does contribute to the information within
21
REFERENCES
Anderson, R. L. 2000.Cultural Systems to Aid Weed Management in Semiarid Corn (Zea
mays). Weed Technology 14 (3): 630-634.
Bokanski, J, Sreckov, Z, Nastasic, A. 2009. Genetic and Phenotypic Relationship Between
Grain Yield and Components of Grain Yield of Maize. University of Novi Sad. Vol. 41,
No.2, 145-154.
Borras, L., Slafer, G., Otegui, M. 2004. Seed Dry Weight Response to Source and Sink
Manipulations in Wheat, Maize and Soybean; a Quantitative Reappraisals. Fields Crop
Research, 86: 131-146.
Iowa State University – Department of Agronomy, Elmore, R, Abendroth, L. 2006. Number
of rows and kernels set early in season. Literature IC-496(13) pages 151-152. [Online]
http://www.agronext.iastate.edu/corn/production/management/growth/
Lan, T., He, K., Chang, L., Cui, T., Zhao, Z., Xue, J., Liu, J. 2018. QTL mapping and genetic
analysis for maize kernel size and weight in multi-environments. Euphytica, vol. 214, issue 7,
article no. UNSP 119.
Lauer, J. 2006. Corn Development. University of Wisconsin. [Online]
22
Maddonni, G.A., Otegui, M.E, Bonhomme, R. 1998. Grain yield components in maize: II.
Postsilking growth and kernel weight. [Online]
http://www.sciencedirect.com/science/article/pii/S0378429097000944
Milander, J.J. 2015. Maize yield and components as influenced by environmental agronomic
management. M.S. thesis. Univ. Nebraska, Lincoln, NE.
Minnesota Department of Natural Resources. 2018. Climate data from national weather
service reporting stations. https://www.dnr.state.mn.us/climate/historical/acis_stn_meta.html
Penn State Extension – Crops and Soils. 2014. Corn yields and kernel size. [Online].
http://extension.psu.edu/plants/crops/news/2014/09/corn-yields-and-kernel-size
Purdue University - Agronomy Department, Nielsen, R. 2002. Corn growth and
development what goes on from planting to harvest? Literature document AGRY-97-07
(v1.1).doc last revised 8/18/02.
Sangoi, L. 2001. Understanding plant density effects on maize growth and development: An
important issue to maize grain yield. [Online]
23
Stuber, C., Edward, M., Wendel, J.. 1986. Molecular Marker-Facilitated Investigations of
Quantitative Trait Loci in Maize. II. Factors Influencing Yield and its Component Traits.
Vol. 27 No. 4, p. 639-648.
24
APPENDIX A