PLEASE SCROLL DOWN FOR ARTICLE
This article was downloaded by: [Ingenta Content Distribution Psy Press Titles] On: 29 June 2009Access details: Access Details: [subscription number 911796918] Publisher Taylor & Francis
Informa Ltd Registered in England and Wales Registered Number: 1072954 Registered office: Mortimer House, 37-41 Mortimer Street, London W1T 3JH, UK
Nanoscale and Microscale Thermophysical Engineering
Publication details, including instructions for authors and subscription information: http://www.informaworld.com/smpp/title~content=t713774103CONVECTIVE BOILING IN PARALLEL MICROCHANNELS
G. Hetsroni a; D. Klein a; A. Mosyak a; Z. Segal a; E. Pogrebnyak a
a Department of Mechanical Engineering, Technion-Israel Institute of Technology, Technion City, Haifa, Israel.
Online Publication Date: 01 October 2004
To cite this Article Hetsroni, G., Klein, D., Mosyak, A., Segal, Z. and Pogrebnyak, E.(2004)'CONVECTIVE BOILING IN PARALLEL MICROCHANNELS',Nanoscale and Microscale Thermophysical Engineering,8:4,403 — 421
To link to this Article: DOI: 10.1080/10893950490516965
URL: http://dx.doi.org/10.1080/10893950490516965
Full terms and conditions of use: http://www.informaworld.com/terms-and-conditions-of-access.pdf This article may be used for research, teaching and private study purposes. Any substantial or systematic reproduction, re-distribution, re-selling, loan or sub-licensing, systematic supply or distribution in any form to anyone is expressly forbidden.
Microscale Thermophysical Engineering, 8:403–421, 2004 Copyright © Taylor & Francis Inc.
ISSN: 1089-3954 print/1091-7640 online DOI: 10.1080/10893950490516965
CONVECTIVE BOILING IN PARALLEL MICROCHANNELS
G. Hetsroni, D. Klein, A. Mosyak, Z. Segal, and E. Pogrebnyak
Department of Mechanical Engineering, Technion–Israel Institute of Technology, Technion City, Haifa, IsraelExperiments were performed with clear water and with surfactant flowing in parallel triangular microchannels. The study is based on systematic measurements of temperature and flow pattern by infrared radiometry and high-speed digital video imaging. Different flow patterns were observed simultaneously in various microchannels at a fixed value of water or surfactant flow rates. Depending on flow and heat flux, pressure and temperature instabilities in the heated microchannels were studied. This work develops a practical modeling approach for two-phase microchannel heat sinks and also considers effect of surfactant on convective boiling in microchannels.
Keywords two-phase flow, heat transfer, microchannels, dryout, surfactant
INTRODUCTION
Various aspects of two-phase flow and change-of-phase heat transfer in microchan-nels have been investigated recently including phase flow patterns [1–4] and two-phase heat transfer [5–9].
Previous studies on heat transfer to a two-phase capillary flow in a heated mi-crochannel provide estimates of the effects of capillary, inertia, friction, and gravity forces on the velocity distribution and temperature field along a single capillary [10]. However, to provide effective cooling, a set of parallel microchannels should be used rather than a single channel. Two-phase flow in parallel pipes, for which the feed is from a common manifold, displays interesting phenomena, as two phases may split un-evenly when entering the parallel piping. Flow boiling in parallel microchannels raises fundamental questions: how does the small passage dimension affect the bubble dynam-ics and the two-phase flow? How is the temperature distribution on the heated surface affected at constant heat flux? Parallel triangular channels with the common inlet and outlet collectors were used. The experimental study is based on systematic observations and measurements by infrared radiometry and high-speed video images.
Received 25 April 2003; accepted 23 April 2004.
This research was supported by the Fund for Promotion of Research at the Technion. A. Mosayk is supported by a joint grant from the Center for Absorption in Science of the Ministry of Immigrant Absorption and the Committee for Planning and Budgeting of the Council for Higher Education under the framework of the KAMEA PROGRAM, and E. Pogrebnyak was supported by the Center for Absorption in Science, Ministry of Immigrant Absorption State of Israel.
Address correspondence to G. Hetsroni, Department of Mechanical Engineering, Technion–Israel Insti-tute of Technology, Technion City, Haifa 32000, Israel. E-mail: [email protected]
403
404 G. HETSRONI ET AL.
NOMENCLATURE
Ac overall cross-section area of microchannels,m2 Cp specific heat, J/kgK
D bubble size, m
dh hydraulic diameter, m f =Dp
Dn ratio of bubble size in
the streamwise direction to that in the spanwise direction, dimensionless F area of the heater, m2
I current, A
˙
m mass velocity kg/m2s
q heat flux, W/m2
q∗= mC˙ qpT Tmax
Tmean dimensionless heat flux
Re= Udvh Reynolds number, dimensionless
T temperature, K
U mean flow velocity, m/s
V voltage, V
Q volumetric flow rate,
m3/s
x mass vapor quality,
dimensionless
Greek symbols
P pressure drop, kPa T=Ts−T0 temperature difference, K
ν kinematic viscosity, m2/s ρ fluid density, kg/m3
τ time, s
ϕ ratio of the heat transfer to the working fluid to the total heat generation, dimensionless
Subscripts
b bubble
h hydraulic
LS liquid, superficial
max maximum
mean averaged over the surface n spanwise direction
o water
p streamwise direction
S saturation
w wall
EXPERIMENTS
Experimental Apparatus
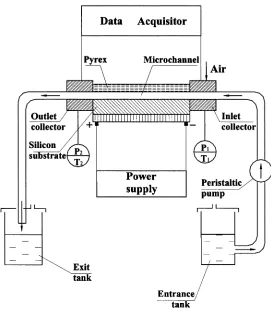
The experimental test facility and flow loop for liquid flowing through microchan-nels is shown in Figure 1. It consists of a peristaltic pump, pipes, test module, and entrance and exit tanks. Working liquid (water at constant temperature) was pumped from the entrance tank through the inlet plenum, through the microchannels in the test module, and through outlet plenum to the exit tank. The flow rate of the working fluid was controlled by adjusting the frequency of the peristaltic pump and was measured by a weighing method.
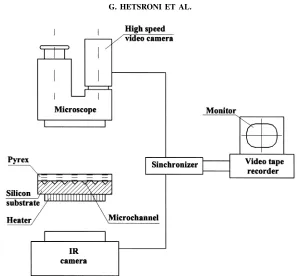
The flow visualization technique and the visualization of the thermal field at the heated wall is shown in Figure 2. The motion of vapor–liquid flow in the microchannels was studied using a microscope and high-speed video camera with recording rate up to 10,000 fps. The playback speed can be varied from a single frame to 250 fps. The IR radiometer has a sensitivity of 0.1 K and a typical resolution of 256 pixels per line. With the radiometer one can obtain a quantitative thermal profile in the line mode, the average temperature in the area mode, and the temperature of a given point in the point mode. The frequency response of the radiometer is 25 frames per second. In the present study, the frequency of the bubble growth in the microchannel is higher than that; hence, we confined ourselves to measurements of temperature field, on the heated bottom of the test module, averaged over a time interval of 0.04 s.
Figure 1.Experimental apparatus.
The temperature of the working fluid was measured at the entrance and exit of the test module by 0.3 mm type-T thermocouples with an accuracy of 0.1 K. Pressures were measured, at the inlet and outlet of the test module, by silicon pressure sensors, with sensitivity 3.3 mV/kPa, response time 1.0 ms, and accuracy of 1.5%. The flow rates of the working water were measured with an accuracy of 1%. The superficial water and velocity was calculated with an accuracy of 2%. The vapor quality is calculated with an accuracy of 5–10% depending on the flow conditions.
Test Sections
We have designed, manufactured and tested a number of prototypes that may be used in the thermal control of electronic devices. A typical test module is shown in Figure 3. The test modules were fabricated of a square shaped silicon substrate, 15 × 15 mm, 530µm thick, and a Pyrex cover, 500µm thick, which served as both an insulator and a transparent cover through which flow patterns and boiling phenomena could be observed. In the silicon substrate, parallel microchannels were etched. The cross section of each channel is an isosceles triangle with a base of 200–310 µm. The angles at the base are 55◦. An electrical heater of 10 × 10 mm, made of a thin film resistor, was deposited on the surface of the silicon and served to simulate the heat source. The heater
406 G. HETSRONI ET AL.
Figure 2. Visualization technique.
Figure 3. Test section.
was connected to a DC power supply and heat generated in the heater was transferred to the liquid flow from the two sides of the triangular channels.
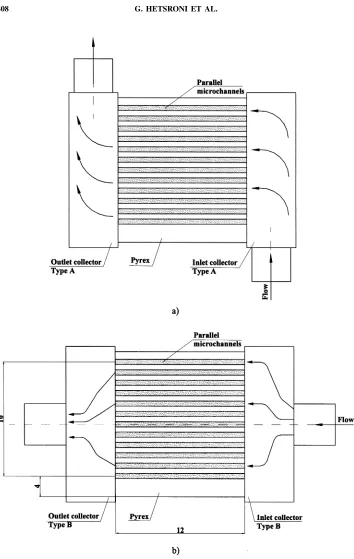
Although the channels were fabricated in such a way that the cross section of all channels would be uniform, the flow rate through each channel may not be equal. The distribution of flow through the channels depends on the way of connection of the test section to the inlet and outlet collectors. Two types of connection were studied: type A
[image:5.612.164.459.411.570.2]shown in Figure 4a, and type B shown in Figure 4b. Type A provides the flow direction to the inlet plenum and from the outlet collector that is perpendicular to the flow direction in the microchannels. Type B provides the same flow direction to the inlet and from the outlet collector as in the microchannels. The geometry of the tested modules is given in Table 1.
Data Reduction
The parameters used in the data reduction and analysis are summarized below:
• Heat flux, q: In the determination of the heat transferred from the heater to the working fluid, the heat losses due to conduction, convection and radiation were taken into account. The transferred heat was defined asq =ϕIVF, whereI and
V are input current and voltage,F is the heated area of the heater, andϕ is the ratio of the heat transferred to the working fluid to the total heat generation. For each set of steady-state experimental conditions, the energy balance (based on the measurements of the inlet and outlet temperatures and calorimetric method) was performed, and the valueϕ was calculated. The current data indicated that geometric parameters such as hydraulic diameter and design and material of the inlet and outlet collectors have a significant influence on the heat losses.
• Reynolds number: Re= Udνh wherev is the kinematic viscosity,dh is the hy-draulic diameter, andUis the mean flow velocity of the single phase liquid. The kinematic viscosity was calculated using the temperature of the fluid at the inlet collector [11]. The experimental conditions are given in Table 2.
• Mass velocity of the single-phase flow,m˙: the mass velocity was calculated as
˙
m= QρAc, whereQis the volumetric flow rate,ρ is the fluid density, and Ac is the overall cross-section area of the microchannels.
• Mass vapor quality at the outlet plenum,x: the mass vapor quality was calculated from the equation of change in the enthalpy of a liquid–vapor system during evaporation in the microchannels.
RESULTS
Incipience of Individual Bubble
Predicting the incipient boiling is an integral part of a microchannel heat sink design methodology. The ability to predict this condition is of paramount importance both as an upper design limit for heat sinks that are intended for single-phase cooling only, and as a lower limit for two-phase heat sinks intended for maximum heat dissipation. The present investigation focuses on a study of incipient boiling and bubble behavior at lower values of inlet liquid velocity. The experiments have shown the explosive bubble behavior. The location (along the test section) of the appearance of the first bubble at a given flow rate depends on local surface temperature variation. Since the heated length of the test section is short (10 mm), at high values of the difference between maximum temperature on the heated wall,Twmax, and saturation temperature,TS, significant interaction takes place between the steam generated and the feed water. It is very difficult to study the appearance of the first bubble at high values of (Twmax−TS). We investigated this phenomenon
408 G. HETSRONI ET AL.
Figure 4.Manifolds: a) collector type A, b) collector type B.
Table 1. Geometry of test modules
Overall number Channel hydraulic
Type of test of channels diameter, mm Type of Material of
module (n) (dh) plenum the plenum
1 21 0.129 A Stainless steel
2 26 0.103 B Plastic PEEC
[image:8.612.187.421.248.330.2]3 17 0.161 A Stainless steel
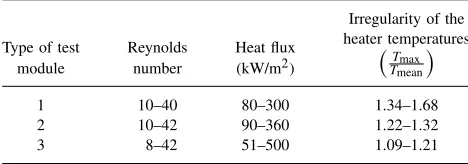
Table 2. Experimental conditions
Irregularity of the heater temperatures
Tmax
Tmean Type of test Reynolds Heat flux
module number (kW/m2)
1 10–40 80–300 1.34–1.68
2 10–42 90–360 1.22–1.32
3 8–42 51–500 1.09–1.21
under conditions of(Twmax−TS)=6 K, q =8·104mW2, and superficial liquid velocity
ULS =0.046 m/s. In this case the beginning of bubble growth was observed close to the exit manifold.
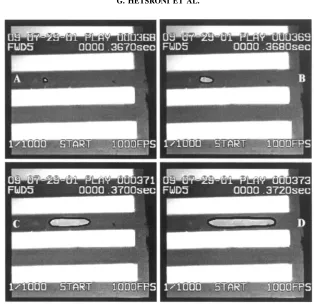
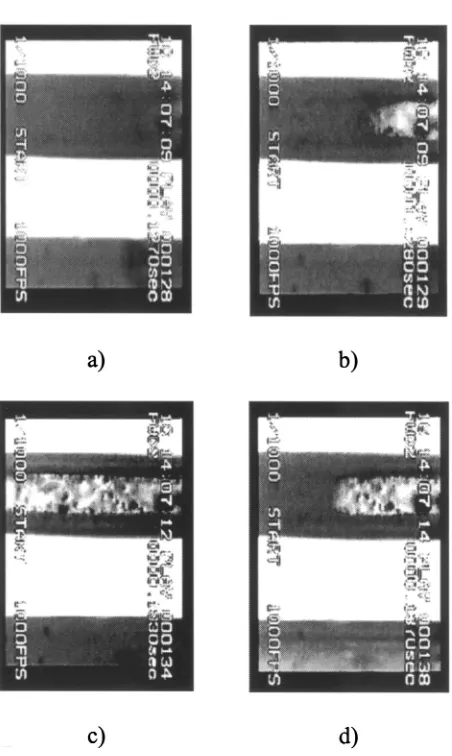
The typical bubble behavior is shown in Figure 5 (the second channel from the top) Figures 5a–5b illustrate the bubble shape at different instants of time during growth and motion. It is the top view, observed through the transparent cover. The field of view is 2.4 mm in the streamwise direction and 2.2 mm in the spanwise direction, the flow moves from left to right. In these images four microchannels are shown marked by gray color or by gray color with the light regions. One can see that the vapor is generated in one microchannel only. Figure 5a shows the incipience of the bubble. The bubble is approximately spherical and occupies a small part of the triangular microchannel. During 0.001 s it grows and occupies about 0.3 of the cross section, Figure 5b. At that point the bubble grows preferential in the axial direction, Figure 5c. In Figure 5c the bubble occupies about 0.7 of cross section. Then the bubble moves into the exit manifold, Figure 5d.
Bubble Growth
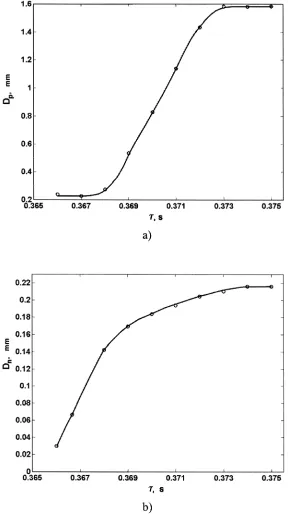
When incipient boiling superheat is achieved, the vapor bubble nucleates and rapidly grows. The bubble is initially a small sphere and then the axisymmetric growth in a narrow channel takes place. Temporal variation of bubble size is shown in Figure 6. Figures 6a and 6b show variation of bubble size in the streamwise direction,Dp, and in the spanwise direction,Dn, respectively. From these figures one can conclude that at timeτ =0.375 s the maximum length of the bubble in the streamwise direction,Dp, is about 8 times larger than that in the spanwise direction,Dn.
The observed ratiof =DDp
n is quite different from that reported for subcooled flow
boiling of water in tubes of 17–22 mm inner diameter. Bibeau and Salcudean [12] and
410 G. HETSRONI ET AL.
Figure 5.Bubble growth.ULS=0.046 m/s,q=80 kW/m2; Type B plenum.
Prodanovic et al. [13] reported that this ratio was typically around 0.8 for experiments at 1.05–3 bar. The situation considered in this article is, however, different as the bubbles undergo a significant volume change and the flow is unstable. Ory et al. [10] studied numerically growth and collapse of a bubble in a narrow tube filled with a viscous fluid. The situation considered in that study is also quite different from the present one as, in that case, heat was added to the system impulsively, rather than continuously as we do here.
Jiang et al. [14] conducted visualization studies on boiling of water in triangular microchannels with minimal width of 50 and 100µm. At low heat fluxes, individual bub-bles were observed growing and departing inside the microchannels. Increasing the heat flux triggered an abrupt change in the flow pattern to an unstable slug flow. The interest-ing feature of this study is that the bubbly flow regime, common to macro flow boilinterest-ing systems, was never observed. Kennedy et al. [15] studied incipient boiling and onset of flow instability for subcooled water flow in uniformly heated microtubes with diameters of 1.17 and 1.45 mm. For smaller channels, significant deviation was found between experimental results and prior incipient boiling correlations. The observation made by these investigators shows that flow patterns, correlations, and models available for macro two-phase systems are unsuitable to microchannel flow. Recently, an experimental in-vestigation of the flow boiling of a liquid flowing through triangular microchannels by
Figure 6. Temporal variation of vapor bubble size: a) streamwise direction,Dpand b) spanwise direction,Dn.
412 G. HETSRONI ET AL.
Peng et al. [6] showed that the wall superheat for the onset of boiling is very low. Qu and Mudawar [16] performed experiments to measure the incipient boiling heat flux in a heat sink containing 21 rectangular (231µm wide and 713µm deep) microchannels. Boiling incipience was identified when the first bubbles were detected growing at, and departing from, the microchannel wall near the outlet. Tests were performed with in-let liquid velocities of 0.13–1.44 m/s. The incipient boiling heat flux and the incipient boiling superheat measured in the present study agree well with experimental data and model predictions reported by Qu and Mudawar [16]. One can conclude that the model developed by Qu and Mudawar [16] for rectangular channels may be adopted to predict the incipient boiling heat flux and the incipient boiling superheat for triangular channel as well.
Visual observation in the present study showed that the majority of the first bubbles were observed on the channel bottom wall, although a few bubbles did appear on the sidewalls. After nucleation, bubbles first grew to detachment size before departing into the liquid flow. The detached bubbles moved to the downstream plenum.
Bubble Velocity
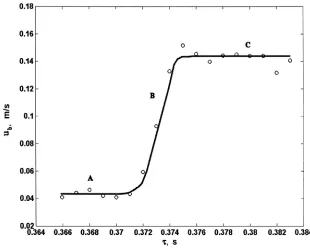
[image:11.612.152.462.411.661.2]Figure 7 shows the velocity of displacement of the bubble tail in the streamwise direction, Ub (m/s), versus bubble lifetime, τ, at fixed conditions as described above, i.e., q = 8·104mW2, ULS = 0.046 m/s. One may conclude that the velocity of bubble displacement varies, depending on the given range of lifetime. In region A the boiling process during the time of about 0.005 s from the appearance of the first bubble, ONB,
Figure 7.Velocity of bubble displacement.ULS=0.046 m/s,q=80 kW/m2.
the bubble velocity is equal to the superficial liquid velocity. It should be noted that the term ONB, commonly known as the onset of nucleate boiling, was “borrowed” from the terminology of subcooled flow boiling in larger tubes. Region B is characterized by a sharp increase in the bubble velocity. One may conclude that the bubble is accelerated in the streamwise flow direction. Figure 7 shows that in this region the bubble velocity increases about threefold, during a time interval about 0.003 s. After the time whenUb reaches maximum value it remains constant, as shown in Figure 7, region C.
Boiling in Parallel Microchannels: Visual Study
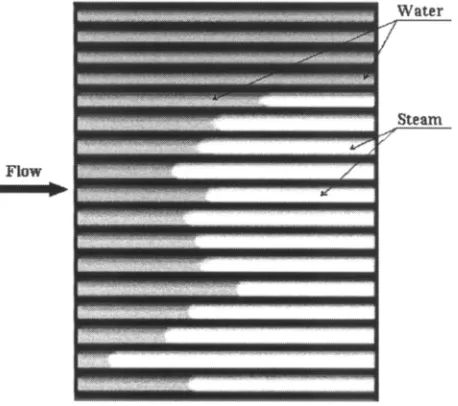
Figure 8 illustrates two-phase flow, driven by a pump in the microchannels of the test module. The vapor is generated only in part of the microchannels, and in different parts of the parallel microchannels. In the microchannels where vapor is generated two regions could be considered: one region, located close to the inlet collector, and the region located downstream from the inlet collector. Figure 9 shows in detail the unsteady flow in one of the parallel microchannels located close to the inlet plenum with heat flux
[image:12.612.193.422.457.660.2]q=220kWm2 andULS =0.14 m/s. The flow moves from the left to the right, the field of view is about 0.7 mm in the streamwise direction and 1 mm in the spanwise direction. In Figure 9, in this part single-phase water flow was mainly observed (see Fig. 9a). An interesting phenomenon frequently happened, when the applied heat flux or wall access temperature was increased, clusters of vapor appeared as a jet, penetrating the bulk of the water (see Fig. 9b). The vapor jet moved in the dowstream direction, and the space that it occupies increased. In this case an unstable annular flow mode was observed (see Fig. 9c). After some time the annular flow mode began to disappear (see Fig. 9d). As a result, blocking does not take place in the microchannels as expected. However, even when the boiling occurred at the central part of a microchannel, the vapor was also
Figure 8.Boiling in parallel microchannels; Type A plenum.
414 G. HETSRONI ET AL.
Figure 9.Flow pattern near the inlet collector.ULS=0.14 m/s,q=220 kW m2; Type A plenum.
accumulated in the inlet plenum. This result agrees with previous experimental studies. As is pointed out by Peng and Wang [5], the study of the flow boiling in triangular microchannels showed that vapor phase was present in the inlet collector.
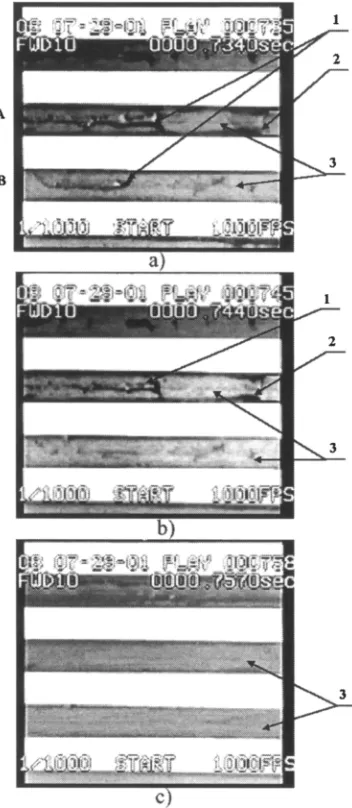
In the central part and close to the outlet plenum of the channels, depending on heat flux and liquid velocity, the regimes “vapor with clusters of droplets” and “vapor with a thin liquid layer” were observed. In Figure 10, two-phase steam–water flow in the central part of the parallel microchannels is displayed. It is the top view observed through transparent cover. The field of view is 2.4 mm in the streamwise direction and 2.0 mm in the spanwise direction; the flow moves from left to right. In these images three microchannels are shown, marked by gray color or by gray color with the light and dark regions. In the channels A and B, clusters of liquid droplets were observed (see Fig. 10a). One of the conclusions of the study is the extreme brevity of the time during which the presence of “vapor with clusters of droplets” regime was observed. The clusters may appear as on the corner of the bottom as on the side-walls (Figure 10a,
Figure 10.Boiling in the central part of microchannels.ULS =0.14 m/s,q=220 kW/m2; Type A plenum. 1) Clusters of liquid droplets on the bottom of the channel. 2) Clusters of the liquid droplets on the side-wall of the channel. 3) Steam.
channel A). After a time interval of 0.01s, the liquid drops were not observed on the bottom of channel B (see Fig. 10b). Figure 10c shows no presence of liquid droplets in both channels.
Pressure Drop Fluctuation
As reviewed and discussed by Peng and Wang [5], heat transfer to liquids in microchannels is quite different from that for conventional-sized channels. In particular, bubbles cause a significant volume change (relative to the channel). As a result, pressure
416 G. HETSRONI ET AL.
Figure 11.Pressure drop fluctuations.ULS=0.14 m/s,q=220 kW/m2; Type B plenum.
fluctuations were observed. The temporal behavior of the pressure drop is shown in Figure 11. The data were obtained atq =220kWm2, andULS =0.14 m/s. Such a behavior is a result of vapor formation in each microchannel.
Temperature Distribution on the Heated Wall
The experimental results of flow visualization suggest that unstable regions occur in two-phase flow in parallel channels. These are important conclusions, but they provide no clarification of how these regions affect temperature distribution on the side of a heater. Although the present study includes the hydraulic aspects of the problem, it relates primarily to the heater side problem. In physical objects including thermal and fluid flow systems, the conjugate problem in terms of heater, how the heater is represented, and boiling as a local-instantaneous problem, should be considered. The issue of temperature variations on the chip surface is a key characteristic of such a problem.
The temperature measurements performed simultaneously with flow visualization allowed us to conclude that convective boiling in part of the microchannels took place, when Tmean < TS (TS is the saturation temperature). WhenTmean > TS, boiling in all parallel microchannels was observed. It is clear that consideration of boiling curve and flow regimes in parallel microchannels should take into account such a wide variation of wall temperature.
Boiling Curve
Previous investigators [17, 18] have plotted, for convective boiling in single large size tube, the heat flux versus wall superheat (Tmean−TS), whereTmeanis the mean tem-perature on the heated surface. In the present study the results considered above show that the difference (Tmean−TS) might be negative. That is why we use the difference (Tmax−TS). In Figure 12 the dimensionless heat fluxq∗ is plotted versus the difference (Tmax−TS). Dimensionless heat flux is defined as q∗ = mC˙ pqT TTmeanmax, where q is the
Figure 12.Boiling curve for parallel microchannels. A) low heat flux region, B) high heat flux region.
heat flux,Cp is the specific heat,T =TS−T0,TS is the saturation temperature,T0 is the water temperature supplied to the inlet collector, andTmax andTmean are maximum and average temperature of the heated surface, respectively. The term (mC˙ pT) reflects the effect of subcooling. The experimental results of flow visualization suggest that for different number of microchannels connected to the inlet and outlet collectors (type A or type B) the same flow patterns occur in the two-phase region. These are important conclusions, but they provide no clarification of how the connection affects the temper-ature distribution on the heater side. Although the present study includes the hydraulic aspects of the problem, it relates primarily to the heater side problem. In physical objects including thermal and fluid flow systems, the conjugate problem in terms of heater, how the heater is represented, and boiling as a local-instantaneous problem should be consid-ered. The issue of temperature variations on the chip surface is a key characteristic of such problem. The term (Tmax/Tmean) reflects the nonuniform temperature distribution on the heated surface. In Figure 12 two regions of convective boiling may be distin-guished. In region A the value of (Tmax−TS) <20 K and boiling was observed in part of the parallel microchannels only. It may be referred to low heat flux region. Region B, shown in Figure 12, may be referred to as high heat flux region; in this case (Tmax−TS) exceeds 20 K.
Flow Regimes Map
The low heat flux region is characterized by the presence of liquid phase in all microchannels of the test module. High values of heat flux region are characterized by vapor generation in all microchannels and periodical rewetting and refilling of the micro-channels of the test module. In general, the term “dryout” indicates local contact of the gas phase with the surface. The term used in the present study of the flow visualization is defined with respect to temporal viewpoint of the process time. Observations of different
418 G. HETSRONI ET AL.
Figure 13. Flow regime map. A) low heat flux region, B) high heat flux region.
flow behavior at(Tmax−TS) <20 and (Twmax−TS) >20 lead to the conclusion that the heat transfer mechanism in the two regions would be different. Flow rates, heat flux, local surface temperature variations, and subcooling affect the value of(Tmax−TS). For transition from low heat flux regions characterized by continuous liquid phase to high flux regions characterized by dryout phenomenon we suggest:
Reynolds number Re = ULSνdh and dimensionless heat flux q∗, where dh is the hydraulic diameter, ULS is the superficial liquid velocity in the microchannel, and v is the kinematic viscosity. In Figure 13 we present the flow regime map for the three tested modules with triangular parallel microchannels. The map was obtained for heat fluxes in the range 5.1–50 W/cm2, and vapor quality in the range 0.01–0.1. It is difficult to make meaningful comparison between the present map and previous studies because most previous work have been concerned with flow patterns air–water flow in single tube.
Convective Boiling of Polyglycoside Surfactants
The cooling may be accompanied by a complex pattern characterized by spatial temperature variations that can produce potentially destructive thermal stresses along the interface between the chip and the substrate or heat sink. This is one of the key justifications for seeking nearly isothermal heat sink.
Furthermore, a large temperature gradient is undesirable for the electronic perfor-mance since many electronic parameters are adversely affected by a substantial tempera-ture rise. For instance, in electronic devices, electrical-thermal instability occurs within a high-temperature region, because the basic elements of electronic circuits have a switch-ing time that decreases with increasswitch-ing temperature. The nonuniform temperature leads to change of the resistance and capacitance of interconnection lines resulting in a signifi-cant increase delay in signal propagation. This phenomenon may be the dominant factor determining the performance of electronic circuits.
Figure 14. Dependence maximum chip temperature on heat flux.
It was shown by Hetsroni et al. [19] that during nucleate pool boiling of water with cationic surfactant Habon G, the boiling curves were quite different from those of pure water. Under certain conditions the wall temperature did not increase with increase in heat flux. This effect may be used to provide a nearly isothermal heat sink. The drawback with this coolant is environmental impact. That is why we used an environmentally friendly surfactant with concentration 100 ppm as cooling fluid. A different set of apparati was used in order to investigate this phenomenon: a mini-gear pump, providing continuous flow and a sensitive rotameter with an accuracy of 2% were used. The surfactant solution was passed through 26 microchannels that were connected by type A plena. In Figure 14 the maximum chip temperature is plotted versus the applied heat flux. For surfactant solutions (open points) the data are shown for two values of mass flux:m˙ =38.3 and
˙
m=59.6 kg/m2s. The data for water flow (closed points) are also shown in the figure form˙ =37.7 andm˙ =58.2 kg/m2s. Particularly, one can see that for surfactant solution (mass fluxm˙ =59.6 kg/m2s) maximum chip temperature remains nearly constant in the range of heat fluxq=12–42 W/cm2. For water boiling the range isq=7–11 W/cm2. It is possible that surfactants may have a similar effect on boiling of other liquids with a lower saturation temperature than water. In that case, lower and uniform surface temperatures could be established.
CONCLUSIONS
1. Two flow regimes may be considered in steam–water flow. The low heat flux region is characterized by the presence of liquid phase in part of the parallel microchannels. In this case the mean temperature on the whole heated surface is less than the saturation temperature of the fluid. At low heat fluxes, bubble nucleation on the wall occurred. The high of heat flux region is characterized by convective boiling, in all parallel microchannels, accompanied by
420 G. HETSRONI ET AL.
periodical rewetting and refilling of the microchannels. At high heat fluxes the vapor was also accumulated in the inlet plenum. At inception, the bubble is close to being spherical. Then the bubbles extend and occupy the entire cross section of the channel, like vapor slugs. The velocity of the vapor slugs is higher than the velocity of surrounding fluid. We assume that the bubbles respond to an initial brief but large increase in the internal pressure. Therefore, after the first moments during which the pressure is still high, there is a rapid change of the bubble volume. Then the internal pressure quickly falls to near the saturation value, due to the expansion. In this case the bubble size approach an asymptotic value. This situation takes place at low values of heat flux only. The situation changes drastically at high value of heat flux. In this case the heat transferred to the vapor volume is higher, and the explosive vaporization and significant pressure drop fluctuations occur. Flow pattern, observed in the present study and reported also by Kandlikar [9], revealed a flow reversal in some channels with expanding bubbles pushing the liquid–vapor interface in both upstream and downstream directions.
2. Boiling of surfactants solutions in microchannels may be used to provide a nearly isothermal heat sink.
REFERENCES
1. C. A. Damianides and J. W. Westwater, Two-Phase Flow Patterns in a Compact Heat Exchanger and in Small Tubes, Proc. Second UK National Conf. on Heat Transfer, Glasgow, 14–16 September,Mechanical Engineering Publications, London, pp. 1257–1268, 1988.
2. T. Fukano and A. Kariyasaki, Characteristics of Gas-Liquid Two-Phase Flow in Capillary,
Nuclear Engineer, vol. 141, pp. 59–68, 1993.
3. K. A. Triplett, S. M. Ghiaasiaan, S. I. Abdel-Khalik, and D. L. Sadowski, Gas-Liquid Two-Phase Flow in Micro-Channels. Part 1: Two-Two-Phase Flow Patterns, International Journal of Multiphase Flow, vol. 25, pp. 377–394, 1999.
4. T. S. Zhao and Q. C. Bi, Co-Current Air-Water Two-Phase Flow Patterns in Vertical Triangular Micro-Channels,International Journal of Multiphase Flow, vol. 27, pp. 765–782, 2001. 5. X. F. Peng and B. X. Wang, Forced Convection and Boiling Characteristics in Micro-Channels.
Proc. 11 IHTC, vol. 1, pp. 371–390, 1998.
6. X. F. Peng, H. Y. Hu, and B. X. Wang, Boiling Nucleation During Liquid Flow in Micro-Channels,International Journal of Heat Mass Transfer, vol. 41, pp. 101–106, 1998.
7. G. Hetsroni, A. Mosyak, and Z. Segal, Nonuniform Temperature Distribution in Electronic Devices Cooled by Flow in Parallel Micro-Channels,IEEE Transactions on Components and Packaging Technologies, vol. 24, pp. 16–23, 2001.
8. L. Zhang, J. M. Ko, and L. Jiang, Measurements and Modeling of Two-Phase Plow in Micro-Channels with Nearly Constant Heat Flux Boundary Conditions, Journal of Microelectro-mechanical Systems, vol. 11, pp. 12–19, 2002.
9. G. Kandlikar, Fundamental Issues Related to Flow Boiling in Minichannels and Micro-Channels,
Experimental Thermal and Fluid Science, vol. 26, pp. 389–407, 2002.
10. E. Ory, H. Yuan, A. Prosperetti, S. Popinet, and S. Zaleski, Growth and Collapse of a Vapor Bubble in Narrow Tube,Physics of Fluids, vol. 12, pp. 1268–1277, 2000.
11. S. M. Ghiaasiaan and S. I. Abdel-Khalik, Two-Phase Flow in Micro-Channels,Advances in Heat Transfer, vol. 34, pp. 145–253, 2001.
12. E. L. Bibeau and M. Salcudean, A Study of Bubble Bullition in Forced-Convective Subcooled Nucleate Boiling at Low Pressure, International Journal of Heat Mass Transfer, vol. 37, pp. 2245–2259, 1994.
13. V. Prodanovic, D. Fraser, and M. Salcudean, Bubble Behavior in Subcooled Flow Boiling of Water at Low Pressures and Flow Rates, International Journal of Multiphase Flow, vol. 28, pp. 1–19, 2002.
14. L. Jiang, M. Wong, and Y. Zohar, Forced Convection Boiling in a Micro-Channel Heat Sink,
Journal of Microelectromechanical Systems, vol. 10, pp. 80–87, 2001.
15. Z. H. Quershi Jeter, The Onset of Flow Instability in Uniformly Heated Horizontal Micro– channels,Journal of Heat Transfer, vol. 122, pp. 118–125, 2000.
16. W. Qu and I. Mudawar, Prediction and Measurement of Incipient Boiling Heat Flux in Micro-Channel Heat Sinks,International Journal of Heat and Mass Transfer, vol. 45, pp. 3933–3945, 2002.
17. K. Johansen, Low Quality Transition and Inverted Annular Flow Film Boiling of Water: An Updated Review,Experimental Thermal and Fluid Science, vol. 4, pp. 497–509, 1991. 18. Y. S. Hong, C. N. Ammerman, and S. M. You, Boiling Characteristics of Cylindrical Heaters
in Saturated, Gas Saturated, and Pure-Subcooled FC 72,Journal of Heat Transfer, vol. 119, pp. 313–318, 1997.
19. G. Hetsroni, J. L. Zakin, Z. Lin, A. Mosyak, E. A. Pancallo, R. Rozenblit, The Effect of Surfactants on Bubble Growth, Wall Thermal Patterns and Heat Transfer in Pool Boiling,
International Journal of Heat and Mass Transfer, vol. 44, pp. 485–497, 2001.