Mahalik et al. Microb Cell Fact (2017) 16:133
DOI 10.1186/s12934-017-0744-3
RESEARCH
Identifying genomic targets for protein
over-expression by “omics” analysis of Quiescent
Escherichia coli
cultures
Shubhashree Mahalik, Ashish Kumar Sharma, Priyanka Jain and Krishna Jyoti Mukherjee
*Abstract
Background: A cellular stress response is triggered upon induction of recombinant protein expression which feed-back inhibits both growth as well as protein synthesis. In order to separate these two effects, it was decided to study “quiescent cultures” which continue to be metabolically active and express recombinant proteins even after growth cessation. The idea was to identify and up-regulate genes which are responsible for protein synthesis in the absence of growth. This would ensure that, even if growth were adversely affected post induction, there would be no atten-dant reduction in the protein expression capability of the cells. This strategy allowed us to design host strains, which did not grow better post induction but had significantly higher levels of protein expression.
Results: A quiescent Escherichia coli culture, which is able to sustain recombinant protein expression in the absence of growth, was analyzed by transcriptomic and proteomic profiling. Many genes involved in carbon utilization, biosyn-thesis of building blocks and stress protection were found to be up-regulated in the quiescent phase. Analysis of the global regulators showed that fis, which tends to get down-regulated as the cells enter stationary phase, remained up-regulated throughout the non-growing quiescent phase. The downstream genes regulated by fis like carB, fadB,
nrfA, narH and queA were also up-regulated in the quiescent phase which could be the reason behind the higher metabolic activity and protein expression ability of these non-growing cells. To test this hypothesis, we co-expressed
fis in a control culture expressing recombinant l-asparaginase and observed a significantly higher buildup of l
-aspara-ginase in the culture medium.
Conclusions: This work represents an important breakthrough in the design of a superior host platform where a gene not directly associated with protein synthesis was used to generate a phenotype having higher protein expres-sion capability. Many alternative gene targets were also identified which may have beneficial effects on expresexpres-sion ability.
Keywords: E. coli, Quiescence, Cellular stress response, fis, Transcriptomic profiling, Asparaginase expression
© The Author(s) 2017. This article is distributed under the terms of the Creative Commons Attribution 4.0 International License (http://creativecommons.org/licenses/by/4.0/), which permits unrestricted use, distribution, and reproduction in any medium, provided you give appropriate credit to the original author(s) and the source, provide a link to the Creative Commons license, and indicate if changes were made. The Creative Commons Public Domain Dedication waiver (http://creativecommons.org/ publicdomain/zero/1.0/) applies to the data made available in this article, unless otherwise stated.
Background
A key area, which has seen enormous growth in the past two decades, is the design of improved systems for expressing recombinant proteins. The availability of sev-eral expression hosts, strong titrable and inducible pro-moters to reduce inclusion body formation, fusion tags for efficient purification and solubilization, signal pep-tides for desired localization, and finally the high levels of
productivity all ensure that the bacterial system remains the most extensively used system for this purpose [1–4]. In spite of these developments, protein expression remains a challenge with poor product yields often being a major impediment to successful commercialization of many recombinant products.
Recombinant protein over-expression elicits a stress response which down-regulates genes for substrate uptake, rRNA synthesis, energy metabolism and many others, all of which are critical for both growth and pro-tein production [5]. It is therefore, common to observe
Open Access
Microbial Cell Factories
*Correspondence: [email protected]
the cessation of both, growth as well as recombinant pro-tein synthesis, within a few hours post induction, which is the primary reason behind the poor yields, obtained in recombinant cultures [6]. Since protein synthesis and growth are inextricably linked processes, the usual strat-egy to extend the production phase has been to attempt to recover growth and hence protein expression by up-regulating these genes by knock-ins or plasmid based co-expression [7, 8]. However, if we were to focus only on those genes that feedback inhibits protein expression instead of alleviating the overall stress response, we could allow this response to selectively block growth without impeding protein production. This would have the dual advantage of diverting the metabolic flux towards prod-uct formation rather than biomass and also reducing the substrate and energy requirements of the culture. Clearly, non-growing or slow growing cells would also have sig-nificantly lower oxygen demand and heat production rates, factors which are critical during high cell density fermentations [9]. Identifying such genes to design such a cellular platform is however extremely difficult in prac-tice. Unlike metabolites, which are the products of single pathways, recombinant protein synthesis involves the use of multiple features of the cellular machinery. Transcrip-tion, translaTranscrip-tion, energy, amino acids, tRNAs etc. are all inputs to this process and these are intricately linked to the process of growth. Also the control network of E. coli
is a complex hierarchy, which is not fully elucidated [10,
11]. Separating genes controlling protein synthesis from those affecting growth is thus problematic.
One way out would be the availability of a quies-cent culture where protein synthesis is uncoupled from growth, this could then be analyzed for its transcriptome and proteome profile with respect to a control culture in order to provide useful leads. A first step in the design of such a quiescent cell expression system was the iden-tification of Rcd, a small RNA whose over-expression led to growth cessation and simultaneous increase in recom-binant ScFv expression [12]. Further studies showed that Rcd acts by binding with tryptophanase and increases its affinity for tryptophan, leading to higher rates of indole formation [13]. We, therefore, developed a simpler chemical method of inducing quiescence by a controlled addition of indole into the bioreactor that led to success-ful protein expression in the quiescent phase [14]. Once this system was available we performed a comparative transcriptomic analysis of this indole induced quiescent cultures with non-quiescent control cultures to iden-tify the differentially up and down-regulated genes. This was followed by looking at the proteomic profiles, since non-dividing quiescent cells may continue to harbor pro-teins long after their synthesis has stopped. These studies revealed the differential changes in the mRNA expression
levels of transcriptional regulators, which are the nodes that control cellular metabolism, growth and protein expression. These genes were then utilized for the design of an improved platform for recombinant l-asparaginase (l-Asp) expression.
Results
Expression of l‑Asp from quiescent E. coli W3110hnsΔ93‑1
strain
After optimizing the procedure for indole addition, we analyzed the expression of l-Asp in indole treated cul-tures. For these experiments, 3.5 mM indole was used to induce quiescence in E. coli W3110hnsΔ93-1 cells [14], Three shake flask cultures were set up; an uninduced con-trol culture without indole or IPTG (W3110hnsΔ93-1_ UI), a second induced control culture with IPTG but no indole (W3110hnsΔ93-1_I) and a third test culture treated with indole for quiescence and then induced with IPTG for l-Asp expression (W3110hnsΔ93-1_QI). Very little difference was observed in the growth profile of the two control cultures (induced and uninduced; both with-out indole), in comparison to quiescent culture express-ing l-Asp, which showed a significant decline in biomass formation. These experiments were repeated multiple times and a typical OD600 profile is shown in Fig. 1a. We
compared the ability of W3110hnsΔ93-1 cells to express extracellular l-Asp under normal and quiescent condition and observed that the normal cells (W3110hnsΔ93-1_I) showed better expression as compared to quiescent cells. This can be attributed primarily to the significantly lower biomass concentrations obtained in quiescent cultures. However, the slow buildup of l-Asp in the supernatant of the quiescent cells did demonstrate the ‘proof of principle’ that quiescent cells do have the ability to express recombi-nant proteins under non-growing conditions (Fig. 1b, c).
High cell density cultivation of quiescent culture
The next step was to induce quiescence by indole addi-tion at high cell density where we could observe its sta-bility and sustained expression capasta-bility. Several reactor runs were undertaken to estimate the metabolic activity and expression potential during quiescence. For this we ensured that the cellular environment was conducive to product formation by controlling the pH, dissolved oxy-gen (DO) and feeding rate. The activity of l-Asp was checked by a standard colorimetric assay using Nessler’s Reagent [15]. This allowed us to compare the rate of expression of l-Asp in quiescent cultures with control.
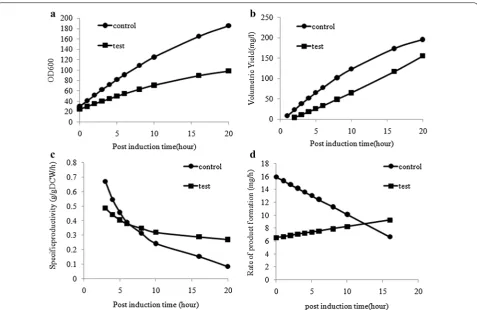
The final OD600 of the control culture was 185, which
Page 3 of 11 Mahalik et al. Microb Cell Fact (2017) 16:133
better in the quiescent cells (Fig. 2c). Also the rate of product formation (dP/dt) in the control culture declined with time, whereas the quiescence culture could sus-tain the product formation rate till 20 h post induction (Fig. 2d). Thus, this strategy was able to achieve a state of quiescence where growth and product formation kinet-ics were decoupled and metabolic fluxes were diverted towards recombinant protein formation. To locate the targets that are specifically responsible for allowing protein expression to continue unhindered during the quiescent phase, it was decided to do transcriptomic and proteomic profiling and identify the differentially expressed genes and proteins. The idea was to try and separate the genes involved in growth cessation from those which impact specifically on protein expression.
Transcriptomic profiling to identify genes responsible for diverting the metabolic flux specifically
towards product formation
Earlier studies on transcriptomic profiling in our lab have analyzed the post induction response of cultures
expressing recombinant proteins [6, 16]. Both specific growth rate (µ) and specific product formation rate (qp)
decline simultaneously during the post induction phase of recombinant protein expression. So it is difficult to identify those genes that are specifically responsible for the drop in expression capacity but not growth. Qui-escent cells thus, provide an ideal platform where such genes can be separated from those responsible for growth cessation. To locate the appropriate window to study, we selected a phase of declining µ post induction and com-pared the change in qp in both control and quiescent
cultures. We observed that when µ declined from 0.1 to 0.05 h−1 the q
p of the control culture declined sharply,
whereas the qp of the quiescent cells remained more or
less constant at a much higher value (Table 1). Samples for transcriptomic analysis were therefore taken when the µ values were 0.1, 0.08 and 0.05 h−1.
Impact of quiescence on cellular physiology
An important aspect of the quiescent cell physiology is their sustained protein expression capability compared to
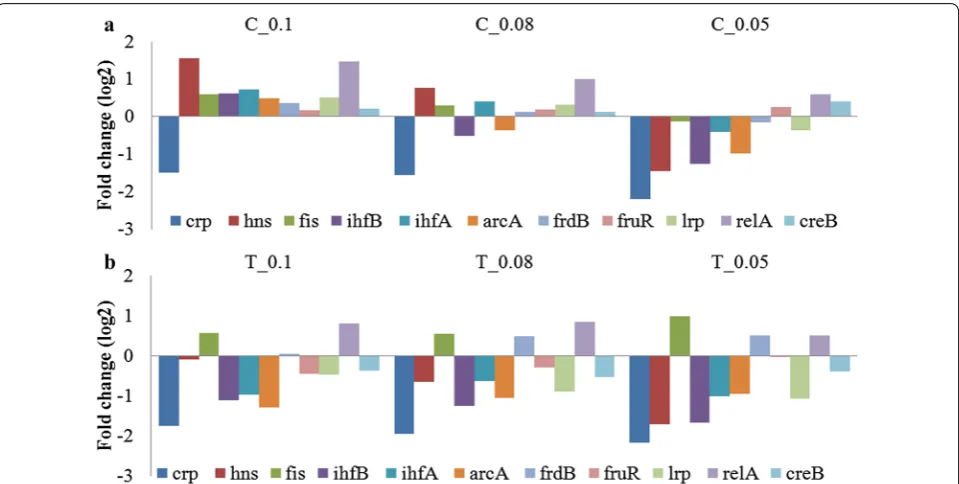
control. To get a holistic picture and identify the genes responsible, we looked at the difference in the tran-scriptomic profile of the control and quiescent cultures with respect to the genes coding for regulatory proteins (Fig. 3). The difference in transcriptomic profile was determined on the basis of fold change in mRNA level, which refers to the change in gene expression levels between pre and post induction samples due to the stress associated with recombinant protein expression. Con-trol cultures have a typical stress response and hence a characteristic fold change pattern whereas the quiescent cultures (Test) have an altered stress response and hence a different fold change pattern. It is this difference that allowed us to identify the differentially expressed genes. Even though the experiments were carried out with a W3110hnsΔ93-1 strain, which produces a truncated H-NS protein, the expression pattern of the H-NS gene was analyzed, since the H-NS mutation may lead to the differential expression of several proteins.
More important were the genes expressing regula-tory proteins, as their differential expression was criti-cal to the generation of quiescence. It was observed that
in the control culture, most of these regulatory genes were up-regulated in the early phase of induction, when the specific growth rate was high. With declining spe-cific growth rates, the expression of most of these genes got down-regulated. In contrast, in the quiescent cul-ture most of these regulators were down-regulated from the start and the pattern did not change significantly with time. However, three genes i.e. fis, frdB and relA
remained up-regulated in the quiescent cells and of these
fis showed the maximum deviation from control profile.
Fig. 2 a Growth profile of Control (W3110hnsΔ93-1 without indole addition, C) and Quiescent (W3110hnsΔ93-1 treated with Indole, T) cells; Plot showing (b) Volumetric yield (c) Specific productivity (qp) (d) rate of product formation in control (W3110hnsΔ93-1 without indole addition, C) and Quiescent (W3110hnsΔ93-1 treated with Indole, T) cultures
Table 1 Post induction specific growth rate and the cor-responding specific production rate of control (without indole) and Quiescent (indole treated) cultures
l-Asparaginase expression is induced with IPTG and fis is induced with l-arabinose
Specific growth rate
(h−1) qgDCW/h)p_control culture (g/ qgDCW/h)p_test culture (g/
0.1 0.456 0.404
0.08 0.241 0.318
Page 5 of 11 Mahalik et al. Microb Cell Fact (2017) 16:133
We therefore, focused on fis whose mRNA and protein levels are known to peak during early logarithmic phase, and decrease soon thereafter, becoming nearly undetect-able as cells enter the stationary phase, an expression pattern referred to as growth phase-dependent regula-tion [17]. As expected this pattern was observed in the transcriptomic profile of the control culture. However, we obtained an interesting profile for quiescent culture where, irrespective of the slowdown in specific growth rate, there was an elevated level of fis throughout the period of quiescence. Since recombinant protein expres-sion levels also remained high, we can hypothesize that
fis up-regulation is responsible for this phenotype. It pos-sibly counteracts the inhibitory effects of ppGpp, which is responsible for down-regulating rRNA synthesis during slow growing conditions, and thus, helps in enhancing recombinant protein expression in the quiescent phase.
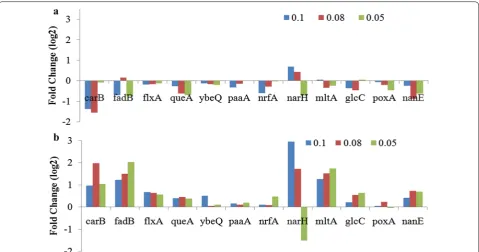
To prove the hypothesis that fis plays a critical role in maintaining cellular metabolic activity; we analyzed those genes that are under direct regulation of fis. The list of genes under direct regulation of fis was obtained from the Ecocyc database and is also available in literature [18]. Figure 4 shows that these genes were also down-regulated in the control, compared to the quiescent cells. Thus, carB (amino acid biosynthesis and de novo UMP biosynthesis), fadB (beta-oxidation of fatty acid for gen-eration of energy equivalents), nrfA and narH (electron
transport chain) were all significantly up regulated in the quiescent culture compared to the control. This up regulation indicates that the quiescent cells were meta-bolically active and were able to perform all the critical functions required for maintaining cellular health and expression capacity even during the non-dividing stage.
Proteomic profile of the quiescent culture
Earlier reports have shown that the proteome can differ significantly from the transcriptome due to variations in translational efficiencies and stability of the proteins [19]. In quiescent cells, where in the absence of cell divi-sion the protein concentrations do not get diluted out, stable proteins can remain at high levels long after the transcriptional machinery has shut down. Thus, the pro-teomic profiles of quiescent cells can be significantly dif-ferent from the transcriptome. Samples from fed batch fermentations, induced for l-Asp expression, with and without indole addition, were collected at three time points corresponding to specific growth rates of 0.1, 0.08 and 0.05 h−1 post induction, thus, matching the
tran-scriptomic profile time points. The sample from fed batch fermentation where indole was not added was taken as control (C) and those with indole addition were taken as test samples (T). Pre induction samples were taken as a control for every run. 2D PAGE and subsequent protein identification was carried out as described in materials
and methods. The PANTHER Classification system was used to biologically classify the identified proteins on the basis of their Molecular Functions, role in Biologi-cal Process, Cellular Location and Pathway to which they belong. In the control culture, 278 distinct spots were obtained, while 259 spots were seen in the quiescent cul-ture. Using databases, we could identify 116 proteins in the control set while only 84 proteins could be identified in the quiescent culture.
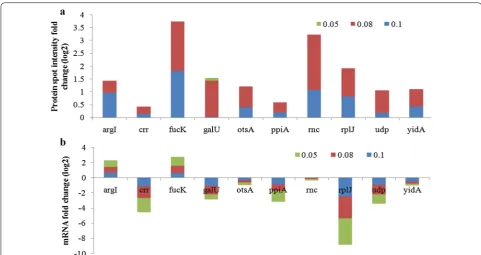
The protein spots that were considered for this study were those specifically present in the quiescent culture but either absent or present in extremely low concen-trations in the control culture (Fig. 5). Indole not only induces quiescence but also acts as a signalling mole-cule that has a widespread effect on cellular physiology. This part was critical since the proteomic profile would identify targets that have been specifically hit by indole. Indole toxicity would generate a metabolic response but simultaneously it would reduce the stress associated with recombinant protein production by slowing the growth rate. So there was a need to differentiate between the two effects viz indole toxicity and generation of quies-cent phenotype with a concomitant reduction in the cel-lular stress response. This would allow us to choose the best gene targets to alleviate the deleterious effects of the cellular stress response on recombinant protein produc-tion without the attendant ill effects of indole toxicity. A
2-way comparison between the transcriptomic and prot-eomic profiles of both control and quiescent conditions for this set would confirm their role in quiescence and enhanced expression capability. In quiescent cultures, since cells are in a non growing stage, the energy require-ments are low, but the glycolytic pathway remains active and up-regulation of Crr, FucK, GalU (carbon utilization) indicates that quiescent cells have active pathways for utilization of alternative carbon sources to fuel the glyco-lytic pathway. Similarly Udp protein was found to be up-regulated which is known to be involved in the pathway that utilizes nucleosides as a carbon and energy source. This is again an indication that the quiescent cell is using alternative sources of energy in the absence of an active TCA cycle. ArgI, (biosynthesis of building blocks), OtsA (stress protection), TatB (protein transporter) proteins were observed only in the proteome of the quiescent cells which explains how, even in the non dividing stage, qui-escent cells retain a high basal level of metabolic activity and several proteins of critical pathways are up-regu-lated. Also, unlike the control culture, proteins related to recombinant protein expression, folding and process-ing like RplJ, Rnc, PpiA were present in high amounts, which could be the reason for quiescent cells having an enhanced protein production rate. The proteomic profil-ing of quiescent cells thus helped us to identify the set of proteins whose presence allowed it to retain its metabolic
Page 7 of 11 Mahalik et al. Microb Cell Fact (2017) 16:133
activity along with its expression ability, even in the absence of growth. While the transcriptomic analysis did identify some genes whose up-regulation may be respon-sible for this desired phenotype, the proteomic data con-stituted a direct proof. Thus proteomic analysis helped in identifying proteins that did not decline, due to reasons of protein stability; even if mRNA levels got down-reg-ulated. Such proteins by virtue of their presence in fairly high concentrations could have a critical role in generat-ing the quiescent phenotype.
The differential proteome analysis using 2-DE sug-gested that several key changes take place in cellular physiology including carbon and energy metabolism, building block biosynthesis, protein translation, folding, and cell protection. Proteome analysis not only validated the transcriptomic data but also offered better insights for further genetic modifications that may be required for designing a host with enhanced protein expression capability.
Effects of fis co‑expression on recombinant protein expression
A fairly large number of leads were obtained from the differential transcriptomic and proteomic profile of the quiescent cells with respect to control. Among these
fis was chosen as the most promising candidate for up-regulation, given its role as a global regulator and mul-tiple effects on cellular physiology. Thus, an important function of fis is the activation of stable RNA (rRNA and tRNA) and induction of related promoters on nutritional shift-up [20, 21], which would increase the capacity of the translational machinery. Also fis enhances energy metab-olism by growth phase stimulation of the nuo and ndh
operons to yield high ATP and maintain redox balance [22]. Since recombinant protein production is an energy intensive process and down-regulation of ribosome bio-synthesis and translational machinery is known to be one of the major bottlenecks in recombinant protein syn-thesis [23], it was decided to co-express fis along with a recombinant protein (l-Asp) to test its effect on protein expression.
Cell growth was monitored and no significant differ-ence was observed in the growth profile of control and
fis co-expressed cultures (Fig. 6a). Protein quantification of supernatant samples was performed and we observed that fis over-expression led to drastic increase in l-Asp productivity (Fig. 6b). Clearly, fis which is involved in ribosome synthesis during rapid cell growth [24] and energy metabolism [22] has an important role in sustain-ing recombinant protein production.
Discussion
Previous studies on transcriptomic profiling of high cell den-sity cultures expressing recombinant proteins, have shown that a large number of genes are highly down-regulated post induction as a part of the cellular stress response [25, 26] which is the probable reason for decline in both growth and specific product formation rate [16]. We postulated that this stress response is a two-step process where, first, growth gets blocked and subsequently, this growth cessation leads to the down-regulation of genes involved in energy metab-olism and protein translation. Indeed, a careful analysis of post induction growth and protein production profiles for many proteins shows that product formation continues for a slightly longer period than growth. These two effects could, therefore, be separated and a nuanced strategy, which selec-tively allows protein expression to continue, can be adopted, leading to a design of a superior expression platform.
l-Asparaginase was chosen as a model protein for this study because it first builds up in the periplasm and then leaches out as an extracellular product. Growth typically stops by the time l-asparaginase has accumulated in the periplasm and, therefore, in control, we see only a short period of extracellular production. With fis co-expres-sion, this process was sustained for a significantly longer time, clearly demonstrating the validity of this approach.
The proteome of the quiescent cells showed many additional targets for up-regulation. Many of these are involved in carbon utilization, biosynthesis, energy metabolism, etc., all of which are critical for protein pro-duction. Since these genes are not under the control of fis
they may have synergistic effects on expression capability.
Conclusions
Systems biology tools offer a platform to understand the cellular physiology and plan strategies to design better platforms for enhanced production of recombi-nant proteins. From the combined -omics analysis and
co-expression studies, we could conclude that the cell strategically respond to stress associated to recombinant protein production by altering expression at mRNA and protein levels of key genes. The potential of such modi-fied strains could thus be explored for the expression of toxic proteins whose induction leads to a sharp drop in growth, leading in turn to very low levels of expression.
Methods
Strains and plasmid
The strains and plasmids used in this study are listed in Additional file 1: Table S1. All the strains were cultured aerobically in commercially available Terrific Broth (TB) medium supplemented with 10 mM MgSO4 and 0.4%
glycerol at 37 °C with constant shaking at 200 RPM. The concentrations of antibiotics used were ampicillin 100 µg/ml (1×) and kanamycin 50 µg/ml (1×).
Construction of plasmids and recombinant DNA techniques
Recombinant DNA work was carried out according to standard protocols described in Maniatis et al. [27]. Qia-gen plasmid isolation kit was used to isolate all plasmids. Restriction endonucleases were purchased from Fermen-tas (Waltham, MA, USA) and digestions were performed accordingly. Qiagen gel extraction kit was used to purify digested vectors and PCR fragments from agarose gels. DNA ligations and subsequent transformations into competent E. coli DH5α were carried out according to standard protocols. The model protein used for this work was l-asparaginase (l-Asp). The detailed construction of the recombinant l-Asp plasmid pMALS1Asp used in this study has been described in Additional file 1: Figure S1.
Fed batch of quiescent cells
For fed batch cultivation, freshly transformed W3110hnsΔ93-1 carrying the recombinant pMALS1Asp
Page 9 of 11 Mahalik et al. Microb Cell Fact (2017) 16:133
plasmid was inoculated in 10 ml of TB medium contain-ing 100 µg/ml ampicillin and grown overnight. This cul-ture was used to inoculate 200 ml TB medium having the same antibiotic concentration and grown for 8–10 h till an OD600 of 6–7. This was used as an inoculum for the
fermenter containing 2 l TB medium. The initial media composition for the batch was TB medium supplemented with 0.4% glycerol and 10 mM MgSO4. The temperature,
pH and DO were set at 37 °C, 7.0 and 40%, respectively. The initial stirrer speed, airflow, pH control and auto-matic DO control was the same for all the runs. Antifoam was used occasionally as required. The feed composition was 18% glycerol, 12% yeast extract, 12% tryptone and 10 mM MgSO4.
Addition of indole is a critical step to induce quies-cence. Several parameters had to be monitored before and during indole addition. Among them pH and RPM were critical. Once the batch culture OD600 reached 8–10
the feed was started at a constant flow rate of 46 ml/h. The increase in OD600 was monitored every 30 min and
the specific growth rate (µ) was calculated. The cul-ture was induced using 1 mM IPTG when the µ value fell to 0.25 h−1. Simultaneously the indole pump was
started at 0.16 ml/min and run for ~2 h. Any decline in oxygen transfer rate (OTR) as indicated by a rise in DO and a subsequent fall in RPM along with decline in pH indicated the onset of indole toxicity and therefore, the indole feed was stopped. The pH, RPM and DO recov-ered within 30 min of stoppage. 1 mM IPTG and 8 ml/l indole was also added to the feed tank to prevent their dilution in the bioreactor. Samples were collected hourly for analysis. Similar conditions were used for the control culture where no indole was added.
Microarray experiment
Samples from the fed batch fermentations of quiescent and control cultures were collected at three time points post induction corresponding to specific growth rates of 0.1, 0.08 and 0.05 h−1. The samples from cultures without
indole addition are taken as control (C) and those with indole addition were taken as the test (T). Pre induction samples were taken as an additional control for every run. The cDNA synthesis, labelling (biotin) and hybridization (Affymetrix GeneChip E. coli genome 2.0 array) were per-formed according to the Affymetrix GeneChip expression analysis protocols. Washing, staining and amplification were carried out in an AffymetrixGeneChip® Fluidics Station 450. AffymetrixGeneChip® scanner 3000 was used to scan the microarrays. Quantification and acqui-sition of array images were done using Affymetrix Gene Chip Operating Software (GCOS) version 1.4. Three types of detection calls (i.e., present, absent, or marginal) were calculated using statistical expression algorithm and
average normalization was performed. Hybridization and spike controls were used.
Subsequent data analysis was performed using Gene-Spring GX11.5 software (Agilent Technologies, USA). RMA algorithm was used for data summarization [28] and quality control of samples was assessed by principle component analysis (PCA). Fold change was calculated with respect to the uninduced control (0 h). Normalized signal intensities of each gene on chips were converted to log2 values, and compared between experiments.
The microarray data has been deposited in the Gene Expression Omnibus database at NCBI (GEO: www.ncbi.
nlm.nih.gov/geo/query/acc.cgi?acc=GSE29486) under
the Accession Number GSE29486.
Proteomic profiling
with the MASCOT 2.2 search engine (MatrixScience,
http://www.matrixscience.com/) was used for spot pro-teins identification by querying the trypsin-digested pep-tide fragment data using the reference database NCBInr 20121103 (21332039 sequences; 7307542895 residues). The taxonomy selected was Escherichia coli (383979 sequences). The search parameters used were; type of search: peptide mass fingerprint, enzyme: trypsin, fixed modifications: carbamidomethyl (C), variable modifica-tions: oxidation (M), mass values: monoisotopic protein mass: unrestricted, peptide mass tolerance: ±100 ppm, peptide charge state: 1+ , max missed cleavages: 1. Bruker Daltonics BioTools Version 2.2 software was used for interpretation of MS data.
Cloning and co‑expression of regulatory gene fis
fis Gene was chosen from transcriptomic profile analysis for co-expression studies. It was cloned in pPROLar.A122 which is part of the PRO Bacterial Expression System. The plasmid is compatible for co-expression with pMAL-S1Asp. The details of the cloning procedure are provided in the Additional file 1: Figure S2.
Escherichia coli W3110 cells were co-transformed with pMALS1Asp and pPROfis and transformants were grown overnight in 10 ml TB medium with 50 µg/ml of ampicillin (0.5×) and 25 µg/ml of kanamycin (0.5×) at 37 °C with shaking at 200 RPM. 500 µl of primary cul-ture was used to inoculate four 500 ml flasks each con-taining 50 ml TB medium so that the experiments could be run in duplicates. The recombinant cultures were induced either with 1 mM IPTG for l-Asp expression (control) or both 1 mM IPTG and 0.2% l-arabinose to co-express both genes (test). In these experiments no indole was added to induce quiescence. Post induction samples were collected every 2 h. Cell growth was monitored by measuring OD at 600 nm. Samples were analyzed by SDS PAGE and protein quantification was performed by den-sitometric scanning of Sypro Ruby stained gels.
Authors’ contributions
SM carried out experiments, analyzed the primary data and drafted the manuscript. AKS participated in the Microarray data analysis. PJ performed few supplementary experiments. KJM supervised the whole research work and revised the manuscript. All authors read and approved the final manuscript.
Acknowledgements
The Quiescent Cell Expression system was obtained from Dr. David K. Sum-mers, Department of Genetics, University of Cambridge, Cambridge, United Kingdom. The fellowship offered by UGC–CSIR and the infrastructure facility provided by DBT-BUILDER programme is kindly acknowledged.
Additional file
Additional file 1. Additional figures and tables.
Competing interests
The authors declare that they have no competing interests.
Availability of data and materials
The microarray data has been deposited in the Gene Expression Omni-bus database at NCBI (GEO: www.ncbi.nlm.nih.gov/geo/query/acc. cgi?acc=GSE29486) under the Accession Number GSE29486. All other infor-mation regarding data generated and materials used in the present study are presented in the paper and additional file.
Publisher’s Note
Springer Nature remains neutral with regard to jurisdictional claims in pub-lished maps and institutional affiliations.
Received: 11 January 2017 Accepted: 20 July 2017
References
1. Baneyx F. Recombinant protein expression in Escherichia coli. Curr Opin Biotechnol. 1999;10:411–21.
2. Qing G, Ma L-C, Khorchid A, Swapna GVT, Mal TK, Takayama MM, Xia B, Phadtare S, Ke H, Acton T, et al. Cold-shock induced high-yield protein production in Escherichia coli. Nat Biotech. 2004;22:877–82.
3. Sørensen HP, Mortensen KK. Soluble expression of recombinant proteins in the cytoplasm of Escherichia coli. Microbial Cell Fact. 2005;4:1. 4. Dagar VK, Khasa YP. High-level expression and efficient refolding of
thera-peutically important recombinant human Interleukin-3 (hIL-3) in E.coli. Protein Expr Purif. 2017;131:51–9.
5. Chou CP. Engineering cell physiology to enhance recombinant protein production in Escherichia coli. Appl Microbiol Biotechnol. 2007;76:521–32. 6. Singh AB, Sharma AK, Mukherjee KJ. Analyzing the metabolic stress
response of recombinant Escherichia coli cultures expressing human interferon-beta in high cell density fed batch cultures using time course transcriptomic data. Mol BioSyst. 2012;8:615–28.
7. Singh AB, Mukherjee KJ. Supplementation of substrate uptake gene enhances the expression of rhIFN-β in high cell density fed-batch cul-tures of Escherichia coli. Mol Biotechnol. 2013;54:692–702.
8. Voulgaridou G-P, Mantso T, Chlichlia K, Panayiotidis MI, Pappa A. Efficient E. coli expression strategies for production of soluble human crystallin ALDH3A1. PLoS ONE. 2013;8:e56582.
9. Salehmin MN, Annuar MS, Chisti Y. High cell density fed-batch fermenta-tions for lipase production: feeding strategies and oxygen transfer. Bioprocess Biosyst Eng. 2013;36:1527–43.
10. Federowicz S, Kim D, Ebrahim A, Lerman J, Nagarajan H, Cho B-k, Zengler K, Palsson B. Determining the control circuitry of redox metabolism at the genome-scale. PLoS Genet. 2014;10:e1004264.
11. Ma H-W, Kumar B, Ditges U, Gunzer F, Buer J, Zeng A-P. An extended tran-scriptional regulatory network of Escherichia coli and analysis of its hierar-chical structure and network motifs. Nucleic Acids Res. 2004;32:6643–9. 12. Mukherjee KJ, Rowe DC, Watkins NA, Summers DK. Studies of
single-chain antibody expression in quiescent Escherichia coli. Appl Environ Microbiol. 2004;70:3005–12.
13. Chant EL, Summers DK. Indole signalling contributes to the stable maintenance of Escherichia coli multicopy plasmids. Mol Microbiol. 2007;63:35–43.
14. Chen C-C, Walia R, Mukherjee KJ, Mahalik S, Summers DK. Indole gener-ates quiescent and metabolically active Escherichia coli cultures. Biotech-nol J. 2015;10:636–46.
15. Khushoo A, Pal Y, Singh BN, Mukherjee KJ. Extracellular expression and single step purification of recombinant Escherichia colil-asparaginase II.
Protein Expr Purif. 2004;38:29–36.
16. Sharma AK, Mahalik S, Ghosh C, Singh AB, Mukherjee KJ. Comparative transcriptomic profile analysis of fed-batch cultures expressing different recombinant proteins in Escherichia coli. AMB Express. 2011;1:33. 17. Mallik P, Paul BJ, Rutherford ST, Gourse RL, Osuna R. DksA is required for
Page 11 of 11 Mahalik et al. Microb Cell Fact (2017) 16:133
• We accept pre-submission inquiries
• Our selector tool helps you to find the most relevant journal
• We provide round the clock customer support
• Convenient online submission
• Thorough peer review
• Inclusion in PubMed and all major indexing services
• Maximum visibility for your research
Submit your manuscript at www.biomedcentral.com/submit
Submit your next manuscript to BioMed Central
and we will help you at every step:
and stringent control of fis expression in Escherichia coli. J Bacteriol. 2006;188:5775–82.
18. Bradley MD, Beach MB, de Koning AJ, Pratt TS, Osuna R. Effects of Fis on Escherichia coli gene expression during different growth stages. Microbi-ology. 2007;153:2922–40.
19. Maier T, Güell M, Serrano L. Correlation of mRNA and protein in complex biological samples. FEBS Lett. 2009;583:3966–73.
20. Verbeek H, Nilsson L, Baliko G, Bosch L. Potential binding sites of the trans-activator FIS are present upstream of all rRNA operons and of many but not all tRNA operons. Biochem Biophys Acta. 1990;1050:302–6. 21. Nilsson L, Verbeek H, Vijgenboom E, van Drunen C, Vanet A, Bosch L.
FIS-dependent trans activation of stable RNA operons of Escherichia coli under various growth conditions. J Bacteriol. 1992;174:921–9.
22. Jackson L, Blake T, Green J. Regulation of ndh expression in Escherichia coli by Fis. Microbiology. 2004;150:407–13.
23. FaT Haddadin. Harcum SW: Transcriptome profiles for high-cell-density recombinant and wild-type Escherichia coli. Biotechnol Bioeng. 2005;90:127–53.
24. Zhang X, Bremer H. Effects of Fis on ribosome synthesis and activity and on rRNA promoter activities in Escherichia coli. J Mol Biol. 1996;259:27–40. 25. Hoffmann F, Rinas U. Stress induced by recombinant protein production
in Escherichia coli. Adv Biochem Eng Biotechnol. 2004;89:73–92. 26. Sørensen HP, Mortensen KK. Advanced genetic strategies for
recombi-nant protein expression in Escherichia coli. J Biotechnol. 2005;115:113–28. 27. Maniatis T, Fritsch EF, Sambrook J. Molecular cloning: a laboratory manual.
New York: Cold Spring Harbor Laboratory; 1982.