R E S E A R C H
Open Access
Potential and active functions in the gut
microbiota of a healthy human cohort
Alessandro Tanca
1, Marcello Abbondio
2, Antonio Palomba
1, Cristina Fraumene
1, Valeria Manghina
1,2,
Francesco Cucca
2,3, Edoardo Fiorillo
3and Sergio Uzzau
1,2*Abstract
Background:The study of the gut microbiota (GM) is rapidly moving towards its functional characterization by means of shotgun meta-omics. In this context, there is still no consensus on which microbial functions are consistently and constitutively expressed in the human gut in physiological conditions. Here, we selected a cohort of 15 healthy subjects from a native and highly monitored Sardinian population and analyzed their GMs using shotgun metaproteomics, with the aim of investigating GM functions actually expressed in a healthy human population. In addition, shotgun metagenomics was employed to reveal GM functional potential and to compare metagenome and metaproteome profiles in a combined taxonomic and functional fashion.
Results:Metagenomic and metaproteomic data concerning the taxonomic structure of the GM under study were
globally comparable. On the contrary, a considerable divergence between genetic potential and functional activity of the human healthy GM was observed, with the metaproteome displaying a higher plasticity, compared to the lower inter-individual variability of metagenome profiles. The taxon-specific contribution to functional activities and metabolic tasks was also examined, giving insights into the peculiar role of several GM members in carbohydrate metabolism (including polysaccharide degradation, glycan transport, glycolysis, and short-chain fatty acid production). Noteworthy, Firmicutes-driven butyrogenesis (mainly due toFaecalibacteriumspp.) was shown to be the metabolic activity with the highest expression rate and the lowest inter-individual variability in the study cohort, in line with the previously reported importance of the biosynthesis of this microbial product for the gut homeostasis.
Conclusions:Our results provide detailed and taxon-specific information regarding functions and pathways actively working in a healthy GM. The reported discrepancy between expressed functions and functional potential suggests that caution should be used before drawing functional conclusions from metagenomic data, further supporting metaproteomics as a fundamental approach to characterize the human GM metabolic functions and activities.
Keywords:Gut microbiota, Metagenomics, Metaproteomics, Metabolic pathway,Faecalibacterium, Short-chain fatty acids
Background
In the latest years, the study of the gut microbiota (GM) has been shifting from a mere description of the taxonomic composition, usually obtained through the application of 16S rRNA gene sequencing to fecal sam-ples, to a broader investigation of GM functional poten-tial, made possible by shotgun metagenomics (MG) approaches [1]. Population MG studies have revealed that GMs share a stable set of core functions, in spite of
a large inter-individual structural/compositional variability [2, 3]. However, since sequenced genes are not necessarily expressed [4, 5], MG cannot provide reliable information on which microbial functional traits are actually changing in response to stimuli from host metabolism, immunity, neurobiology, diet, or other environmental factors. Conversely, this type of information can be gathered by functional meta-omics, as metatranscriptomics (MT) and metaproteomics (MP), which display higher sensitivity to perturbation and may therefore better reflect host-microbiome interactions [6]. In this context, of particular interest is to investigate the relationship between potential and actually active GM features in a human population, in order to identify microbial functions constitutively * Correspondence:[email protected]
1Porto Conte Ricerche, Science and Technology Park of Sardinia, S.P. 55 Porto
Conte - Capo Caccia km 8,400, Località Tramariglio, 07041 Alghero, SS, Italy 2Department of Biomedical Sciences, University of Sassari, Sassari, Italy
Full list of author information is available at the end of the article
expressed in a healthy gut starting from a known MG potential. A recent investigation has addressed this aim with respect to MT, finding transcripts of ribosomal proteins and citrate cycle enzymes among those with the highest expression rate (mRNA/DNA ratio) and genes involved in starch metabolism, amino acid biosynthesis, sporulation, and peptidoglycan biosynthesis as those with the lowest expression rate [7]. Less is known about micro-bial proteins, even though these provide major informa-tion concerning GM metabolism and represent key molecules in the host-GM interaction. Although a few pioneering studies have presented the analysis of paired metagenomes and metaproteomes in disease-related human cohorts [6, 8], a systematic, comparative investiga-tion of taxonomic and funcinvestiga-tional features potentially and actually expressed by the GM of a healthy population has not been described so far.
Here, we selected a cohort of healthy subjects from a clinically monitored Sardinian population and collected from each subject a stool sample which underwent DNA and protein extraction, followed by shotgun MG and MP analyses. MG and MP data were then mined in a comparative fashion in order to (i) find which func-tional features are actively and consistently expressed by the GM, being therefore needful for the host-GM homeostasis; (ii) identify conserved and variable GM features within the population; and (iii) investigate the specific functional and metabolic contribution of the key GM taxa.
Results
Experimental design and general metrics
Fifteen subjects were selected from the SardiNIA study cohort [9]. Stool samples were collected from individuals self-reporting the absence of (i) antimicrobial treatment during the previous 6 months from sample collection, (ii) inflammatory bowel disease and other autoimmune condi-tions, (iii) significant variations of body temperature dur-ing the last 2 weeks, and (iv) unusual body weight fluctuation during the last 3 years before sample collection.
Subjects were selected to avoid sex, age, and body mass index (BMI) biases (Additional file 1: Table S1), and all followed an omnivorous diet.
As illustrated in Fig. 1, a stool sample was collected from each subject, and its metagenome and metapro-teome were characterized by means of shotgun MG and shotgun MP, respectively. A population-based matched database, comprising all MG sequences retrieved from the same cohort under study, was used for MP analysis in order to map protein expression of the very same genes identified by MG. MG sequences were annotated both taxonomically and functionally, and these two annotation levels were linked to address the question on
“who is doing what” within the GM of the selected subjects.
A total of 25,993,645 MG reads and 107,069 peptide-spectrum matches (PSMs) were obtained in this study, with a mean of 2,077,370 reads and 7138 PSMs per sample (Additional file 1: Table S2). In view of the inter-individual variability in the total number of reads, MG reads were randomly subsampled to allow a better com-parison among samples. Taxonomic and functional annotation yields varied between MG and MP, and the relative amount of reads/peptides assigned to a specific genus varied between Firmicutes and Bacteroidetes (Additional file 1: Table S3). Globally speaking, MG data exhibited a larger depth of information compared to MP, both in taxonomic and functional terms, as expected and previously reported [6, 8].
Potential and active functions in the gut microbiota
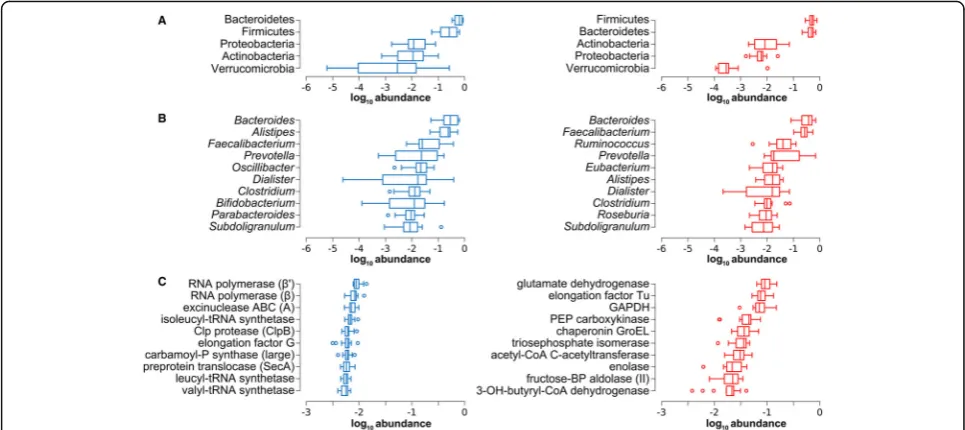
A preliminary, unsupervised multivariate analysis revealed a much clearer separation between MG and MP patterns based on functional data when compared to taxonomic data (Additional file 2: Figure S1). The most abundant phyla (A), genera (B), and functions (KEGG orthologous groups (KOGs); panel C) detected by MG and MP are illustrated in Fig. 2. Consistently, a large overlap could be observed between MG and MP regarding the most abundant phyla and genera, in
Fig. 1Schematic illustrating the experimental design of the study. Fifteen healthy adult subjects (7 males and 8 females) were selected from a clinically monitored Sardinian population. Stool samples were collected from each individual and subjected in parallel to Illumina shotgun DNA sequencing (metagenome profiling) and LTQ-Orbitrap shotgun mass spectrometry analysis (metaproteome profiling). The metagenomes were also employed as sequences databases, in order to allow a rigorous metaproteome/metagenome comparison, and subjected to taxonomic and functional annotation
contrast with considerable differences in functions, highlighting a divergence between functional potential and activity. In particular, enzymes belonging to cata-bolic pathways were generally massively abundant, while not being among the genes present with the highest number of copies in the metagenome. Furthermore, correlation between MG and MP profiles was high when considering taxa abundances, with a linear decrease when going down to lower taxonomic levels (Spearman’s
ρ= 0.90 ± 0.06 (mean ± s.d.) at phylum level,ρ= 0.68 ± 0.07 at genus level), while a considerably lower correlation could be found for functional features (ρ= 0.21 ± 0.06).
We then carried out a comparative investigation of MG and MP features, in order to identify GM functions consistently expressed within the healthy human cohort under study, taking into account the gene potential of the same GMs. To this aim, we computed the log MP/MG abundance ratio for each taxon and function on a subject-by-subject basis and then tested the differ-ence of the log ratios from zero using a one-samplettest with FDR correction, as reported previously in a metagen-ome versus metatranscriptmetagen-ome comparison [7]. On the whole, the percentage of differential features out of the total was extremely high when considering functions (Additional file 1: Table S4), confirming the divergence between potential and active GM functional traits.
Focusing on taxonomy (Fig. 3a), many key GM taxa showed significant differences in relative abundance when comparing gene potential and expressed proteins across
the cohort. For instance, Proteobacteria, Spirochaetes, Verrucomicrobia, and Coriobacteriales showed a signifi-cantly low log MP/MG ratio, whereas taxa belonging to Firmicutes and Bacteroidetes behaved more heteroge-neously. Among them,Faecalibacterium and Ruminococ-cus (Firmicutes) as well as Prevotella (Bacteroidetes) exhibited a significantly high log MP/MG ratio, while a significantly low log MP/MG ratio was measured for Bacilli and Erysipelotrichia (Firmicutes), as well as for Rikenellaceae and Porphyromonadaceae (Bacteroidetes).
The top differential functions are illustrated in Fig. 3b (see Additional file 3: Dataset S1 for further details). Several enzymatic functions exerted by the GM of the studied cohort presented a significantly high log MP/ MG ratio, as those involved in short-chain fatty acid (SCFA, including propionate and, mostly, butyrate) metabolism, as well as in degradation of carbohydrates, polyols, and organic acids. Mapping differential KOGs in the carbon metabolism KEGG map (Additional file 4: Figure S2) visually illustrates that the most active meta-bolic activities performed by the GM are related to glycolysis, gluconeogenesis, pentose phosphate pathway, and butyrate biosynthesis. Ferritin and flagellin were the non-enzymatic proteins with the highest MP/MG log ratio. On the other hand, functions with the lowest MP/ MG log ratios were related to amino acid, transfer RNA (tRNA), and cell wall biosynthesis, as well as to DNA replication and repair. Since some of the MG sequences matching with a high number of peptides did not present Fig. 2Main metagenome and metaproteome features of the gut microbiota. MG data are inblue(left), while MP data are inred(right). Data are ordered by decreasing median of the relative abundance among subjects.aTukey’s boxplots showing the top 5 microbial phyla.bTukey’s boxplots showing the top 10 microbial genera.cTukey’s boxplots showing the top 10 gene/protein functions (KEGG orthology groups). Subunit names are shown into brackets.GAPDHglyceraldehyde 3-phosphate dehydrogenase,PEPphosphoenolpyruvate,Pphosphate,BP
any KOG functional annotation, we performed an add-itional differential analysis simply considering the gene/ protein name as functional information. As a result, two previously non-annotated proteins (propanediol utilization protein PduA and reverse rubrerythrin) exhibited signifi-cantly (and extremely) high MP/MG log ratios, indicating their massive expression yield within the subjects’GMs.
Conserved and variable features in the gut microbiota
Another indication provided by Fig. 2 was that MG data generally exhibited a much higher inter-individual vari-ability (expressed by box width) in taxa than in potential functions, whereas this trend could not be observed in MP. To quantify this observation in a more rigorous and comprehensive fashion, we computed between-subject Fig. 3Features with significantly differential abundance between gut metaproteome and metagenome. Data were filtered based on the mean relative abundance of each feature in the sample cohort (threshold >0.01%).aCladogram illustrating differentially abundant taxa (bluemore abundant in MG,redmore abundant in MP). Dot size is proportional to the mean relative abundance of the corresponding taxon.1 Azospirillum,2 Acinetobacter,3 Escherichia,4 Enterobacter,5 Oxalobacter,6 Parasutterella,7 Alistipes,8 Mucinivorans,9 Prevotella,10 Alloprevotella,11 Paraprevotella,12 Porphyromonas,13 Barnesiella,14 Odoribacter,15 Tannerella,16 Parabacteroides,17 Butyricimonas,18 Holdemania,19 Paenibacillus,20 Bacillus,21 Streptococcus,22 Lactobacillus,23 Megasphaera,24 Veillonella,25 Oscillibacter,26 Peptoclostridium,27 Butyricicoccus,28 Pseudoflavonifractor,29 Intestinimonas,30 Flavonifractor,31 Ruminiclostridium,32 Anaerotruncus,33 Ruminococcus,34 Faecalibacterium,35 Lachnoclostridium,36 Butyrivibrio,37 Coprococcus,38 Tyzzerella,39 Akkermansia,40 Brachyspira,41 Treponema,42 Propionibacterium,43 Actinomyces,44 Eggerthella,45 Gordonibacter.bBar graphs showing the KEGG orthology functional groups with higher MP/MG log ratio (top 20,left) and those with lower MP/MG log ratio (top 20,right). Subunit names are shown into brackets.OHhydroxy,GAPDHglyceraldehyde 3-phosphate dehydrogenase,6P-5DH-2DO-gluconate 6-phospho-5-dehydro-2-deoxy-D-gluconate,PEPCKphosphoenolpyruvate carboxykinase,U-5CMAM modifieruridine 5-carboxymethylaminomethyl modification enzyme,2MT-N6-DMAA2-methylthio-N6-dimethylallyladenosine,1DO-xylulose-5P1-deoxy-D-xylulose-5-phosphate,CFcoupling factor
dissimilarity (Bray-Curtis index) at the taxonomic (genus) and functional level for both MG and MP data. As a confirmation, a higher inter-individual variability concerning the taxonomic composition could be mea-sured in MG compared to MP (Wilcoxon signed-rank test with continuity correction, two-tailedP= 4.7 × 10⁻⁸), while the analysis of functional data revealed a higher variability in MP than in MG (P< 2.2 × 10⁻¹⁶).
To further assess which specific GM taxa and func-tions were more conserved and variable within the human cohort under study, we also calculated the abun-dance coefficient of variation (CV) for each taxon and function measured by MG and/or MP across the 15 subjects. We set two arbitrary thresholds (CV > 150% and < 60%) to define features with high and low inter-individual variability, respectively. The amount of high and low variability features was similar between MG and MP (about 30 and 10%, respectively); conversely, and consistently with dissimilarity data, GM expressed func-tions (MP) were globally much more variable in abun-dance within the population compared to the potential functions (MG), even though this effect was less evident when weighing each feature based on its abundance (Additional file 1: Table S5).
Focusing on taxonomy (cladogram in Fig. 4a), a mod-erate correlation could be observed between MG and MP concerning taxa abundance variability (ρ= 0.33), although no taxa showed opposite trends (e.g., low vari-ability with MG and high varivari-ability with MP). MG and MP provided consistent results for the taxonomic lineage from Verrucomicrobia to Akkermansia, which exhibited high variability within the subjects, and for the taxonomic lineage from Bacteroidetes to Bacteroides, which was instead rather conserved. Moreover, although with slight differences in the degree of variability between MG and MP, levels of Bifidobacterium, Prevotella, and
Butyrivibrio displayed a considerably high variability across the cohort under study, whileAlistipesand Faecali-bacterium were found to be rather conserved in abun-dance among the subjects analyzed.
The most conserved and variable functions (KOGs) are shown in Fig. 4b. A very weak correlation could be observed between MG and MP concerning function abundance variability (ρ= 0.12). In general, the abun-dance of genes related to tRNA and peptidoglycan syn-thesis, as well as to DNA replication and repair, showed low variability among subjects, contrary to some poten-tial activities (including transposases, antibiotic resist-ance genes, and enzymes involved in catabolism of glycans and biogenic amines) exhibiting a higher vari-ability. On the other hand, functions related to glutam-ate degradation and biosynthesis of butyrglutam-ate, besides
“housekeeping” glycolytic enzymes and translation factors, appeared to be consistently active in all subjects
(with high abundance and low variability) based on MP data; interestingly, several stress-related proteins (such as superoxide scavengers and a trigger factor) were found to be among the most variable GM features within the population. Complete data can be found in Additional file 3: Dataset S1.
Specific functional contribution of Firmicutes and Bacteroidetes
We also sought to find phylum-specific functions, i.e., activities mainly or exclusively due to one of the main GM phyla (Firmicutes and Bacteroidetes). To this aim, we computed the log Firmicutes/Bacteroidetes (F/B) abundance ratio for each function on a subject-by-subject basis, as described above for the MG versus MP comparison. Bar graphs of Fig. 5 illustrate functions with the highest and lowest log F/B ratios, according to MG (left, blue) and MP (right, red) data (the complete lists of differential features are given in Additional file 5: Dataset S2). Phylum-specific genes within the metagen-ome, providing insights into the peculiar functional potential of Firmicutes and Bacteroidetes members across the cohort under study, belonged to a wealth of different activities (including sporulation, cell wall bio-genesis and ion transport), mapping to several relevant biosynthetic and degradative pathways (the related car-bon metabolism pathway map is reported in Additional file 6: Figure S3). When considering the metaproteome, the specific contribution of the two main GM phyla appears to be better defined and oriented towards more interrelated metabolic activities. While Bacteroidetes were found to be specifically involved in multiple activ-ities, including iron homeostasis, catabolism of non-glucose monosaccharides (rhamnose, xylose), and folate metabolism, Firmicutes’ specific contribution to the GM metabolism was mainly in butyrate biosynthesis, be-ing most of the differential enzymes (includbe-ing acetyl-CoA C-acetyltransferase, 3-hydroxybutyryl-CoA dehydrogen-ase, butyryl-CoA dehydrogendehydrogen-ase, glutaconyl-CoA decarb-oxylase, and enoyl-CoA hydratase) eventually converging on butyrate production (as illustrated also in the carbon metabolism KEGG map of Additional file 7: Figure S4).
Active role of main gut microbiota members in the carbohydrate metabolism
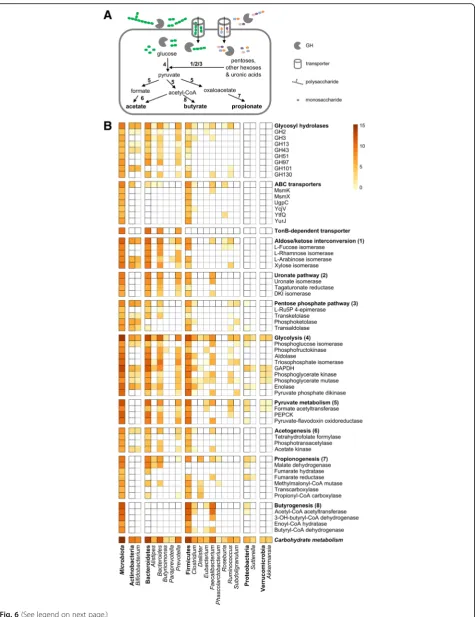
through carbohydrate catabolic pathways (converging on glycolysis); pyruvate and related intermediates are finally utilized for the biosynthesis of SCFAs, including acetate, propionate, and butyrate. Figure 6b illustrates the expression level of each function-taxonomy combin-ation, with functions grouped according to the reference pathway (or functional family), and microbial genera grouped according to the corresponding phylum. Overall
pathway results were retrieved from MP expression data of 81 functional groups (KOGs); 51 of them, found to be expressed in at least half of the subjects, are also reported as single functions.
Considering the GM as a whole, the expression of glycolytic enzymes accounted for about half of the total carbohydrate metabolism, while the relative contribution of butyrate, propionate, and acetate biosynthesis Fig. 4Inter-individual variability of gut microbiota features. Data were filtered based on the mean relative abundance of the features in the sample cohort (threshold >0.01%).aCladogram illustrating taxa with CV >150% (variable,darker color) or <60% (conserved,lighter color) across subjects, according to MG (blue) and MP (red) data. Green dots represent taxa found conserved (dark) or variable (light) based on both MG and MP data. Dot size is proportional to the mean relative abundance of the corresponding taxon.1 Azospirillum,2 Acetobacter,3 Escherichia,4 Enterobacter,5 Parasutterella,6 Sutterella,7 Bacteroides,8 Alistipes,9 Mucinivorans,10 Prevotella,11 Alloprevotella,12 Paraprevotella,13 Porphyromonas,14 Barnesiella,15 Odoribacter,16 Tannerella,17 Butyricimonas,18 Holdemanella,19 Bacillus,20 Streptococcus,21 Acidaminococcus,22 Phascolarctobacterium,23 Megasphaera,
24 Dialister,25 Peptoclostridium,26 Intestinimonas,27 Flavonifractor,28 Anaerotruncus,29 Ruminococcus,30 Subdoligranulum,31 Faecalibacterium,32 Lachnoclostridium,33 Dorea,34 Butyrivibrio,35 Coprococcus,36 Marvinbryantia,37 Akkermansia,38 Brachyspira,39 Bifidobacterium,40 Gordonibacter,41 Desulfovibrio.bBar graphs showing the 10 KEGG orthology functional groups with higher CV (variable,darker color) and the 10 with lower CV (conserved,lighter color) across subjects, according to MG (left,blue) and MP (right,red) data. Subunit names are shown into brackets. Only functional groups detected in at least half of the subjects are shown.MOmonooxygenase,IFinitiation factor,PRNpolyribonucleotide,GMPguanosine monophosphate,LL-DAPL,L-diaminopimelate,5P5-phosphate
enzymes was 12, 3, and 1%, respectively. Another rele-vant metabolic activity was aldose/ketose interconver-sion (7%), whereas sugar transporters (comprising TonB-dependent transporters from Bacteroidetes and ABC transporters from Firmicutes) accounted in total for 6% of carbohydrate metabolism-related proteins. Carbohydrate metabolism appeared to be due to Firmi-cutes and Bacteroidetes at similar extents (46 and 51% of the total, respectively), with Actinobacteria playing a minor role in quantitative terms (3%).
When focusing on the metabolic tasks performed by specific GM members, Bifidobacterium was found to contribute significantly to mucin glycoprotein degrad-ation (endo-α-N-acetylgalactosaminidase activity), as well as to pentose hydrolysis (beta-xylosidase), intercon-version (pentose isomerases), and catabolism (phospho-ketolase and transaldolase within the pentose phosphate pathway).Bacteroidesspp. provided a peculiar and active contribution to starch degradation and uptake, mainly through enzymes and transporters belonging to the starch utilization system (Sus), and were clearly shown to play a key role in fucose, rhamnose, and uronate me-tabolism and also in the glycolytic pathway (especially in the preparatory phase); another main member of Bacter-oidetes, Prevotella, was instead primarily involved in xyloglucan and arabinan degradation. Among Firmicutes genera, we found a strong (and almost exclusive) involvement of Faecalibacterium in butyrogenesis (as well as in oligosaccharide membrane transport and pyru-vate phosphate dikinase activity) and of Dialister in the final part of propionogenesis; furthermore, a considerably
high formate C-acetyltransferase activity from Rumino-coccus spp. was observed. Of note, a high level of sequence homology was observed for many orthologous genes within the same phylum (especially pentose phosphate pathway enzymes and ABC transporters expressed by Firmicutes spp.), making it difficult to achieve a taxonomic classification down to the genus level (at least through the lowest common ancestor approach employed here).
Discussion
This study was meant as a comparative and systematic investigation of potentially and actually expressed features in the GM of a healthy human population. To this purpose, a cohort of clinically monitored Sardinian subjects, following an omnivorous diet and with a BMI distribution largely comparable to that of the general Italian population, was selected for stool sample collec-tion and GM characterizacollec-tion through shotgun MG and MP. As both diet and BMI are known to deeply influ-ence the GM composition (as well as, most likely, its activity), we cannot rule out that cohorts with different food regimens and/or BMI distributions may show different taxonomic and functional profiles; however, a specific investigation of these aspects falls out of the scope of the present work. Furthermore, gut microbiota characterization was carried out using fecal samples, as stool can be collected following non-invasive procedures and is widely recognized as a good proxy for the colonic microbial mass. Nevertheless, some differences in struc-ture and functional expression between colonic and fecal Fig. 5KEGG orthology functional groups with significantly differential abundance between Firmicutes and Bacteroidetes. Data were filtered based on the mean relative abundance of the features in the sample cohort (threshold >0.01%). Functions with higher (top 10) and lower (top 10) Firmicutes/Bacteroidetes (F/B) log ratio according to MG data are shown in theleftbar graph (blue); functions with higher (top 10) and lower (top 10) F/B log ratio according to MP data are shown in therightbar graph (red). Subunit names are shown into brackets.MTHF-tRNA-U5
methylenetetrahydrofolate-tRNA-(uracil-5),1P1-phosphate,1,3-βG-NAHA1,3-beta-galactosyl-N-acetylhexosamine,5P5-phosphate,NADH-Q NADH-quinone,PRGAphosphoribosylglycinamide,NS-ornithine N-succinyl-L-ornithine,OMRPoutermembrane receptor protein,OHhydroxy,MS-transport
multiple sugar transport,ATP-BPadenosine triphosphate-binding protein,6P-5DH-2DO-gluconate6-phospho-5-dehydro-2-deoxy-D-gluconate,AICAR
Fig. 6(See legend on next page.)
microbial communities are expected, especially concern-ing oxygen-sensitive species and enzymes [10, 11].
The taxonomic composition of the GM of the studied cohort, based on MG and MP data, exhibited a large inter-individual variability at the phylum level, with Firmi-cutes ranging from 6 to 78% and Bacteroidetes ranging from 21 to 88% (and the F/B ratio ranging from 0.06 to 3.63), as clearly described in previous studies [2, 12, 13]. The GM taxonomic profile is known to vary widely among different cohorts, based on both genetic and envir-onmental features, including dietary and cultural habits [14–17]. Moreover, it is worth reminding that the output of meta-omic taxonomic profiling can be largely influ-enced by the DNA/protein extraction methods, by library preparation methodologies, and by the specific sequence database(s) used for taxonomic annotation (as detailed below) [18–21].
Another interesting indication provided by this work, although obtained in a small population, regards the inter-individual variability of the abundance of specific GM members. In particular, the relative level of several key genera, including Akkermansia, Prevotella, and
Bifidobacterium, was globally poorly conserved within the human cohort studied, according to both MG and MP results, suggesting a possible higher responsiveness to variables like diet or other environmental factors. Consistently, Akkermansiaabundance has been recently observed to be significantly modulated by many different foods and dietary variables [22–25], changes in
Prevo-tellaspp. levels have been related to increase in fibers in the diet and to glucose metabolism and tolerance [26–28], and many bifidobacteria are widely and long used as probiotics due to their (purported) ability to induce/re-store GM homeostasis [29, 30]. Of note is also the finding concerning the low and high inter-individual variability of butyrate biosynthesis enzymes (see below for discussion on the role of butyrate in gut health) and oxidative stress-related GM functions, respectively. Response of microor-ganisms to reactive oxygen species may in fact vary among individuals based on several factors, including the degree
of activation of oxidative stress mechanisms modulated by the host immune system [31, 32]. Moreover, we found that
Faecalibacterium,Ruminococcus, andPrevotella exhibited a high log MP/MG ratio, suggesting a high protein expres-sion activity of these taxa. This was previously observed for Faecalibacterium, when comparing abundance data based on 16S rRNA gene analysis with MP results [33].
A considerable divergence between GM functional potential and activity was also observed in the present study. Multiple data analysis approaches consistently revealed that the GM protein expression pattern differs significantly from that of the gene potential, both in terms of feature abundance distribution and inter-individual variability. Since the very beginning of GM research, there was evidence for similarity among indi-viduals in MG functional profiles and metabolic pathway gene modules, despite variation in community structure [2], while, in a pioneering study, VerBerkmoes and coworkers described a more uneven distribution of func-tional categories in the human stool metaproteome com-pared to a (non-matched) metagenome [5]. Similar conclusions were drawn by Franzosa et al. when com-paring human gut metatranscriptome and metagenome [7], even if the correlation between MT and MG func-tional datasets was much higher than that measured between MP and MG in this study, in line with recent reports [6]. The higher inter-individual variability in GM protein functions compared to the corresponding gene functions (even considering that the GM taxonomic structure exhibited an opposite behavior) confirms that the metaproteome displays a higher plasticity, being thus a preferential indicator of functional changes in the GM when compared to MG approaches. Concerning this divergence between MG and MP data, it is worth noting that some possible variables might influence the consen-sus between the two omic approaches. Among them, the possible impact of differences in genome size among microbial species should not be overlooked [34], as well as the influence of potentially varying redundancy levels among functionally relevant genes [35]. The different (See figure on previous page.)
Fig. 6Active carbohydrate metabolism pathways and related taxonomic assignments.aSchematic overview of gut microbiota metabolic pathways from carbohydrate uptake and degradation to the production of short-chain fatty acids (inbold).Numbers in boldcorrespond to the metabolic pathways listed inb.GHglycosyl hydrolase.bCombination of carbohydrate metabolism pathways/enzymes (rows) and specific gut microbiota phyla/genera (columns) found by MP analysis. Heatmap color scale is based on the logarithmized relative abundance (average of 15 subjects) of each function-taxon combination. For each pathway (rows), only enzymes detected in at least half of the subjects are reported, while thetop row(inbold, corresponding toblack-bordered squares) accounts for the total abundance of all enzymes (found in at least one subject) belonging to the pathway. For each phylum (columns), only genera expressing a function in at least two subjects are reported, and the phylum column (inbold, corresponding toblack-bordered squares) accounts for the total abundance of all functions assigned to that given phylum. “Carbohydrate metabolism”and“microbiota”report the total of rows and columns, respectively.GHglycosyl hydrolase,ABCATP-binding cassette,
MsmKmultiple sugar-binding transport ATP-binding protein MsmK,MsmXmaltodextrin import ATP-binding protein MsmX,UgpC sn-glycerol-3-phos-phate import ATP-binding protein UgpC,YcjVuncharacterized ABC transporter ATP-binding protein YcjV,YtfQABC transporter periplasmic-binding protein YtfQ,YurJuncharacterized ABC transporter ATP-binding protein YurJ,DKI4-deoxy-L-threo-5-hexosulose-uronate ketol,Ru5Pribose-5-phosphate,
information depths which can be reached by MP and MG (at least with the currently available technological and bioinformatic approaches) should also be considered as a factor that might lead to a lower quantitative correl-ation between the two datasets [6]. As a further consid-eration, it is worth observing that MG keeps the ability of providing the full functional history of bacteria travel-ling the gut, whereas MP allows the investigator to take a picture of the GM activity at a given time point, loca-tion, or condition; this undoubtedly makes these two approaches complementary when attempting to fully characterize the GM functionality.
When comparing the most abundant protein functions observed in this study with earlier MP investigations of healthy human GMs [33, 36], a general consistency could be found. In particular, glutamate dehydrogenase was the most abundant protein function revealed in this study, as previously reported by Kolmeder and coworkers [33, 37]. Bacterial glutamate dehydrogenase plays a pivotal role in the intermediary metabolism in bacteria as well as in animals, providing a major biosynthetic pathway for glutamate production. Glutamate, in turn, is key as a link between carbon and nitrogen metabolism and has been recently shown to be important for Clostridium difficile
colonization of human gut [38]. Hence, given the abun-dance of glutamate dehydrogenase, its impact might be relevant for colonization and survival of many other taxa that inhabit the human intestine. Finally, the glutamate circuit has been proposed as central to the neuro-endocrinological role of gut microbiota, the signaling to the CNS through the intestinal epithelial cell glutamate receptors, and the activation of the vagal route [39]. Other abundant functions, which were included among the top functional categories in previous studies [5, 33], are glyceraldehyde 3-phosphate dehydrogenase, phosphoenol-pyruvate carboxykinase, acetyl-CoA C-acetyltransferase, enolase, and many other enzymes responsible for essential steps of glycolysis and butyrogenesis, supporting the hypothesis that these functions and pathways are key for the intestinal homeostasis. In particular, the massive and stable expression of butyrate biosynthesis enzymes by Firmicutes (mainly Faecalibacterium) deserves key atten-tion. Butyrate is a four-carbon SCFA known as one of the main products of microbial fermentation in the human colon and serves as preferential energy source for colono-cytes [40]. Growing experimental evidences support the importance of butyrate for colon health, for instance highlighting the relationship between defects in butyrate production and pathogenesis or severity of inflammatory bowel diseases and obesity-related metabolic diseases [41–43]. Our results demonstrate a high and constant butyrogenetic activity within a healthy human cohort, in line with previous reports showing a higher abundance of butyrate biosynthetic enzymes compared to those involved
in propionate biosynthesis in a healthy cohort [33], thus further supporting GM butyrate production as a key requirement for intestinal health. Further, we observed an apparent pivotal role of Faecalibacterium spp. in synthe-sizing the enzymes involved in this metabolic pathway. It needs to be noted, however, that enzyme abundance may not be directly correlated to metabolite concentrations, as metabolic fluxes are strongly influenced by enzyme kinetics and substrate availabilities [44]. Future meta-metabolomic investigations are therefore expected to shed further light on these key aspects and their impact on GM metabolism.
In addition, elongation factor (EF)-Tu and chaperonin GroES were the second and the fifth most abundant functions observed in this study. EF-Tu is known for a long time to be among the most abundant proteins in many bacterial species, and, therefore, its highest abun-dance was not unexpected. GroES, together with GroEL, is also known to be abundantly present in bacteria, where it serves for proper folding of many proteins, particularly when large loads of deleterious mutations occur. Bacterial chaperonin overexpression is hypothe-sized to be required when bacterial communities evolve under a strong genetic drift [45]. According to the eco-logical model proposed by Schloissnig and colleagues, this is the case of the human gut microbiome, where a large selection of bacterial population members is sub-jected to community shifts during the different stage of the individual host life, and, therefore, their extinction might be rescued in the presence of abundant chaperonins [46].
Carbohydrate metabolism was proved in earlier works as the most represented COG category in the human gut metaproteome, highlighting its functional relevance in the host-microbiota interplay [5, 33]. In this respect, the thorough reconstruction of the GM carbohydrate metabolism pathways presented here, including the active contribution to it of the main GM taxa, provides useful insights into the catabolism and cross-feeding net-works actually occurring in a healthy human GM. There is evidence that both generalist (able to degrade a wide range of carbohydrates) and specialist (able to target only a few selected glycans) members of the GM belong to metabolic networks where cross-feeding takes place, since by-products of one microorganism can serve as key metabolic resources for other GM members [47]. The activity of sugar-converting enzymes deserves special attention in this respect. L-fucose isomerase was described as expressed at high levels in the GM of healthy individuals in two earlier studies [5, 33]; further-more, both L-arabinose and uronate metabolism were found to be particularly active in one of these previously analyzed human cohorts [33]. Here, we were also able to assign these metabolic functions to the main microbial
taxa actively expressing them, showing a general active involvement of Faecalibacterium, Bacteroides, and
Prevotella(at different extents) both in the aldose/ketose interconversion and in the uronate pathway, and pecu-liar (and possibly interrelated) roles of other genera in specific enzymatic activities (e.g., isomerization ofL -ara-binose and xylose for Bifidobacterium, L-fucose and xylose for Ruminococcus). It is also worth noting that enzymes involved in methanogenesis and sulfate reduc-tion were detected at much lower abundance when com-pared to GMs from other human cohorts [7], or even from different hosts, such as murine models [19], highlighting the impact of genetics, diet, and gut anat-omy on the GM structure and metabolic functions, which can be captured and quantified by means of (multi-)meta-omic approaches.
The choice of a proper sequence database is a key issue in MP, as it might have a strong influence both on identification and annotation yields [48–50]. Recently, we observed that the use of experimental MG sequences as MP databases can be useful when dealing with human samples, and that employing population-based databases (i.e., combining all MG sequences from the population under study) provides better results than sample-matched databases [21]. In keeping with these indica-tions, a population-based database, containing all MG read sequences retrieved from the same cohort under study, was used in this work, with the aim of measuring the protein expression rate of a given metagenome. We decided not to apply any sequence assembly strategy to the reads, although this has been found as beneficial for functional annotation efficiency and would have led to a slight increase in peptide identifications (data not shown), as it would have dramatically reduced the dynamic range of MG counts, unless using really com-plex and computationally demanding co-assembly strat-egies [6]. Concerning functional annotation, we adopted the same strategy recently applied on human and mouse GM datasets upon critical evaluations [21]. We acknow-ledge that the global functional annotation yield of MG reads presented here is rather low, although the presence of a considerable amount of unknown and poorly anno-tated functions is a known issue in metaproteomics. Concerning taxonomic classification, the global annota-tion yield was satisfactory, although a non-negligible portion of functional families, having a high level of sequence homology within related taxa, could only be mapped to a specific phylum, but not to lower levels (e.g., genus). This appears to be likely due to intrinsic limitations of both shotgun mass spectrometry (being the length of tryptic peptides quite limited) and the low-est common anclow-estor approach used for annotation (which is not able to discriminate among closely related
orthologs). Improved taxonomic and functional
annotation yields might be expected using different se-quencing platforms allowing for the generation of longer reads, as well as employing novel and better performing annotation tools and databases which are hopefully go-ing to be released in the near future. Finally, we cannot also ignore a possible impact of technical variability on the results (although Illumina sequencing protocols, as well as the shotgun MP pipeline used [19], are estab-lished and fairly reproducible), and the use of read and spectral counts as quantitative measure of abundance should be recognized as an estimation, although quite robust and widely used [51, 52], rather than an actual quantification.
Conclusions
We found that a considerable divergence exists between functional potential and expression in the GM of a healthy human cohort. Furthermore, our results give insights into the understanding of active functions and metabolic tasks of a“normal”GM, highlighting the over-all key importance of butyrate production. A detailed picture is also provided about the specific contribution of GM taxa to the main functional activities, focusing on carbohydrate metabolism. Our data suggest that caution should be used before drawing conclusions on the actual GM functional activity based on metagenomic data, and support MP as a valuable approach to investigate the functional role of the GM in health and disease.
Methods
Samples
extraction for MG analysis and the second underwent pro-tein extraction for MP analysis.
DNA sample preparation and metagenome sequencing
DNA extraction was undertaken using the QIAamp DNA Stool Mini Kit (Qiagen, Hilden, Germany), according to the manufacturer’s protocol.
Libraries were constructed according to the Nextera XT kit (average insert size ~700 bps) and sequenced with the HiScanSQ sequencer (both from Illumina, San Diego, CA, USA), using the paired-end method and 93 cycles of sequencing.
Metagenome bioinformatics
Merging and filtering of paired reads were carried out using tools from the USEARCH suite v.8.1.1861 [53, 54] as described previously [21]. The mean length of the paired-end merged reads was 134 bps. Since sequencing depth may affect estimation of the relative abundances of gene categories, filtered reads were subjected to ran-dom subsampling using the fastx_subsample command (sample_size 200000). A subsequent evaluation of the taxonomic and functional information depth revealed that 96% of taxa and 98% of KEGG functions with rela-tive abundance >0.01% in the non-subsampled dataset were maintained upon subsampling. Taxonomic annota-tion was performed using MEGAN v.5.11.3 [55]. Read sequences were preliminary subjected to DIAMOND (v.0.7.1) search against the NCBI-nr DB (2016/03 update), using the blastx command with default parameters [56]. Then, DIAMOND results were parsed using MEGAN to perform lowest common ancestor classification according to default parameters.
Functional annotation was carried out through a DIA-MOND blastx search (top hit and e-value threshold 10−5) against bacterial sequences from the UniProt/Swiss-Prot database (release 2015_12), followed by retrieval of KEGG orthologous group information associated with each UniProt/Swiss-Prot accession number [57].
The relative abundance of a taxon/function in a sub-ject was calculated by summing the number of reads assigned to that taxon/function and then by dividing the taxon/function read count by the total read count of the subject. Only taxa and functions with a relative abun-dance higher than 0.01% were considered for subsequent differential analysis.
Protein sample preparation and mass spectrometry analysis
Samples were resuspended by vortexing in an SDS-based extraction buffer, heated, and then subjected to a combination of bead-beating and freeze-thawing steps, as illustrated elsewhere [19]. Protein extracts were re-duced, alkylated, and digested on-filter according to the
filter-aided sample preparation (FASP) protocol [58], with slight modifications reported earlier [59].
An LTQ-Orbitrap Velos mass spectrometer (Thermo Scientific, San Jose, CA, USA) interfaced with an UltiMate 3000 RSLCnano LC system (Thermo Scientific) was used for LC-MS/MS analysis. Peptide separation by LC was carried out as previously described [19], while the mass spectrometer was set up in a data-dependent MS/MS mode with HCD as fragmentation method, as detailed elsewhere [59].
Metaproteome bioinformatics
Peptide identification was performed using Proteome Discoverer (version 1.4; Thermo Scientific), with Sequest-HT as search engine and Percolator for peptide validation (FDR <1%). Search parameters were set as described previously [60], while the sequence database was composed of the open reading frames (ORFs) found using FragGeneScan (v.1.19, with the training for Illumina sequencing reads with about 0.5% error rate) [61] starting from the MG reads obtained in this study, upon clustering at 100% using the dedicated USEARCH tool (25,328,860 sequences in total).
All ORFs matched with at least an MS spectrum upon database searching (average length 42 amino acids) were subjected to taxonomic and functional classification, following the same procedure described above for the whole metagenome sequences (“Metagenome bioinfor-matics” section), except using the DIAMOND blastp command instead of blastx.
The relative abundance of a taxon/function in a subject was calculated by summing the number of MS spectral counts matched to all ORFs assigned to that taxon/func-tion and then by dividing the taxon/functaxon/func-tion count by the total MS spectral counts for all taxa/functions detected in that subject (so that the sum of the abundances of all taxa/functions detected in each subject is 1). Only taxa and functions with a relative abundance higher than 0.01% were considered for subsequent differential analysis.
Statistical analysis and graph generation
Bray-Curtis dissimilarity values were computed using the R package “vegan.” The Wilcoxon signed-rank test (R package “stats”) was applied with continuity correc-tion to compare Bray-Curtis dissimilarity values between MG and MP. The extent of differential abundance of each feature between two groups (MG versus MP or Firmicutes versus Bacteroidetes) was calculated for each subject and expressed as a relative abundance log ratio, using a correction factor (CF = 10−5) to eliminate discon-tinuity due to missing values. The global log ratio was intended as the mean of the log ratios calculated for each subject. The sets of log ratios were further tested for sig-nificant deviation from zero using the one-sample ttest,
and an FDR correction was performed on the nominal two-tailed P values following the Benjamini-Hochberg method (α= 0.05), as reported previously [7], using the SGoF+ tool v.3.8 [62].
PCA plots and heatmaps were generated using ClustVis (http://biit.cs.ut.ee/clustvis) [63], boxplots were created using BoxPlotR (http://shiny.chemgrid.org/boxplotr) [64], GraphPad Prism (v.5.03) was employed for bar graph gen-eration, and cladograms were produced using GraPhlAn [65] and edited using Inkscape (https://inkscape.org). KEGG pathway maps [66] were customized by uploading KO numbers through the “user data mapping” function on the KEGG website (http://www.kegg.jp).
Additional files
Additional file 1: Table S1.Gender, age, and BMI of the human subjects selected for the study.Table S2.Metrics of metagenome and metaproteome analysis.Table S3.Taxonomic and functional annotation yields.Table S4.Percentage of taxa and functions with differential abundance between the human gut metagenomes and metaproteomes analyzed in this study.Table S5.Percentage distribution of conserved and variable features within the human gut metagenomes and metaproteomes analyzed in this study. (DOCX 35 kb)
Additional file 2: Figure S1.Principal component analysis plots related to taxonomic and functional features. MG data are in blue, while MP data are in red. Each dot (with different shape) represents a different human subject. (A) phyla; (B) genera; (C) KOGs; (D) KOG-phylum combinations. (PNG 2001 kb)
Additional file 3: Dataset S1.Abundance and differential data (MG versus MP) at phylum, class, order, family, genus, KOG, KOG/phylum, and KOG/genus level. (XLSX 3588 kb)
Additional file 4: Figure S2.Metabolic functions with differential abundance between MP and MG datasets mapped in the KEGG carbon metabolism pathway. Red arrows indicate enzymes with significantly higher abundance in the MP dataset, while blue arrows indicate enzymes with significantly higher abundance in the MG dataset. (PNG 76 kb)
Additional file 5: Dataset S2.Relative abundance and differential analysis outputs concerning Firmicutes and Bacteroidetes KOGs, according to MG and MP data. (XLSX 101 kb)
Additional file 6: Figure S3.Metabolic functions with differential abundance between Firmicutes and Bacteroidetes according to the MG dataset, mapped in the KEGG carbon metabolism pathway. Purple arrows indicate genes with significantly higher abundance in Firmicutes, orange arrows indicate genes with significantly higher abundance in
Bacteroidetes, and gray arrows indicate genes detected in one or both phyla but with no differential abundance. (PNG 37 kb)
Additional file 7: Figure S4.Metabolic functions with differential abundance between Firmicutes and Bacteroidetes according to the MP dataset, mapped in the KEGG carbon metabolism pathway. Purple arrows indicate proteins with significantly higher abundance in Firmicutes, orange arrows indicate proteins with significantly higher abundance in Bacteroidetes, and gray arrows indicate proteins detected in one or both phyla but with no differential abundance. (PNG 38 kb)
Abbreviations
BMI:Body mass index; CV: Coefficient of variation; F/B ratio: Firmicutes/ Bacteroidetes ratio; FASP: Filter-aided sample preparation; GM: Gut microbiota; KOG: KEGG orthologous group; MG: Metagenomics; MP: Metaproteomics; MT: Metatranscriptomics; PSM: Peptide-spectrum match; SCFA: Short-chain fatty acid
Acknowledgements
Not applicable.
Funding
This study was financed by Sardegna Ricerche, program“ex art. 26 LR 37/98 - 2014.”M.A. and V.M. were supported by Doctoral Fellowships from the International PhD Course in Life Sciences and Biotechnologies, University of Sassari. The SardiNIA study was supported by the Intramural Research Program of the National Institute on Aging, NIH, with contracts N01-AG-1-2109 and HHSN271201100005C; the FaReBio2011“Farmaci e Reti Biotecnologiche di Qualità”; the Fondazione di Sardegna (ex Fondazione Banco di Sardegna, Prot. U1301.2015/AI.1157.BE Prat. 2015-1651); and MIUR/CNR funds for rare diseases and molecular screening to F.C.
Availability of data and materials
Metagenomic sequence data have been deposited in the European Nucleotide Archive under the project accession number PRJEB19090.
Mass spectrometry proteomics data have been deposited to the
ProteomeXchange Consortium via the PRIDE [67] partner repository with the dataset identifier PXD005780.
Authors’contributions
AT conceived the study, performed metaproteomics sample preparation and data analysis, supervised global data analysis and interpretation, and wrote the manuscript. MA performed the shotgun metagenomics data analysis and critically revised the manuscript. AP performed the metaproteomics sample preparation and mass spectrometry analysis. VM and CF performed the metagenomic experiments. FC and EF carried out the subject selection from the SardiNIA cohort, collected stool samples and critically revised the manuscript. SU conceived the study, contributed to the data interpretation, and wrote the manuscript. All authors read and approved the final version of the manuscript.
Ethics approval and consent to participate
The subjects gave their informed consent for using the biological material for research purposes, and the study was approved by the Ethic Committee of the University of Sassari, Italy (authorization no. 2023).
Consent for publication
Not applicable.
Competing interests
The authors declare that they have no competing interests.
Publisher’s Note
Springer Nature remains neutral with regard to jurisdictional claims in published maps and institutional affiliations.
Author details
1Porto Conte Ricerche, Science and Technology Park of Sardinia, S.P. 55 Porto
Conte - Capo Caccia km 8,400, Località Tramariglio, 07041 Alghero, SS, Italy. 2Department of Biomedical Sciences, University of Sassari, Sassari, Italy. 3
Istituto di Ricerca Genetica e Biomedica, Consiglio Nazionale delle Ricerche (CNR), Monserrato, Cagliari, Italy.
Received: 21 February 2017 Accepted: 28 June 2017
References
1. Morgan XC, Huttenhower C. Chapter 12: human microbiome analysis. PLoS Comput Biol. 2012;8, e1002808.
2. Human Microbiome Project Consortium. Structure, function and diversity of the healthy human microbiome. Nature. 2012;486:207–14.
3. Song HS, Renslow RS, Fredrickson JK, Lindemann SR. Integrating ecological and engineering concepts of resilience in microbial communities. Front Microbiol. 2015;6:1298.
5. VerBerkmoes NC, Russell AL, Shah M, Godzik A, Rosenquist M, Halfvarson J, Lefsrud MG, Apajalahti J, Tysk C, Hettich RL, Jansson JK. Shotgun metaproteomics of the human distal gut microbiota. ISME J. 2009;3:179–89. 6. Heintz-Buschart A, May P, Laczny CC, Lebrun LA, Bellora C, Krishna A,
Wampach L, Schneider JG, Hogan A, de Beaufort C, Wilmes P. Integrated multi-omics of the human gut microbiome in a case study of familial type 1 diabetes. Nat Microbiol. 2016;2:16180.
7. Franzosa EA, Morgan XC, Segata N, Waldron L, Reyes J, Earl AM, Giannoukos G, Boylan MR, Ciulla D, Gevers D, et al. Relating the metatranscriptome and metagenome of the human gut. Proc Natl Acad Sci U S A. 2014;111:E2329–38. 8. Erickson AR, Cantarel BL, Lamendella R, Darzi Y, Mongodin EF, Pan C, Shah
M, Halfvarson J, Tysk C, Henrissat B, et al. Integrated metagenomics/ metaproteomics reveals human host-microbiota signatures of Crohn’s disease. PLoS One. 2012;7, e49138.
9. Pilia G, Chen WM, Scuteri A, Orru M, Albai G, Dei M, Lai S, Usala G, Lai M, Loi P, et al. Heritability of cardiovascular and personality traits in 6,148 Sardinians. PLoS Genet. 2006;2, e132.
10. Zoetendal EG, von Wright A, Vilpponen-Salmela T, Ben-Amor K, Akkermans AD, de Vos WM. Mucosa-associated bacteria in the human gastrointestinal tract are uniformly distributed along the colon and differ from the community recovered from feces. Appl Environ Microbiol. 2002;68:3401–7. 11. Tanca A, Manghina V, Fraumene C, Palomba A, Abbondio M, Deligios M,
Silverman M, Uzzau S. Metaproteogenomics reveals taxonomic and functional changes between cecal and fecal microbiota in mouse. Front Microbiol. 2017;8:391.
12. Falony G, Joossens M, Vieira-Silva S, Wang J, Darzi Y, Faust K, Kurilshikov A, Bonder MJ, Valles-Colomer M, Vandeputte D, et al. Population-level analysis of gut microbiome variation. Science. 2016;352:560–4.
13. Zhernakova A, Kurilshikov A, Bonder MJ, Tigchelaar EF, Schirmer M, Vatanen T, Mujagic Z, Vila AV, Falony G, Vieira-Silva S, et al. Population-based metagenomics analysis reveals markers for gut microbiome composition and diversity. Science. 2016;352:565–9.
14. Goodrich JK, Waters JL, Poole AC, Sutter JL, Koren O, Blekhman R, Beaumont M, Van Treuren W, Knight R, Bell JT, et al. Human genetics shape the gut microbiome. Cell. 2014;159:789–99.
15. Sidore C, Busonero F, Maschio A, Porcu E, Naitza S, Zoledziewska M, Mulas A, Pistis G, Steri M, Danjou F, et al. Genome sequencing elucidates Sardinian genetic architecture and augments association analyses for lipid and blood inflammatory markers. Nat Genet. 2015;47:1272–81.
16. Rampelli S, Schnorr SL, Consolandi C, Turroni S, Severgnini M, Peano C, Brigidi P, Crittenden AN, Henry AG, Candela M. Metagenome sequencing of the Hadza hunter-gatherer gut microbiota. Curr Biol. 2015;25:1682–93. 17. Shankar V, Gouda M, Moncivaiz J, Gordon A, Reo NV, Hussein L, Paliy O.
Differences in gut metabolites and microbial composition and functions between Egyptian and U.S. children are consistent with their diets. mSystems. 2017;2:e00169–16.
18. Gerasimidis K, Bertz M, Quince C, Brunner K, Bruce A, Combet E, Calus S, Loman N, Ijaz UZ. The effect of DNA extraction methodology on gut microbiota research applications. BMC Res Notes. 2016;9:365. 19. Tanca A, Palomba A, Pisanu S, Deligios M, Fraumene C, Manghina V,
Pagnozzi D, Addis MF, Uzzau S. A straightforward and efficient analytical pipeline for metaproteome characterization. Microbiome. 2014;2:49. 20. Jones MB, Highlander SK, Anderson EL, Li W, Dayrit M, Klitgord N, Fabani
MM, Seguritan V, Green J, Pride DT, et al. Library preparation methodology can influence genomic and functional predictions in human microbiome research. Proc Natl Acad Sci U S A. 2015;112:14024–9.
21. Tanca A, Palomba A, Fraumene C, Pagnozzi D, Manghina V, Deligios M, Muth T, Rapp E, Martens L, Addis MF, Uzzau S. The impact of sequence database choice on metaproteomic results in gut microbiota studies. Microbiome. 2016;4:51.
22. Roopchand DE, Carmody RN, Kuhn P, Moskal K, Rojas-Silva P, Turnbaugh PJ, Raskin I. Dietary polyphenols promote growth of the gut bacterium
Akkermansia muciniphilaand attenuate high-fat diet-induced metabolic syndrome. Diabetes. 2015;64:2847–58.
23. Zhang Z, Wu X, Cao S, Wang L, Wang D, Yang H, Feng Y, Wang S, Li L. Caffeic acid ameliorates colitis in association with increasedAkkermansia
population in the gut microbiota of mice. Oncotarget. 2016;7:31790–9. 24. Dao MC, Everard A, Aron-Wisnewsky J, Sokolovska N, Prifti E, Verger EO, Kayser
BD, Levenez F, Chilloux J, Hoyles L, et al.Akkermansia muciniphilaand improved metabolic health during a dietary intervention in obesity: relationship with gut microbiome richness and ecology. Gut. 2016;65:426–36.
25. Leal-Diaz AM, Noriega LG, Torre-Villalvazo I, Torres N, Aleman-Escondrillas G, Lopez-Romero P, Sanchez-Tapia M, Aguilar-Lopez M, Furuzawa-Carballeda J, Velazquez-Villegas LA, et al. Aguamiel concentrate fromAgave salmianaand its extracted saponins attenuated obesity and hepatic steatosis and increasedAkkermansia muciniphilain C57BL6 mice. Sci Rep. 2016;6:34242. 26. Kovatcheva-Datchary P, Nilsson A, Akrami R, Lee YS, De Vadder F, Arora T, Hallen A, Martens E, Bjorck I, Backhed F. Dietary fiber-induced improvement in glucose metabolism is associated with increased abundance ofPrevotella. Cell Metab. 2015;22:971–82.
27. De Vadder F, Kovatcheva-Datchary P, Zitoun C, Duchampt A, Backhed F, Mithieux G. Microbiota-produced succinate improves glucose homeostasis via intestinal gluconeogenesis. Cell Metab. 2016;24:151–7.
28. Pedersen HK, Gudmundsdottir V, Nielsen HB, Hyotylainen T, Nielsen T, Jensen BA, Forslund K, Hildebrand F, Prifti E, Falony G, et al. Human gut microbes impact host serum metabolome and insulin sensitivity. Nature. 2016;535:376–81.
29. Tojo R, Suarez A, Clemente MG, de los Reyes-Gavilan CG, Margolles A, Gueimonde M, Ruas-Madiedo P. Intestinal microbiota in health and disease: role of bifidobacteria in gut homeostasis. World J Gastroenterol. 2014;20:15163–76. 30. O'Callaghan A, van Sinderen D. Bifidobacteria and their role as members of
the human gut microbiota. Front Microbiol. 2016;7:925. 31. Battistoni A. Role of prokaryotic Cu, Zn superoxide dismutase in
pathogenesis. Biochem Soc Trans. 2003;31:1326–9.
32. Youseff BH, Holbrook ED, Smolnycki KA, Rappleye CA. Extracellular superoxide dismutase protectsHistoplasmayeast cells from host-derived oxidative stress. PLoS Pathog. 2012;8, e1002713.
33. Kolmeder CA, Salojarvi J, Ritari J, de Been M, Raes J, Falony G, Vieira-Silva S, Kekkonen RA, Corthals GL, Palva A, et al. Faecal metaproteomic analysis reveals a personalized and stable functional microbiome and limited effects of a probiotic intervention in adults. PLoS One. 2016;11, e0153294. 34. Nayfach S, Pollard KS. Average genome size estimation improves
comparative metagenomics and sheds light on the functional ecology of the human microbiome. Genome Biol. 2015;16:51.
35. Dopheide A, Lear G, He Z, Zhou J, Lewis GD. Functional gene composition, diversity and redundancy in microbial stream biofilm communities. PLoS One. 2015;10, e0123179.
36. VerBerkmoes NC, Denef VJ, Hettich RL, Banfield JF. Functional analysis of natural microbial consortia using community proteomics. Nat Rev Microbiol. 2009;7:196–205.
37. Kolmeder CA, de Been M, Nikkilä J, Ritamo I, Mättö J, Valmu L, Salojärvi J, Palva A, Salonen A, de Vos WM. Comparative metaproteomics and diversity analysis of human intestinal microbiota testifies for its temporal stability and expression of core functions. PLoS One. 2012;7, e29913.
38. Girinathan BP, Braun S, Sirigireddy AR, Lopez JE, Govind R. Importance of glutamate dehydrogenase (GDH) inClostridium difficilecolonization in vivo. PLoS One. 2016;11, e0160107.
39. Mazzoli R, Pessione E. The neuro-endocrinological role of microbial glutamate and GABA signaling. Front Microbiol. 2016;7:1934.
40. Leonel AJ, Alvarez-Leite JI. Butyrate: implications for intestinal function. Curr Opin Clin Nutr Metab Care. 2012;15:474–9.
41. Machiels K, Joossens M, Sabino J, De Preter V, Arijs I, Eeckhaut V, Ballet V, Claes K, Van Immerseel F, Verbeke K, et al. A decrease of the butyrate-producing speciesRoseburia hominisandFaecalibacterium prausnitziidefines dysbiosis in patients with ulcerative colitis. Gut. 2014;63:1275–83.
42. Takahashi K, Nishida A, Fujimoto T, Fujii M, Shioya M, Imaeda H, Inatomi O, Bamba S, Sugimoto M, Andoh A. Reduced abundance of butyrate-producing bacteria species in the fecal microbial community in Crohn’s disease. Digestion. 2016;93:59–65.
43. Brahe LK, Astrup A, Larsen LH. Is butyrate the link between diet, intestinal microbiota and obesity-related metabolic diseases? Obes Rev. 2013;14:950–9. 44. Fernie AR, Stitt M. On the discordance of metabolomics with proteomics
and transcriptomics: coping with increasing complexity in logic, chemistry, and network interactions scientific correspondence. Plant Physiol. 2012;158: 1139–45.
45. Sabater-Munoz B, Prats-Escriche M, Montagud-Martinez R, Lopez-Cerdan A, Toft C, Aguilar-Rodriguez J, Wagner A, Fares MA. Fitness trade-offs determine the role of the molecular chaperonin GroEL in buffering mutations. Mol Biol Evol. 2015;32:2681–93.
46. Schloissnig S, Arumugam M, Sunagawa S, Mitreva M, Tap J, Zhu A, Waller A, Mende DR, Kultima JR, Martin J, et al. Genomic variation landscape of the human gut microbiome. Nature. 2013;493:45–50.
47. Cockburn DW, Koropatkin NM. Polysaccharide degradation by the intestinal microbiota and its influence on human health and disease. J Mol Biol. 2016;428:3230–52.
48. Cantarel BL, Erickson AR, VerBerkmoes NC, Erickson BK, Carey PA, Pan C, Shah M, Mongodin EF, Jansson JK, Fraser-Liggett CM, Hettich RL. Strategies for metagenomic-guided whole-community proteomics of complex microbial environments. PLoS One. 2011;6, e27173.
49. Tanca A, Palomba A, Deligios M, Cubeddu T, Fraumene C, Biosa G, Pagnozzi D, Addis MF, Uzzau S. Evaluating the impact of different sequence databases on metaproteome analysis: insights from a lab-assembled microbial mixture. PLoS One. 2013;8, e82981.
50. Muth T, Renard BY, Martens L. Metaproteomic data analysis at a glance: advances in computational microbial community proteomics. Expert Rev Proteomics. 2016;13:757–69.
51. Nayfach S, Pollard KS. Toward accurate and quantitative comparative metagenomics. Cell. 2016;166:1103–16.
52. Neilson KA, Ali NA, Muralidharan S, Mirzaei M, Mariani M, Assadourian G, Lee A, van Sluyter SC, Haynes PA. Less label, more free: approaches in label-free quantitative mass spectrometry. Proteomics. 2011;11:535–53.
53. Edgar RC. Search and clustering orders of magnitude faster than BLAST. Bioinformatics. 2010;26:2460–1.
54. Edgar RC, Flyvbjerg H. Error filtering, pair assembly and error correction for next-generation sequencing reads. Bioinformatics. 2015;31:3476–82. 55. Huson DH, Weber N. Microbial community analysis using MEGAN. Methods
Enzymol. 2013;531:465–85.
56. Buchfink B, Xie C, Huson DH. Fast and sensitive protein alignment using DIAMOND. Nat Methods. 2015;12:59–60.
57. UniProtConsortium. UniProt: a hub for protein information. Nucleic Acids Res. 2015;43:D204–12.
58. Wisniewski JR, Zougman A, Nagaraj N, Mann M. Universal sample preparation method for proteome analysis. Nat Methods. 2009;6:359–62. 59. Tanca A, Biosa G, Pagnozzi D, Addis MF, Uzzau S. Comparison of
detergent-based sample preparation workflows for LTQ-Orbitrap analysis of the
Escherichia coliproteome. Proteomics. 2013;13:2597–607.
60. Tanca A, Palomba A, Pisanu S, Addis MF, Uzzau S. Enrichment or depletion? The impact of stool pretreatment on metaproteomic characterization of the human gut microbiota. Proteomics. 2015;15:3474–85.
61. Rho M, Tang H, Ye Y. FragGeneScan: predicting genes in short and error-prone reads. Nucleic Acids Res. 2010;38, e191.
62. Carvajal-Rodriguez A, de Una-Alvarez J. Assessing significance in high-throughput experiments by sequential goodness of fit andq-value estimation. PLoS One. 2011;6, e24700.
63. Metsalu T, Vilo J. ClustVis: a web tool for visualizing clustering of multivariate data using principal component analysis and heatmap. Nucleic Acids Res. 2015;43:W566–70.
64. Spitzer M, Wildenhain J, Rappsilber J, Tyers M. BoxPlotR: a web tool for generation of box plots. Nat Methods. 2014;11:121–2.
65. Asnicar F, Weingart G, Tickle TL, Huttenhower C, Segata N. Compact graphical representation of phylogenetic data and metadata with GraPhlAn. PeerJ. 2015;3, e1029.
66. Kanehisa M, Sato Y, Kawashima M, Furumichi M, Tanabe M. KEGG as a reference resource for gene and protein annotation. Nucleic Acids Res. 2016;44:D457–62.
67. Vizcaino JA, Csordas A, Del-Toro N, Dianes JA, Griss J, Lavidas I, Mayer G, Perez-Riverol Y, Reisinger F, Ternent T, et al. 2016 update of the PRIDE database and its related tools. Nucleic Acids Res. 2016;2016(44):D447–56.
• We accept pre-submission inquiries
• Our selector tool helps you to find the most relevant journal
• We provide round the clock customer support
• Convenient online submission
• Thorough peer review
• Inclusion in PubMed and all major indexing services
• Maximum visibility for your research
Submit your manuscript at www.biomedcentral.com/submit