R E S E A R C H
Open Access
Auditory repetition suppression alterations
in relation to cognitive functioning in
fragile X syndrome: a combined EEG
and machine learning approach
Inga Sophia Knoth
1,2*, Tarek Lajnef
3,4, Simon Rigoulot
1,2,3,4,5, Karine Lacourse
2, Phetsamone Vannasing
2,
Jacques L. Michaud
2,6, Sébastien Jacquemont
2, Philippe Major
2, Karim Jerbi
3,4,5,7,8and Sarah Lippé
1,2,3,4,5Abstract
Background:Fragile X syndrome (FXS) is a neurodevelopmental genetic disorder causing cognitive and behavioural deficits. Repetition suppression (RS), a learning phenomenon in which stimulus repetitions result in diminished brain activity, has been found to be impaired in FXS. Alterations in RS have been associated with behavioural problems in FXS; however, relations between RS and intellectual functioning have not yet been elucidated.
Methods:EEG was recorded in 14 FXS participants and 25 neurotypical controls during an auditory habituation paradigm using repeatedly presented pseudowords. Non-phased locked signal energy was compared across presentations and between groups using linear mixed models (LMMs) in order to investigate RS effects across repetitions and brain areas and a possible relation to non-verbal IQ (NVIQ) in FXS. In addition, we explored group differences according to NVIQ and we probed the feasibility of training a support vector machine to predict cognitive functioning levels across FXS participants based on single-trial RS features.
Results:LMM analyses showed that repetition effects differ between groups (FXS vs. controls) as well as with respect to NVIQ in FXS. When exploring group differences in RS patterns, we found that neurotypical controls revealed the expected pattern of RS between the first and second presentations of a pseudoword. More importantly, while FXS participants in the ≤42 NVIQ group showed no RS, the > 42 NVIQ group showed a delayed RS response after several presentations.
Concordantly, single-trial estimates of repetition effects over the first four repetitions provided the highest decoding accuracies in the classification between the FXS participant groups.
Conclusion:Electrophysiological measures of repetition effects provide a non-invasive and unbiased measure of brain responses sensitive to cognitive functioning levels, which may be useful for clinical trials in FXS.
Keywords:Fragile X syndrome, Intellectual disability, EEG, Repetition suppression, Machine learning, Habituation, IQ, Cognition
Background
Fragile X Syndrome (FXS) is a neurodevelopmental genetic disorder, which causes cognitive and behavioural deficits. FXS is caused by a mutation of theFMR1(‘fragile X mental retardation 1’) gene located on the X chromosome [1] that
prevents expression of the fragile X mental retardation protein (FMRP) [2]. The majority of individuals affected by FXS have an intellectual disability (ID), ranging from mild to severe in males and from mild to moderate in females [3]. Cognitive impairments are often found in language, executive functions and visuo-spatial and social-cognitive domains [4]. Particular impairments are found in auditory working memory span and working memory for words [5]. Many of the symptoms found in FXS are typical of autistic spectrum disorders (ASD), [6] including aberrant behaviours,
* Correspondence:[email protected]
1Neuroscience of Early Development (NED), 90 Avenue Vincent-D’indy,
Montreal, QC H2V 2S9, Canada
2Research Center of the CHU Sainte-Justine Mother and Child University
Hospital Center, 3175 Chemin Côte Ste-Catherine, Montreal, QC H3T 1C5, Canada
Full list of author information is available at the end of the article
emotional instability and hyperarousal to sensory stimulation [4], especially in the auditory modality [7].
Deficits in auditory processing likely contribute to behavioural hypersensitivity and hyperexcitability to auditory stimulation reported in FXS individuals [8–10] and may be involved in abnormal language development as suggested by studies investigating autism [7, 11, 12]. Electroencephalography (EEG) studies revealed alter-ations in auditory evoked potentials (AEPs) reflecting basic auditory processing deficits in FXS [13–18]. These deficits are perhaps impairing the generation of memory traces, a concept reflecting the memorization of a learnt stimulus, which is required for stimulus discrimination [18] and may thus be related to a lack of habituation. EEG alterations in FXS have been found not only in basic auditory processing, but also in later event-related potential (ERP) components reflecting cognitive pro-cesses. A classic protocol to elicit cognitive ERPs is the oddball paradigm: trains of frequent standard stimuli are randomly interspersed with rare deviant stimuli eliciting a particular response, such as the Mismatch Negativity (MMN) in passive tasks and the P3 in active tasks in which a response to the infrequent stimuli is required [19]. Amplitudes of MMN and P3 components are attenuated in FXS [16–18], suggesting poor memory trace formation of the standard stimulus [20] as well as attention deficits [21].
Repetition suppression (RS) describes a phenomenon in which stimulus repetitions result in diminished brain activity in response to the standard stimulus. Using EEG, auditory RS in FXS has been assessed by comparing responses to early and late standard tones in oddball paradigms [15,18] and by analysing a maximum of four sequential presenta-tions of a standard tone [9,13]. Both paradigms consistently show a lack of N1/P2 amplitude suppression in FXS. Recently, Ethridge et al. [9] analysed single-trial time– fre-quency in addition to AEP habituation and reported a decrease of RS in N1 amplitude together with alterations in both power and phase locking index in several frequency bands in FXS [9].
Whereas impairments in RS have been repeatedly found in FXS [9,13,15,18,22, 23], it has not yet been investi-gated with regard to cognitive functioning. In an explora-tory analysis, Ethridge et al. suggested that reductions in RS were associated with parental reports of auditory hypersensitivity and social problems in FXS participants [9]. In support of these findings, Bruno et al. found impairments in RS to be correlated to higher autism symptoms in FXS [22]. However, no reference to ID sever-ity has been made. Given that RS appears to be associated with auditory perceptual learning [24] and learning being a prerequisite for cognitive functioning, we expect RS patterns to vary in FXS with regard to IQ. Further, habitu-ation, the behavioural pendant to repetition suppression,
has been found to predict later IQ in infant populations [25], suggesting a possible link between RS and IQ.
In order to reveal the distinct patterns of repetition effects in FXS participants in relation to cognition, we used a passive listening paradigm presenting ten standards with-out deviants, allowing measurement of a delayed repetition effect with more repetitions. In addition, we extended the investigation of RS from basic sensory components, as performed previously, to stimuli mimicking words. Process-ing of such stimuli is typically reflected in early as well as late components such as the N400 [26]. In fact, loss of N400 RS in response to spoken target words was found in fragile X-associated tremor/ataxia syndrome (FXTAS) [27]. We aimed at controlling for familiarity by using novel com-plex auditory stimuli in order to avoid semantic information that might bias cerebral processing and elicit late cognitive components such as the N400 [2,28].
Auditory RS can also be studied in FXS animal models [29] supporting the relevance of RS as a translational biomarker for therapeutic approaches [30, 31]. Lovelace et al. demonstrated that a class of enzymes targeted by FMRP is directly involved in RS inFMR1KO mice [29]. In line with this, Bruno and colleagues [22] used fMRI and found impaired RS to visual face/gaze stimuli in the left fusiform gyrus directly correlated to lower, less typical levels of FMRP in FXS participants. Importantly, Schneider et al. used RS as an outcome measure in a clinical trial and found an improvement of RS in the N1/P2 complex in response to late vs. early sinusoidal tones in FXS participants after 3 months of minocycline treatment [15], pointing to the possibility of rescuing RS in humans as it was found in FMR1 KO mice [29]. To further explore the clinical potential of this measure, we also used a machine learning approach to quantify the accuracy of single-trial RS features in the prediction of cognitive functioning levels in FXS participants.
Methods Participants
A total of 19 FXS participants and 29 neurotypical con-trols participated in the experiment. Five FXS participants and three controls were excluded from analysis due to extensive movement artifacts. The 14 remaining FXS par-ticipants were compared to 26 neurotypical controls with a similar age distribution. Table1displays the demograph-ics of the study population. Medication was reported by the parents, and all FXS participants were on a stable dose since at least 6 months before testing. Diagnoses of comorbidities were obtained from the medical file at the hospital and were based on psychiatric and/or neuro-psychological evaluations. Medication and comorbidities are detailed in Table2.
Sainte-Justine Mother and Child University Hospital Center in Montreal. Neurotypical controls were recruited using posters at the Sainte-Justine Hospital and the University of Montreal and by classified ads on selected websites. Normal hearing and normal or corrected-to-normal vision was reported in all participants. All participants were franco-phone, right-handed and born at term. Non-verbal intelligence was examined using the non-verbal Leiter-R International Performance Scale [32] for all FXS partici-pants as well as neurotypical children and adolescents and the Wechsler Abbreviated Scale of Intelligence (WASI) [33] for neurotypical adults only. Autistic behaviour in FXS participants was quantified using the repetitive behavior questionnaire [34] and the aberrant behavior checklist [35], which were completed by the parents. Results from these questionnaires are reported in [14]. The study protocol was reviewed and approved by the ethics, administrative and scientific committees at the Sainte-Justine’s Hospital Research Center. Procedures undertaken were explained to participants and parents or legal caregivers, and written informed consent was obtained.
Apparatus
Testing took place in a dark soundproof experimental chamber in the Sainte-Justine hospital. A Dell GX150 PC was used to present the stimuli via E-Prime 1.0 (Psychology
Software Tools Inc. Pittsburgh, PA, USA). Two speakers (Optimus XTS 24, Boston, MA, USA) were placed laterally at a 30-cm distance from the subject’s ears.
Stimuli
Eighteen different two-syllable pseudowords were chosen from the BELEC [36] and ODÉDYS-II [37] paediatric bat-teries and recorded in a soundproof chamber while spoken by a native French-speaking woman. Adobe Audition 3.0 (Adobe Systems Inc., San Jose, CA, USA) was used for recording and normalization to−3 dB SPL. Pseudowords had an average length of 930 ms and ranged between 800 and 1300 ms.
Procedure
Participants chose among five movies for children that they watched without sound and without subtitles during EEG installation and stimuli presentation in order to en-hance acceptance of the procedure and reduce movement artefacts through fixation on the screen. The same pseudo-word was presented successively ten times each with an inter-stimulus interval of 250 ms at 70 dB SPL intensity and 16-bit resolution. In total, 18 trials with different pseu-dowords were presented in sequential order with an inter-trial interval of 250 ms in a passive listening paradigm. The order of pseudowords was fixed across participants in order to avoid pseudowords starting with a similar sound to be presented in succession.
A 128 electrode dense array EEG was used for recording (Electrical Geodesics System Inc., Eugene, OR, USA). Impedances were maintained under 40 kΩ [38], and during recording, Cz was used as reference. Signals were acquired and processed by a G4 Macintosh computer using NetStation Software (Version 2.0). EEG data was digitalized at a sampling rate of 250 Hz, and an analog bandpass filter of 0.01–100 Hz was applied. Off-line analyses were carried out with BrainVision Analyser soft-ware, version 2.0 (Brain Products, Munich, Germany). Data were digitally filtered with a 1–50 Hz filter and re-referenced to an average reference. Thirty electrodes containing muscular artefacts, around the neck and face, were removed for all participants. Blink artefacts were removed using a semi-automatic independent component analysis (ICA) [39] (see Additional file 1for details). EEG signal was segmented into 800-ms epochs after stimulus onset. Algorithmic artefact marking of voltage exceeding ± 100 μV was followed by visual data inspection of seg-mented data in which epochs with artefacts were rejected manually. An average of 178/180 segments were kept for control participants and 174/180 for FXS participants.
EEG signal processing
Data was exported to a commercial software package (MATLAB 6.1, The MathWorks Inc., Natick, MA, 2000) Table 1Demographics of the study population
Variable FXS participants Neurotypical controls
N 14 (4♀) 26 (11♀)
Age range 9–32 years 9–32 years Mean age (SD) 15.5 (± 6.06) 17.1 (± 6.1)
NVIQ range 32–93 87–129
Mean NVIQ (SD) 48 (± 14.12) 113 (± 10.41)
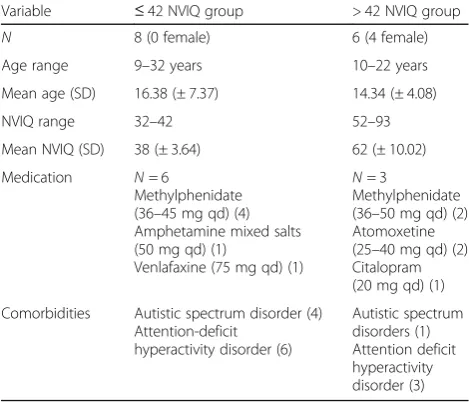
Table 2Characteristics of the FXS NVIQ median-split subgroups
Variable ≤42 NVIQ group > 42 NVIQ group
N 8 (0 female) 6 (4 female)
Age range 9–32 years 10–22 years Mean age (SD) 16.38 (± 7.37) 14.34 (± 4.08)
NVIQ range 32–42 52–93
Mean NVIQ (SD) 38 (± 3.64) 62 (± 10.02) Medication N= 6
Methylphenidate (36–45 mg qd) (4) Amphetamine mixed salts (50 mg qd) (1)
Venlafaxine (75 mg qd) (1)
N= 3
Methylphenidate (36–50 mg qd) (2) Atomoxetine (25–40 mg qd) (2) Citalopram (20 mg qd) (1) Comorbidities Autistic spectrum disorder (4)
Attention-deficit hyperactivity disorder (6)
using BrainVision solutions. Signal energy (E) was used as a measure of total signal amplitude in order to detect repetition effects as in [40]. Signal energy measures allowed the inclusion of a larger age range compared to ERP component analyses, since it is less affected by mat-urational changes found in AEP components [41].
Signal energy is defined asE= ∑|amp|2 where amp is the amplitude value (μV) of all EEG data points contained in a segmented trial. The time series of each presentation
p (1 to 10) were normalized relative to the standard deviation of its series of ten presentations (the repetition series) of the pseudoword stimulus s (1 to 18) for each participant and channel. The objective was to normalize the time series of each pseudoword s (the series of ten presentations ofs) to make the standard deviation of each pseudoword the same. Subsequently, the energy was com-puted for all ten presentations (1≤ n ≤10) of pseudo-words. A detailed explanation of the signal energy computation can be found in the Additional file1.
Spatial principal component analysis
In order to identify spatial regions of interest (ROIs) relevant for the task performed in our samples, we used the properties of principal component analysis (PCA) [42–45]. For each group of participants (FXS partici-pants and controls), we performed a separate spatial PCA (Varimax rotation, SPSS statistics, version 20, IBM Corp., Armonk, NY, USA) with 99 electrode sites as dependent variables, participants (14 in the FXS and 26 in the control group) and presentations (10) as observa-tions [46]. Specific details of the spatial PCA factor load-ings can be found in Additional file1.
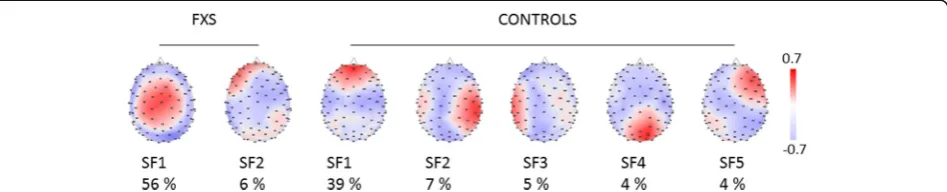
The spatial PCA yielded 12 factors for the FXS and 15 for the control group. The first five factors explained 60% of the data variance for the control group, and the first two factors explained 62% of the variance for the FXS group. Seven regions of interest were identified from these factors (see Fig. 1): central and left frontal areas based on the two factors for the FXS group and left temporal, fronto-central, right frontal, right temporal and occipital areas based on the five factors for the control group.
Statistical analysis Linear mixed models
Statistical analyses were performed using SPSS statistics, version 23 (IBM Corp., Armonk, NY, USA). Linear mixed models (LMM) were used to understand how group membership (FXS vs. control) and NVIQ predicted signal energy changes across repetitions. Further, age was assessed as predictor in order to account for the large age range in our sample. A LMM approach was chosen over traditional repeated measures analysis in order to account for unbalanced design, enable random intercepts and slopes, allow for nonlinear modeling of energy changes across repetitions and select an appropriate covariance structure for the repetition effects [47–50].
The model used for this study was determined by a series of steps to determine model fit [47] that can be found in Additional file 1. Finally, LMM analysis was performed using maximum likelihood for estimation method [47] and predictors group, NVIQ and age were added sequentially, verifying if model fit was improved by the addition of each predictor using chi-square likelihood ratio test [47]. Finally, covariance structure was selected by comparing model fit between available structures using Akaike’s Information Criterion (AIC) [47].
Based on significant interactions, further LMMs were per-formed, exploring signal energy changes across presentations in FXS and controls separately following the same series of steps described above for each model. Bonferroni-corrected post hoc paired comparisons were performed for significant main effects. Significance level was set to 5% (p= 0.05). In order to explore significant interactions and reveal patterns of RS, a NVIQ median-split was performed dividing the FXS group into two subgroups (≤42 and > 42 NVIQ).
Classification of NVIQ subgroups in FXS using single-trial RS features
A machine learning approach was used in order to specif-ically investigate whether differences in RS effects can pre-dict differences in cognitive capacities (i.e. NVIQ levels) within the FXS group. Importantly, we chose to explore this question using a binary classification approach (to decode between NVIQ median-split subgroups) based on
trial differences in EEG energy between consecutive presen-tations (18 trials across 14 FXS participants, i.e.n= 252). In addition to addressing the limitation of small sample size, which precludes a standard statistical analysis, a successful single-trial classification of FXS participants (i.e. based on 252 samples) would provide an important demonstration of the sensitivity of RS. The features used in the classification consisted of differences in energy between P1 and subse-quent presentations as well as differences between P2 and subsequent presentations. Because they capture single-trial changes in energy between first (or second) stimulus presentations and subsequent presentations, these features were designed to account for repetition effects. A total of 17 such features were calculated for each of the seven ROIs, yielding 119 features in total.
We ran the single-trial classifications using a leave-two-subject-out cross-validation across the group of FXS partici-pants, which is equivalent to a K-fold cross-validation where all 36 trials from two participants (one from each subgroup) are used as test set in each fold. Given that the NVIQ based division of the FXS group yielded a subgroup with NVIQ≤ 42 (n= 8) and another with NVIQ > 42 (n= 6), we used a bootstrap approach to repeatedly run the classification on balanced classes. This led to running 28 classifications (all options of picking subgroups of 6 among 8 participants) with 216 samples (6 × 18 trials). In other words, in each fold, a model is trained on single-trial RS features from ten par-ticipants (5 per NVIQ subgroup) and tested on the single trials from the two remaining participants (1 from each class). The mean decoding accuracy (DA) of each single feature was used as a measure of classification performance.
Several classification algorithms were tested includingk-th nearest neighbor (KNN), linear discriminant analysis (LDA) and support vector machine (SVM). Although the perfor-mances were reasonably similar, SVM (with radial basis function kernel) provided the best decoding results and was thus used in this study.
Given that the decoding problem investigated here is a binary classification, the theoretical chance level for the DA is 50%. However, a reliable assessment of the accur-acy of machine learning decoding accuraccur-acy requires an evaluation in terms of statistical significance. We there-fore evaluated the statistical significance of all reported DAs using the binomial cumulative distribution [51], followed by Bonferroni correction across the number of explored features to correct for multiple comparisons. This conservative approach indicated that a decoding accuracy is considered statistically significant at p< 0.05 orp< 0.01 if it exceeds 62.96 or 64.35% respectively.
Results
Characteristics of the population
FXS participants had a lower NVIQ (M = 51, ± 15.46) than the control group (M = 113, ± 10.79) (t(23)=−15.5,
p= 0.0001). Based on our NVIQ measures, one partici-pant (14 years, NVIQ = 93, female) did not present an ID. The rest presented an ID ranging from mild to severe. For some analyses, the FXS group was split into subgroups using a median-split at 42 NVIQ. Character-istics of the NVIQ-FXS subgroups can be found in Table 2. NVIQ differed significantly between the two FXS subgroups (t(12) =−5.6, p= 0.001) with a mean of 38 (± 3.64) vs. 62 (± 10.02). EEG segments kept for analysis did not differ significantly between control and FXS participants (t(15) =−2.1,p= 0.058) or between the two NVIQ FXS subgroups (t(8)=−1.9,p= 0.099).
Linear mixed models
Baseline model: intercept, slope and polynomial structure The construction of the model was started with a simple repeated measures (repetition (10) × ROI (7)) model with energy as outcome variable and repetition and ROI as fixed effects and without any predictors that served as baseline model. Using the chi-square likelihood ratio test, best fit for the baseline model was found using a random slope but not intercept and a linear model (see Additional file1for details).
Predictors
The first predictor added to the model was group (FXS vs. control) in order to verify if information about group membership improves model fit. Repetition, ROI and group were entered as fixed effects as well as interac-tions between repetition and ROI; repetition and group; and repetition, group and ROI. A random slope term accounted for inter-individual differences in trajectory changes across repetitions. Adding the predictor ‘group’ improved the model significantly [χ2(70, N= 40) = 103,
p< 0.01]. Whereas no significant main effect was found for group and ROI, repetition yielded a significant effect (F (9, 395.4) = 5.77, p = 0.0001), meaning that signal energy significantly changed across stimulus repetitions. A significant interaction was found between repetition and group (F (9, 395.4) = 3.75, p = 0.0001), suggesting that signal energy repetition effects differed between groups. No interactions were found between ROI and repetition or ROI, group and repetition.
Then, NVIQ was added as a second predictor and fixed effect to the model. Interactions between NVIQ and repetition as well as between NVIQ, repetition and group were added to the existing interactions. The model improved significantly [χ2(20,N= 40) = 43,p< 0.01] with the inclusion of the predictor ‘NVIQ’. In this model, the main effect for repetition was not significant any more (F (9, 596) = 1.43,p= 0.174) and neither were the other main effects (ROI, IQ, group). A significant interaction was found between repetition and group (F (9, 596) = 2.09,
602) = 2.05,p= 0.032) and repetition, NVIQ and group (F (10, 417) = 2.57, p = 0.005), suggesting that repetition effect differences between groups varied with NVIQ.
Finally, age was added as predictor and fixed effect to the model. Adding age as predictor diminished model fit according to AIC and differed not significantly from the previous model [χ2(40,N= 40) = 41,p< 0.9].
Thus, we concluded that a random slope model with group and NVIQ as predictors presents the best fit for the data. All available covariance structures were tested, and first-order autoregressive covariance structure provided the best model fit according to AIC. Based on the signifi-cant interactions between group and repetitions, we decided to build separate models for FXS and controls in order to examine their distinct repetition effect patterns.
Controls
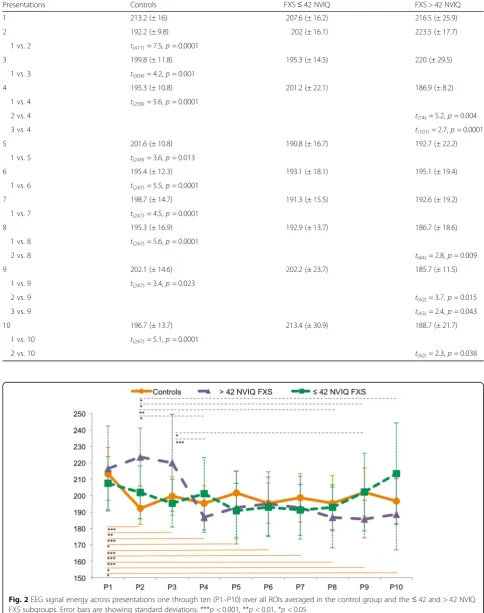
The test statistics for the baseline model can be found in Additional file1. A significant main effect was found for repetition (F(9, 273.3) = 9.31, p= 0.0001), meaning that signal energy significantly changed between repetitions, but not for ROI. A significant interaction was found be-tween ROI and repetition (F(54, 1253) = 1.52,p= 0.01). A Bonferroni-corrected post hoc test showed a signifi-cant reduction in energy between the first and all follow-ing presentations of a pseudoword (see Table3for mean values and t statistics). Figure 2 shows energy across presentations for the control group. The addition of NVIQ as predictor did not improve the model signifi-cantly [χ2(10,N= 26) = 15,p> 0.05].
FXS
The baseline model is described in Additional file1. In the baseline model, with fixed effects for repetition, ROI and the interaction between repetition and ROI, a significant effect could be found for repetition (F (9, 133.5) = 2.02,
p = 0.042), meaning that signal energy changed signifi-cantly between repetitions. No main effect could be found for ROI, and the interaction between repetition and ROI was also not found to be significant.
Then, we added NVIQ as predictor and fixed effect to the model, as well as interactions between repetition and NVIQ. The model improved significantly with the addition of NVIQ as a predictor [χ2 (10, N = 14) = 20,
p < 0.05]. A main effect for repetition was found (F(9, 207) = 1.99, p = 0.042), but not for ROI or NVIQ. The interaction between repetition and NVIQ was found to be significant (F (9, 216.6) = 2.36,p = 0.015), suggesting that repetition effects in signal energy differed with respect to NVIQ. Bonferroni-corrected post hoc tests showed no significant changes in energy between the ten presentations. In order to explore the significant inter-action between repetition and NVIQ, we decided to split
the FXS group into subgroups using a median-split at 42 NVIQ.
> 42 NVIQ FXS subgroup
The baseline model is detailed in Additional file1. A sig-nificant main effect was found for repetition (F(9, 58.9) = 3.76,p= 0.001), meaning signal energy changed between repetitions. No main effect was found for ROI or the inter-action between ROI and repetition. Bonferroni-corrected post hoc tests showed a significant reduction in energy between presentation 2/3 and later presentations. Test statistics can be found in Table 3. Figure 2 shows energy across presentations for the > 42 NVIQ subgroup.
≤42 NVIQ FXS subgroup
No significant main effect was found for repetition or ROI, and the interaction between ROI and repetition was not significant. Energy across presentations for the ≤ NVIQ FXS subgroup is illustrated in Fig.2. Signal energy did not change significantly between repetitions in the≤42 NVIQ FXS group.
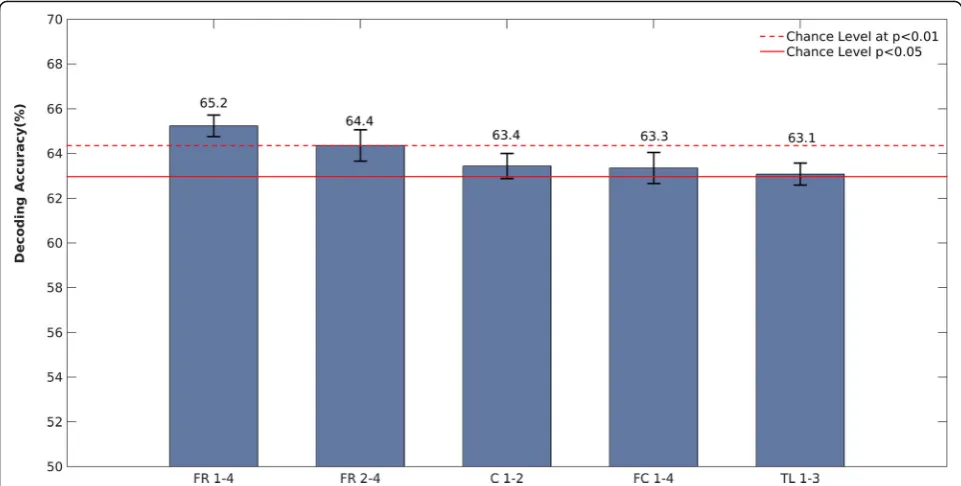
Single-trial RS classification results: NVIQ FXS subgroups Training an SVM to classify ≤42 NVIQ FXS vs. > 42 NVIQ FXS participants based on single-trial EEG repeti-tion effects yielded significant decoding accuracies across four ROIs, mainly over frontal and central regions (Fig. 3). The best predictions of FXS subgroup based on the EEG single-trial data, in other words the highest decoding accuracy, was observed over the frontal-right ROI. More precisely, this was achieved using single-trial RS changes observed between the first and fourth presentations (FR 1–4), yielding 65.2% correct classifica-tion, and also between the second and fourth presenta-tions (FR 2–4), with 64.4% correct classifications. The other features that provided statistically significant decoding were obtained with RS measured in the follow-ing three ROIs: C 1–2, FC 1–4 and TL 1–3.
Discussion
Table 3Mean energy (±SD) for each presentation and participant group andtstatistics for significant energy differences between presentations (Bonferroni correctedp-values for multiple comparisons)
Presentations Controls FXS≤42 NVIQ FXS > 42 NVIQ
1 213.2 (± 16) 207.6 (± 16.2) 216.5 (± 25.9)
2 192.2 (± 9.8) 202 (± 16.1) 223.5 (± 17.7)
1 vs. 2 t(471)= 7.5,p= 0.0001
3 199.8 (± 11.8) 195.3 (± 14.5) 220 (± 29.5)
1 vs. 3 t(304)= 4.2,p= 0.001
4 195.3 (± 10.8) 201.2 (± 22.1) 186.9 (± 8.2)
1 vs. 4 t(258)= 5.6,p= 0.0001
2 vs. 4 t(74)= 5.2,p= 0.004
3 vs. 4 t(101)= 2.7,p= 0.0001
5 201.6 (± 10.8) 190.8 (± 16.7) 192.7 (± 22.2)
1 vs. 5 t(249)= 3.6,p= 0.013
6 195.4 (± 12.3) 193.1 (± 18.1) 195.1 (± 19.4)
1 vs. 6 t(247)= 5.5,p= 0.0001
7 198.7 (± 14.7) 191.3 (± 15.5) 192.6 (± 19.2)
1 vs. 7 t(247)= 4.5,p= 0.0001
8 195.3 (± 16.9) 192.9 (± 13.7) 186.7 (± 18.6)
1 vs. 8 t(247)= 5.6,p= 0.0001
2 vs. 8 t(44)= 2.8,p= 0.009
9 202.1 (± 14.6) 202.2 (± 23.7) 185.7 (± 11.5)
1 vs. 9 t(247)= 3.4,p= 0.023
2 vs. 9 t(42)= 3.7,p= 0.015
3 vs. 9 t(43)= 2.4,p= 0.043
10 196.7 (± 13.7) 213.4 (± 30.9) 188.7 (± 21.7)
1 vs. 10 t(247)= 5.1,p= 0.0001
2 vs. 10 t(42)= 2.3,p= 0.038
machine learning approach further revealed that repeti-tion effects can accurately categorize FXS participants according to their level of cognitive functioning.
RS in FXS with relation to NVIQ
In controls, RS was found between the first and second pre-sentations of a pseudoword with signal energy remaining stable and low once RS occurred (see Fig. 2). This is in accordance with existing literature stating that RS effects in neurotypical subjects usually happen between the first and second presentations of an auditory stimulus [52]. In FXS, however, the presence of RS varied in relation to NVIQ. Whereas our results in the ≤42 NVIQ subgroup replicate findings of no RS in FXS in the literature [9,13,15,18], we are the first to demonstrate a pattern of delayed RS in an FXS full mutation subgroup with a milder cognitive pheno-type on average. The fact that RS occurs, although after several repetitions, may be an important building block of cognitive development of these FXS participants, leading to a comparatively milder phenotype. Repetition suppression is suggested to be the electrophysiological signature of habituation [53]. Since habituation has been related to a later cognitive development [25,54–56], RS measures may be a useful predictor of cognitive phenotype.
the cross-validation scheme applied here (cf. the‘Methods’ section) ensured a strict separation of participants across testing and training conditions. In other words, our machine learning findings reveal the feasibility of classifier generalization across participants with single-trial RS training and testing. These findings may suggest that the proposed method may be used to train a model for fast predictions (e.g. a few trials) in totally naïve FXS partici-pants in particular with larger training sets. In general, our classification results confirm the distinct patterns of repetition effects in the FXS cognitive level subgroups and reveal the potential of our measure in a clinical setting.
Mechanisms underlying impaired RS in FXS
Different mechanisms have been proposed to explain RS and its disruption in FXS. Simple, passive listening para-digms with short ISIs are designed to assess RS mediated through refractory properties of the neuronal network [9, 57]. The refractory system in FXS may be impaired through less synchronized and more widely excitable local synaptic networks due to exaggerated long-term depression found inFMR1KO mice [2] leading to weak-ened connections in neuronal circuits [9].
Another more cognitive theory accounting for RS is the sharpening model, proposing that repeated information leads to a‘sharpening’of information presentation in the cortex [13,58–60]. While novel stimuli activate large non-specific populations of neurons, repeated stimuli exposure results in fewer firing neurons, with the response of these few neurons being more specific and thus sharper. The ‘predictive coding’model is a neural network model [61] that explains sharpening through an interplay between bottom-up sensory input and top-down expectations in hierarchically organized sensory systems, ranging from the primary areas receiving sensory information from thalamic nerve projections to the frontal cortex generating a predictive percept [62]. RS is thereby the physiological correlate of a reduction in prediction error in response to a repeatedly presented stimulus that is achieved by modi-fying connections between hierarchical levels through synaptic plasticity [63]. Four phenomena identified in
FMR1 KO mice, closely entwined with deficient synaptic plasticity, might be involved in disrupted RS with regard to the sharpening theory: (1) hyperexcitable neurons [30], in interplay with (2) delayed and weaker inhibition [64], (3) less sharply selective neurons [30] with broader frequency-tuning curves [31] and, finally, (4) abnormal dendrite morphology that is closely related to defects in circuit plasticity [65]. Long dendritic spines with imma-ture morphologies and higher spine density suggest a fail-ure in the synapse maturation process [66, 67]. Recently, an interest was developed regarding synaptic BK channels that are crucial for short-term habituation and directly interact with FMRP [31, 68–71]. The BK channel seems
to be involved in the abnormal dendritic spine phenotype [69], learning deficits [70] and hyperexcitabilty in FXS [71]. These mechanisms might be less affected in less severe ID FXS subgroups, since they are expected to have higher levels of FMRP.
Another factor that might mediate NVIQ-related differ-ences in RS is attention, since the > 42 NVIQ group can be expected to pay more attention to the auditory stimula-tion. Attention-based prediction of up-coming stimuli modulated by the ventral striatum and the prefrontal cortex are central in the predictive coding model of RS [72, 73]. Concordantly, our group showed through trans-cranial direct current stimulation (tDCS) over the dorso-lateral prefrontal cortex (DLPC) an enhancement of RS when the DLPC was excited and a reduction of RS when the DLPC was inhibited [40, 74]. Dorsolateral caudate circuitry has been found abnormal and related to cognitive and behavioural deficits in FXS [75]. Recent reports high-light the contribution of hippocampal memory activity in predictive coding [76–78], whereas a larger hippocampal size has been associated with worse memory in FXS [79].
Lastly, recent studies by Van der Molen et al. and Wang et al. have suggested that the lack of RS in FXS might be the result of uncoordinated neuronal synchronization pat-terns, since an imbalance between slow and fast oscillatory activity has been found in FXS [80,81]. Elevated baseline levels of gamma power in FXS were interpreted as increased ‘background neural noise’ that contributed to impairments in synchronizing gamma frequency activity when necessary, leading to hyperexcitable and disorganized cortical networks [9]. These results underline the import-ance of comparing evoked responses against baseline levels in order to differentiate them from high neural background noise. Consequently, we normalized the time series of each presentation of a stimulus in our energy measures and examined the non-phase locked energy response relative to all ten presentations (see the‘Methods’section).
Main factors of spatial PCA
left frontal) explain a major part of the data variance whereas spatial components of activity in the control group appears more distributed and complex, having a total of five factors explaining the majority of the data variance. Further, altered functional connectivity and brain network activation has been found in FXS, with increased spatial spreading of phase synchronised activity, which may account for a more unitary activation pattern [80,81].
Pseudoword learning and NVIQ
Language is typically a major deficit in FXS individuals, although receptive vocabulary is described as a relative strength in their cognitive domain [82]. In this study, cognitive functioning of FXS participants was evaluated using the non-verbal Leiter-R since it eliminates language deficit confounds. Furthermore, it can estimate NVIQ as low as 30, whereas a floor effect would have been expected when using most other batteries. The fact that repetition effects in response to pseudowords are predictors of NVIQ may suggest that repetition effects are of core importance for cognitive development, independent of the modality being investigated. As such, alterations of the repetition effects have been found in not only the auditory but also the visual modality [22,23].
Conflation between sex and NVIQ effects in FXS
Sex is an important confounding variable when investigat-ing cognitive functioninvestigat-ing in FXS. Given that females have a milder phenotype than males with FXS [3], all of our female FXS participants fell into the > 42 NVIQ subgroup and we did not have not enough statistical power to com-pare RS between male and female participants in this subgroup. Given the fundamental biological differences between males and females presenting FXS, such as but not limited to FMRP levels, our study may have shown differences in RS as much in relation to sex as to NVIQ. Our results show that the more cognitively affected a FXS participant is, the less likely they are to show RS. Female FXS participants, who are generally less affected, are more likely to show some RS, although delayed.
Limitations and perspectives
Due to difficulties inherent to rare disease studies, our sample size is small, especially in the exploratory analysis in the median-split subgroups. Thus, single-trial machine learning was added in order to verify if our results would be confirmed with a completely different analysis ap-proach. Studies investigating EEG in FXS often have small sample sizes, since difficulties in EEG recordings are a common problem [83]. These problems result in selection bias, since participants with severe ID and intense behav-ioural problems can rarely be tested, and as such, we are not able to investigate the full spectrum of FXS. Less invasive EEG setups, such as wireless nets and home
recordings, may enable an adaptation of study procedures for this population. In this study, we demonstrated that reliable results could be obtained with a very short test (5 min), supporting the feasibility of EEG for FXS partici-pants in a clinical setting.
We included a rather large age range (9–32 years) to avoid further reducing the sample size. Electrophysio-logical activity is known to change with age, and matur-ation effects might present a confounding variable in our analysis. Also, RS effects in specific AEP components are difficult to compare across age groups since morphology, amplitudes and latencies change with maturation [84]. Signal energy is less affected by maturational changes found in AEP components, since it summarizes all ampli-tude values within a given time window and thus allows for a global examination of repetition effects across pre-sentations, independent of specific AEP components [40]. Further, the LMM approach can take variations in inter-cept and slope between participants into account. When entered as a possible predictor in our LMM, age did not significantly improve model fit, suggesting that age did not contribute to the explanation of repetition effects. Lastly, we controlled for age by using a control group with a similar age distribution.
Similarly, FXS participants in the ≤42 NVIQ FXS sub-group showed more autism symptoms, such as repetitive and aberrant behaviour, even though no statistical differ-ences were found due to a lack of power for multiple testing. Segments containing movement artifacts were removed for all participants, and no significant difference for segments kept was found between FXS subgroups. As mentioned above, attention deficits in FXS participants could have per-haps disrupted RS. Although both subgroups present ADHD comorbidities, the severity of attention deficits may differ between groups.
A study evaluating the effect of these confounding vari-ables would require a largeN of different ID and autism populations as well as enough variability on all the vari-ables to match and compare participants. This could most realistically be done in a multi-centric setting. Further, FMRP levels of FXS participants would have been of inter-est, since they likely represent a mediating factor between underlying neuronal alterations and severity of cognitive, behavioural and RS deficits.
Medication
However, both FXS NVIQ subgroups contain a compar-able amount of medicated and non-medicated individuals (see Table 2), suggesting that neither of the effects found in either group can solely be attributed to medication.
Meaning of the median-split
It is important to underline that the median-split at a NVIQ of 42 was used as a statistical tool in order to explore the interaction between group, NVIQ and repeti-tion effects revealed by the LMM. Repetirepeti-tion effects appeared to differ relative to NVIQ, but further analyses were necessary to get an idea of how patterns of RS change with NVIQ. Given the small sample size, a median-split was chosen, in order to have a similar Nin each subgroup. Since two individuals had an NVIQ of 42, they were both included in the ≤42 subgroup, whereas the lowest NVIQ in the > 42 group has an NVIQ of 52, rendering the separation between both groups to ten NVIQ points. However, this artificial NVIQ cut point is not clinically meaningful. Considering that NVIQ co-varies significantly with RS in FXS, it is to be expected that participants further away from the split-point present a better model fit than participants close to a NVIQ of 42/ 52 who are more likely to be located somewhere between the two patterns explored in the median-split analyses.
Conclusion
Due to their sensitivity, EEG measures may be a promising treatment biomarker. One important asset of such a biomarker is its independence from task comprehension, which is inherent to classic cognitive testing. Further clinical trials are needed to demonstrate direct treatment effects on cognition. We propose presentation-by-presentation EEG repetition effects as a sensitive tool in order to display modi-fications in brain processes relevant to cognitive and behav-ioural development in FXS.
Additional file
Additional file 1:Supplementary methods and results section (DOCX 22 kb)
Abbreviations
AEP:Auditory evoked potential; ASD: Autism spectrum disorder; C: Central ROI; CHU: University Hospital Center; DA: Decoding accuracy;
DLPC: Dorsolateral prefrontal cortex; EEG: Electroencephalography; ERP: Event-related potential; FC: Fronto-central ROI;FMR1: Fragile X mental retardation 1; fMRI: Functional magnetic resonance imaging; FMRP: Fragile X mental retardation protein; FR: Frontal-right ROI; FXS: Fragile X syndrome; ICA: Independent component analysis; ID: Intellectual disability; IQ: Intelligence quotient; KNN:k-th nearest neighbor; KO: Knockout; LDA: Linear discriminant analysis; LMM: Linear mixed model; mGluRs: Metabotropic glutamate receptors; MMN: Mismatch negativity; NVIQ: Non-verbal IQ; PCA: Principal component analysis; RE: Repetition enhancement; RF: Random forest; ROIs: Regions of interest; RS: Repetition suppression; SVM: Support vector machine; tDCS: Transcranial direct current stimulation; TL: Temporal left ROI; WASI: Wechsler Abbreviated Scale of Intelligence
Acknowledgements
We would like to thank all of our participants and their families as well as the Fragile X Québec Association for their continuous collaboration and support. We thank Emilie Sheppard for providing her voice for the auditory stimuli and Patricia Laniel and Maude Joannette for their help in the acquisition of EEG data.
Funding
This research was supported by a Scottish Rite Charitable Foundation grant to Sarah Lippé (grant number TSRCFC-12112) and a Fragile X Foundation of Canada grant awarded to Sarah Lippé and Sébastien Jacquemont. Karim Jerbi acknowledges the funding from the Canada Research Chairs program and NSERC Discovery Grant [RGPIN-2015-04854]. The funding body had no role in the design, collection, analysis and interpretation of the data and in writing the manuscript.
Availability of data and materials
The datasets used and analysed during the current study are available from the corresponding author on reasonable request.
Authors’contributions
IK participated in the study design; coordinated the study; carried out the recruitment, EEG recording, EEG and statistical analysis; and drafted the manuscript. TL designed and applied the classification methods and helped in drafting the manuscript. SR participated in the study design, carried out the spatial principal component analysis, helped with the statistical analysis and helped in drafting the manuscript. KL designed the analysis tools, calculated the signal energy and helped in drafting the manuscript. PV participated in the EEG recordings and analysis. JLM participated in the DNA analysis and study design. SJ participated in the study design and helped with the recruitment. PM examined the EEGs for epileptic activity. KJ participated in the study design, designed and applied the classification tools and helped in drafting the manuscript. SL conceived the study, participated in its design and helped in drafting the manuscript. All authors read and approved the final manuscript.
Ethics approval and consent to participate
The study protocol was reviewed and approved by the ethics, administrative and scientific committees at the Sainte-Justine’s Hospital Research Center. All procedures performed in studies involving human participants were in accordance with the ethical standards of the institutional and/or national research committee and with the 1964 Helsinki Declaration and its later amendments or comparable ethical standards. Procedures undertaken were explained to the participants and parents or legal caregivers, and written informed consent was obtained subsequently.
Consent for publication Not applicable
Competing interests
The authors declare that they have no competing interests.
Publisher’s Note
Springer Nature remains neutral with regard to jurisdictional claims in published maps and institutional affiliations.
Author details
1Neuroscience of Early Development (NED), 90 Avenue Vincent-D’indy,
Montreal, QC H2V 2S9, Canada.2Research Center of the CHU Sainte-Justine
Mother and Child University Hospital Center, 3175 Chemin Côte Ste-Catherine, Montreal, QC H3T 1C5, Canada.3Department of Psychology,
Université de Montréal, 90 Avenue Vincent-D’indy, Montreal, QC H2V 2S9, Canada.4Centre de Recherche en Neuropsychologie et Cognition (CERNEC),
90 Avenue Vincent-D’indy, Montreal, QC H2V 2S9, Canada.5International Laboratory for Brain, Music and Sound Research (BRAMS), 1430 Boul Mont-Royal, Montreal, QC H2V 2J2, Canada.6Faculty of Medicine, Université
de Montréal, 2900 boulevard Édouard-Montpetit, Montréal, QC H3T 1J4, Canada.7Centre de Recherche de l’Institut Universitaire en Santé Mentale de Montréal (CRIUSMM), 7401 Rue Hochelaga, Montréal, QC H1N 3M5, Canada.
8Centre de Recherche de l’Institut Universitaire de Gériatrie de Montréal
Received: 25 October 2016 Accepted: 12 January 2018
References
1. Penagarikano O, Mulle JG, Warren ST. The pathophysiology of fragile X syndrome. Annu Rev Genomics Hum Genet. 2007;8:109–29. 2. Bear MF, Huber KM, Warren ST. The mGluR theory of fragile X mental
retardation. Trends Neurosci. 2004;27(7):370–7.
3. Hessl D, Nguyen DV, Green C, Chavez A, Tassone F, Hagerman RJ, Senturk D, Schneider A, Lightbody A, Reiss AL, et al. A solution to limitations of cognitive testing in children with intellectual disabilities: the case of fragile X syndrome. J Neurodev Disord. 2009;1(1):33–45.
4. Schneider A, Hagerman RJ, Hessl D. Fragile X syndrome—from genes to cognition. Dev Disabil Res Rev. 2009;15(4):333–42.
5. Ornstein PA, Schaaf JM, Hooper SR, Hatton DD, Mirrett P, Bailey DB Jr. Memory skills of boys with fragile X syndrome. Am J Ment Retard. 2008; 113(6):453–65.
6. Bailey DB Jr, Raspa M, Bishop E, Holiday D. No change in the age of diagnosis for fragile X syndrome: findings from a national parent survey. Pediatrics. 2009;124(2):527–33.
7. Rotschafer SE, Razak KA. Auditory processing in fragile X syndrome. Front Cell Neurosci. 2014;8:19.
8. Baranek GT, Roberts JE, David FJ, Sideris J, Mirrett PL, Hatton DD, Bailey DB Jr. Developmental trajectories and correlates of sensory processing in young boys with fragile X syndrome. Phys Occup Ther Pediatr. 2008;28(1):79–98. 9. Ethridge LE, White SP, Mosconi MW, Wang J, Byerly MJ, Sweeney JA.
Reduced habituation of auditory evoked potentials indicate cortical hyper-excitability in fragile X syndrome. Transl Psychiatry. 2016;6:e787. 10. Rogers SJ, Hepburn S, Wehner E. Parent reports of sensory symptoms in
toddlers with autism and those with other developmental disorders. J Autism Dev Disord. 2003;33(6):631–42.
11. Nieto Del Rincon PL. Autism: alterations in auditory perception. Rev Neurosci. 2008;19(1):61–78.
12. Roberts TP, Cannon KM, Tavabi K, Blaskey L, Khan SY, Monroe JF, Qasmieh S, Levy SE, Edgar JC. Auditory magnetic mismatch field latency: a biomarker for language impairment in autism. Biol Psychiatry. 2011;70(3):263–9. 13. Castren M, Paakkonen A, Tarkka IM, Ryynanen M, Partanen J. Augmentation of
auditory N1 in children with fragile X syndrome. Brain Topogr. 2003;15(3):165–71. 14. Knoth IS, Vannasing P, Major P, Michaud JL, Lippe S. Alterations of visual
and auditory evoked potentials in fragile X syndrome. Int J Dev Neurosci. 2014;36:90–7.
15. Schneider A, Leigh MJ, Adams P, Nanakul R, Chechi T, Olichney J, Hagerman R, Hessl D. Electrocortical changes associated with minocycline treatment in fragile X syndrome. J Psychopharmacol. 2013;27(10):956–63.
16. St Clair DM, Blackwood DH, Oliver CJ, Dickens P. P3 abnormality in fragile X syndrome. Biol Psychiatry. 1987;22(3):303–12.
17. Van der Molen MJ, Van der Molen MW, Ridderinkhof KR, Hamel BC, Curfs LM, Ramakers GJ. Auditory and visual cortical activity during selective attention in fragile X syndrome: a cascade of processing deficiencies. Clin Neurophysiol. 2012;123(4):720–9.
18. Van der Molen MJ, Van der Molen MW, Ridderinkhof KR, Hamel BC, Curfs LM, Ramakers GJ. Auditory change detection in fragile X syndrome males: a brain potential study. Clin Neurophysiol. 2012;123(7):1309–18.
19. Luck SJ. An introduction to the event-related potential technique. Cambridge: MIT Press; 2005.
20. Näätanen R, Paavilainen P, Rinne T, Alho K. The mismatch negativity (MMN) in basic research of central auditory processing: a review. Clin Neurophysiol. 2007;118(12):2544–90.
21. Polich J. Updating P300: an integrative theory of P3a and P3b. Clin Neurophysiol. 2007;118(10):2128–48.
22. Bruno JL, Garrett AS, Quintin EM, Mazaika PK, Reiss AL. Aberrant face and gaze habituation in fragile X syndrome. Am J Psychiatry. 2014; 171(10):1099–106.
23. Rigoulot S, Knoth IS, Lafontaine MP, Vannasing P, Major P, Jacquemont S, Michaud JL, Jerbi K, Lippé S. Altered visual repetition suppression in fragile X syndrome: new evidence from ERPs and oscillatory activity. Int J Dev Neurosci. 2017;59:52–59.
24. Garrido MI, Kilner JM, Kiebel SJ, Stephan KE, Baldeweg T, Friston KJ. Repetition suppression and plasticity in the human brain. NeuroImage. 2009;48(1):269–79.
25. Kavšek M. Predicting later IQ from infant visual habituation and dishabituation: a meta-analysis. J Appl Dev Psychol. 2004;25(3):369–93. 26. Kutas M, Federmeier KD. Thirty years and counting: finding meaning in the
N400 component of the event-related brain potential (ERP). Annu Rev Psychol. 2011;62:621–47.
27. Yang JC, Chi L, Teichholtz S, Schneider A, Nanakul R, Nowacki R, Seritan A, Reed B, DeCarli C, Iragui VJ, et al. ERP abnormalities elicited by word repetition in fragile X-associated tremor/ataxia syndrome (FXTAS) and amnestic MCI. Neuropsychologia. 2014;63:34–42.
28. Deacon D, Dynowska A, Ritter W, Grose-Fifer J. Repetition and semantic priming of nonwords: implications for theories of N400 and word recognition. Psychophysiology. 2004;41(1):60–74.
29. Lovelace JW, Wen TH, Reinhard S, Hsu MS, Sidhu H, Ethell IM, Binder DK, Razak KA. Matrix metalloproteinase-9 deletion rescues auditory evoked potential habituation deficit in a mouse model of fragile X syndrome. Neurobiol Dis. 2016;89:126–35.
30. Rotschafer S, Razak K. Altered auditory processing in a mouse model of fragile X syndrome. Brain Res. 2013;1506:12–24.
31. Sinclair D, Oranje B, Razak KA, Siegel SJ, Schmid S. Sensory processing in autism spectrum disorders and fragile X syndrome—from the clinic to animal models. Neurosci Biobehav Rev. 2016;76(pt B):235–53. 32. Roid GH, Miller LJ. Leiter International Performance Scale—Revised:
examiner’s manual. In: Roid GH, Miller LJ, editors. Leiter International Performance Scale—revised edn. Wood Dale: Stoelting Co.; 1997. 33. Wechsler D. Wechsler Abbreviated Scale of Intelligence. San Antonio: The
Psychological Corporation; 1999.
34. Lam KSL, Aman MG. The Repetitive Behavior Scale-Revised: independent validation in individuals with autism spectrum disorders. J Autism Dev Disord. 2007;37(5):855–66.
35. Aman MG, Singh NN, Stewart AW, Field CJ. The aberrant behavior checklist: a behavior rating scale for the assessment of treatment effects. Am J Ment Defic. 1985;89(5):485–91.
36. Mousty P, Leybaert J, Alegria J, Content A, Morais J. BELEC. Batterie d’évaluation du langage écrit et de ces troubles. Bruxelles: De Boeck; 1994. 37. Jacquier-Roux M, Valdois S, Zorman M, Lequette C, Pouget G. ODÉDYS Outil
de DÉpistage des DYSlexies Version 2. Université Pierre Mendes France: Laboratoire de Psychologie et Neurocognition; 2009.
38. Tucker DM. Spatial sampling of head electrical fields: the geodesic sensor net. Electroencephalogr Clin Neurophysiol. 1993;87(3):154–63.
39. Plank M. Ocular correction ICA. In: Brain product press release 49: brain product press release 49; 2013. p. 1–4.
40. Lafontaine MP, Lacourse K, Lina JM, McIntosh AR, Gosselin F, Theoret H, Lippe S. Brain signal complexity rises with repetition suppression in visual learning. Neuroscience. 2016;326:1–9.
41. Ceponiene R, Rinne T, Näätänen R. Maturation of cortical sound processing as indexed by event-related potentials. Clin Neurophysiol. 2002;113(6):870–82.
42. Rigoulot S, Delplanque S, Despretz P, Defoort-Dhellemmes S, Honore J, Sequeira H. Peripherally presented emotional scenes: a spatiotemporal analysis of early ERP responses. Brain Topogr. 2008;20(4):216–23. 43. Rigoulot S, Fish K, Pell MD. Neural correlates of inferring speaker sincerity
from white lies: an event-related potential source localization study. Brain Res. 2014;1565:48–62.
44. Spencer KM, Dien J, Donchin E. A componential analysis of the ERP elicited by novel events using a dense electrode array. Psychophysiology. 1999; 36(3):409–14.
45. Spencer KM, Dien J, Donchin E. Spatiotemporal analysis of the late ERP responses to deviant stimuli. Psychophysiology. 2001;38(2):343–58. 46. Pourtois G, Delplanque S, Michel C, Vuilleumier P. Beyond conventional
event-related brain potential (ERP): exploring the time-course of visual emotion processing using topographic and principal component analyses. Brain Topogr. 2008;20(4):265–77.
47. Field A. Discovering statistics using IBM SPSS statistics. Thousand Oaks: Sage; 2013.
48. Kaushal N, Rhodes RE. Exercise habit formation in new gym members: a longitudinal study. J Behav Med. 2015;38(4):652–63.
49. Shek DT, Ma CM. Longitudinal data analyses using linear mixed models in SPSS: concepts, procedures and illustrations. ScientificWorldJournal. 2011;11:42–76.
51. Combrisson E, Jerbi K. Exceeding chance level by chance: the caveat of theoretical chance levels in brain signal classification and statistical assessment of decoding accuracy. J Neurosci Methods. 2015;250:126–36. 52. Rosburg T, Zimmerer K, Huonker R. Short-term habituation of auditory
evoked potential and neuromagnetic field components in dependence of the interstimulus interval. Exp Brain Res. 2010;205(4):559–70.
53. Snyder KA, Keil A. Repetition suppression of induced gamma activity predicts enhanced orienting toward a novel stimulus in 6-month-old infants. J Cogn Neurosci. 2008;20(12):2137–52.
54. Colombo J, Mitchell DW. Infant visual habituation. Neurobiol Learn Mem. 2009;92(2):225–34.
55. Rankin CH, Abrams T, Barry RJ, Bhatnagar S, Clayton DF, Colombo J, Coppola G, Geyer MA, Glanzman DL, Marsland S, et al. Habituation revisited: an updated and revised description of the behavioral characteristics of habituation. Neurobiol Learn Mem. 2009;92(2):135–8.
56. Rose DH, Slater A, Perry H. Prediction of childhood intelligence from habituation in early infancy. Intelligence. 1986;10(3):251–63.
57 Budd TW, Barry RJ, Gordon E, Rennie C, Michie PT. Decrement of the N1 auditory event-related potential with stimulus repetition: habituation vs. refractoriness. Int J Psychophysiol. 1998;31(1):51–68.
58 Desimone R. Neural mechanisms for visual memory and their role in attention. Proc Natl Acad Sci U S A. 1996;93(24):13494–9.
59 Grill-Spector K, Henson R, Martin A. Repetition and the brain: neural models of stimulus-specific effects. Trends Cogn Sci. 2006;10(1):14–23.
60 Wiggs CL, Martin A. Properties and mechanisms of perceptual priming. Curr Opin Neurobiol. 1998;8(2):227–33.
61 Friston K. A theory of cortical responses. Philos Trans R Soc Lond Ser B Biol Sci. 2005;360(1456):815–36.
62 Summerfield C, Egner T, Greene M, Koechlin E, Mangels J, Hirsch J. Predictive codes for forthcoming perception in the frontal cortex. Science. 2006;314(5803):1311–4.
63 Baldeweg T. Repetition effects to sounds: evidence for predictive coding in the auditory system. Trends Cogn Sci. 2006;10(3):93–4.
64 Gibson JR, Bartley AF, Hays SA, Huber KM. Imbalance of neocortical excitation and inhibition and altered UP states reflect network
hyperexcitability in the mouse model of fragile X syndrome. J Neurophysiol. 2008;100(5):2615–26.
65 Portera-Cailliau C. Which comes first in fragile X syndrome, dendritic spine dysgenesis or defects in circuit plasticity? Neuroscientist. 2012;18(1):28–44. 66 Irwin SA, Galvez R, Greenough WT. Dendritic spine structural anomalies in fragile-X mental retardation syndrome. Cereb Cortex. 2000;10(10):1038–44. 67 Irwin SA, Patel B, Idupulapati M, Harris JB, Crisostomo RA, Larsen BP, Kooy F,
Willems PJ, Cras P, Kozlowski PB, et al. Abnormal dendritic spine characteristics in the temporal and visual cortices of patients with fragile-X syndrome: a quantitative examination. Am J Med Genet. 2001;98(2):161–7. 68 Deng PY, Rotman Z, Blundon JA, Cho Y, Cui J, Cavalli V, Zakharenko SS,
Klyachko VA. FMRP regulates neurotransmitter release and synaptic information transmission by modulating action potential duration via BK channels. Neuron. 2013;77(4):696–711.
69 Hebert B, Pietropaolo S, Meme S, Laudier B, Laugeray A, Doisne N, Quartier A, Lefeuvre S, Got L, Cahard D, et al. Rescue of fragile X syndrome phenotypes in Fmr1 KO mice by a BKCa channel opener molecule. Orphanet J Rare Dis. 2014;9:124.
70 Typlt M, Mirkowski M, Azzopardi E, Ruettiger L, Ruth P, Schmid S. Mice with deficient BK channel function show impaired prepulse inhibition and spatial learning, but normal working and spatial reference memory. PLoS One. 2013;8(11):e81270.
71 Zhang Y, Bonnan A, Bony G, Ferezou I, Pietropaolo S, Ginger M, Sans N, Rossier J, Oostra B, LeMasson G, et al. Dendritic channelopathies contribute to neocortical and sensory hyperexcitability in Fmr1(-/y) mice. Nat Neurosci. 2014;17(12):1701–9.
72 Bar M, Kassam KS, Ghuman AS, Boshyan J, Schmid AM, Dale AM, Hamalainen MS, Marinkovic K, Schacter DL, Rosen BR, et al. Top-down facilitation of visual recognition. Proc Natl Acad Sci U S A.
2006;103(2):449–54.
73 O'Doherty J, Dayan P, Schultz J, Deichmann R, Friston K, Dolan RJ. Dissociable roles of ventral and dorsal striatum in instrumental conditioning. Science. 2004;304(5669):452–4.
74 Lafontaine MP, Theoret H, Gosselin F, Lippe S. Transcranial direct current stimulation of the dorsolateral prefrontal cortex modulates repetition suppression to unfamiliar faces: an ERP study. PLoS One. 2013;8(12):e81721.
75 Peng DX, Kelley RG, Quintin EM, Raman M, Thompson PM, Reiss AL. Cognitive and behavioral correlates of caudate subregion shape variation in fragile X syndrome. Hum Brain Mapp. 2014;35(6):2861–8.
76 Bosch SE, Jehee JF, Fernandez G, Doeller CF. Reinstatement of associative memories in early visual cortex is signaled by the hippocampus. J Neurosci. 2014;34(22):7493–500.
77 Hindy NC, Ng FY, Turk-Browne NB. Linking pattern completion in the
hippocampus to predictive coding in visual cortex. Nat Neurosci. 2016;19(5):665–7. 78 Kok P, Jehee JF, de Lange FP. Less is more: expectation sharpens
representations in the primary visual cortex. Neuron. 2012;75(2):265–70. 79 Molnar K, Keri S. Bigger is better and worse: on the intricate relationship
between hippocampal size and memory. Neuropsychologia. 2014;56:73–8. 80 van der Molen MJ, Stam CJ, van der Molen MW. Resting-state EEG
oscillatory dynamics in fragile X syndrome: abnormal functional connectivity and brain network organization. PLoS One. 2014;9(2):e88451.
81 Wang J, Ethridge LE, Mosconi MW, White SP, Binder DK, Pedapati EV, Erickson CA, Byerly MJ, Sweeney JA. A resting EEG study of neocortical hyperexcitability and altered functional connectivity in fragile X syndrome. J Neurodev Disord. 2017;9:11.
82 Abbeduto L, Brady N, Kover ST. Language development and fragile X syndrome: profiles, syndrome-specificity, and within-syndrome differences. Ment Retard Dev Disabil Res Rev. 2007;13(1):36–46.
83 Devitt NM, Gallagher L, Reilly RB. Autism spectrum disorder (ASD) and fragile X syndrome (FXS): two overlapping disorders reviewed through electroencephalography—what can be interpreted from the available information? Brain Sci. 2015;5(2):92–117.
84 Fox AM, Anderson M, Reid C, Smith T, Bishop DV. Maturation of auditory temporal integration and inhibition assessed with event-related potentials (ERPs). BMC Neurosci. 2010;11:49.
• We accept pre-submission inquiries
• Our selector tool helps you to find the most relevant journal • We provide round the clock customer support
• Convenient online submission • Thorough peer review
• Inclusion in PubMed and all major indexing services • Maximum visibility for your research
Submit your manuscript at www.biomedcentral.com/submit