in the population sciences published by the Max Planck Institute for Demographic Research Konrad-Zuse Str. 1, D-18057 Rostock · GERMANY www.demographic-research.org
DEMOGRAPHIC RESEARCH
VOLUME 26, ARTICLE 18, PAGES 449-488
PUBLISHED 16 MAY 2012
http://www.demographic-research.org/Volumes/Vol26/18/ DOI: 10.4054/DemRes.2012.26.18
Research Article
Demography, foreclosure, and crime:
Assessing spatial heterogeneity in contemporary
models of neighborhood crime rates
Ashley N. Arnio
Eric P. Baumer
This publication is part of the Special Collection on “Spatial Demography”, organized by Guest Editor Stephen A. Matthews.
© 2012 Ashley N. Arnio & Eric P. Baumer.
This open-access work is published under the terms of the Creative Commons Attribution NonCommercial License 2.0 Germany, which permits use, reproduction & distribution in any medium for non-commercial purposes, provided the original author(s) and source are given credit.
1 Introduction 450 2 “Global” contemporary neighborhood models of crime 452
3 Theoretical mechanisms and spatial heterogeneity in neighborhood
crime models 454
3.1 Theoretical mechanisms explaining the link between demographic context and crime rates
454
3.2 Spatial heterogeneity in relationships between demographic context and crime rates
455
4 The present study 458
4.1 Data and samples 458
4.2 Measures 459
4.3 Analytical strategy 462
5 Results 464
5.1 Global OLS and spatial regression models 464
5.2 GWR models 467
6 Conclusion 476
7 Acknowledgements 477
References 478
Demography, foreclosure, and crime:
Assessing spatial heterogeneity in contemporary models of
neighborhood crime rates
*Ashley N. Arnio1 Eric P. Baumer2
Abstract
BACKGROUND
The present research evaluates the possibility of spatial heterogeneity in the effects on neighborhood crime rates of both traditional demographic indicators—immigrant concentration, racial composition, socioeconomic disadvantage, and residential instability—and a contemporary aspect of housing transition—foreclosure—that has garnered significant attention in recent scholarship.
OBJECTIVE
This research advances previous research by explicitly assessing the merits of the typical “global” or “one size fits all” approach that has been applied in most neighborhood studies of demographic context and neighborhood crime rates by juxtaposing it against an alternative strategy—geographically weighted regression (GWR)—that highlights the potentially significant “local” variability in model parameters. We assess the local variation of these relationships for census tracts within the city of Chicago.
METHODS
This paper utilizes GWR to test for spatial heterogeneity in the effects of demographic context and other predictors on neighborhood crime rates. We map
1 Ph.D. Candidate, Florida State University, College of Criminology and Criminal Justice.
E-mail:[email protected].
2 Allen E. Liska Professor of Criminology, Florida State University, College of Criminology and
Criminal Justice. E-mail:[email protected].
local parameter estimates and t-values generated from the GWR models to highlight some of the patterns of demographic context observed in our analysis.
CONCLUSIONS
GWR results indicate significant variation across Chicago census tracts in the estimates of logged percent black, immigrant concentration, and foreclosure for both robbery and burglary rates. The observed effects of socioeconomic disadvantage on robbery rates and residential stability on burglary rates also are found to vary across local neighborhood clusters in Chicago. Visual inspection of these effects illuminates the importance of supplementing current approaches by “thinking locally” when developing theoretical explanations and empirical models of how demographic context shapes crime rates.
1. Introduction
Crime and demography are related in complex and reciprocal ways (South and Messner 2000). Many aspects of social demography (e.g., the propensity to marry, decisions to move, family formation, socioeconomic stratification, and racial and ethnic community composition) have been shown to be influenced by involvement in crime (e.g., Wilson 1987; South and Deane 1993; Morenoff and Sampson 1997; Western 2006; Xie and McDowall 2010; Hipp 2011; King and South 2011). An even more common observation is that demography often serves as an important antecedent to crime. Several basic demographic features—age, sex, race and ethnicity, immigrant concentration, marriage, family structure, and residential mobility—have been linked to variation in criminal behavior among individuals (e.g., Greenberg 1985; Sampson and Laub 1993; Sampson and Lauritsen 1997; King, Massoglia, and Macmillan 2007) and differences in crime rates across time and space (e.g., Shaw and McKay 1942; Sampson and Groves 1989; Messner and Sampson 1991; Baumer 2008; Ousey and Kubrin 2009; Peterson, Krivo, and Hagan 2010). Finally, both involvement in crime and some of the core elements of demographic context (e.g., the distribution of people by income, race, and ethnicity) are often shaped by a common set of conditions, including enduring inequalities related to the distribution of resources, disparities in the application of government social controls, and significant cultural and economic shifts (Hirschman and Tolnay 2005; South and Messner 2000).
neighborhoods in Chicago during the last several years of the 2000s. A vibrant theoretical and empirical literature in the field of criminology highlights noteworthy relationships between several indicators of neighborhood demographic context— racial composition, immigrant concentration, and socioeconomic disadvantage— and neighborhood crime patterns (for a review, see Sampson and Lauritsen 1997). Residential instability also has been a regular demographic indicator in neighborhood crime models, surfacing most recently in a growing body of research that has focused on mounting home foreclosures, which may have implications not only for levels of crime (e.g., Immergluck and Smith 2006) but also may yield a significant spatial reshuffling of the population in local communities (Baxter and Lauria 2000; Li and Morrow-Jones 2010). However, despite the prominence of demography in the study of neighborhood crime patterns, much of the extant literature is limited in one important respect. Specifically, most neighborhood-level research on demography and crime has assumed spatial invariance in the parameters, an approach that is somewhat naïve and potentially misleading (see also Cahill and Mulligan 2007; Graif and Sampson 2009). The theoretical literature points to the possibility of significant spatial heterogeneity in the links between many indicators of demographic context and crime rates across neighborhoods. We advance previous research by explicitly assessing the merits of the typical “global” or “one size fits all” approach that has been applied in most neighborhood studies of demographic context and crime by juxtaposing it against an alternative strategy— geographically weighted regression (GWR)—that highlights the potentially significant “local” variability in model parameters.
2. “Global” contemporary neighborhood models of crime
There is a good deal of diversity in studies of neighborhood variability in crime rates. Recent scholarship has explored neighborhood spatial variation in crime across several U.S. cities (e.g., Austin, Charlotte, Chicago, Cincinnati, Cleveland, Columbus, New York City, St. Louis, San Diego, and Seattle) and has considered a wide variety of attributes. Among the factors considered in recent work are the prevalence of adult “business establishments” (Linz et al. 2004), the presence of illicit drug markets (Martinez, Rosenfeld, and Mares 2008) and licensed alcohol outlets (Roncek 1981; Peterson, Krivo, and Harris 2000; Pridemore and Grubesic 2011), legal cynicism (Kirk and Papachristos 2011), physical and social disorder (Sampson and Raudenbush 1999; Taylor 2001), order maintenance policing (Rosenfeld, Fornango, and Rengifo 2007), social ties, collective efficacy, and institutional strength (Sampson, Raudenbush, and Earls 1997; Bellair 2000; Triplett, Gainey, and Sun 2003), gentrification (Papachristos, et al. 2011), the density of commerce (Browning et al. 2010), and the implication of the “built environment” more generally (Matthews, et al. 2010). The diversity of concentration in recent neighborhood crime research has been balanced, however, by steady attention to a common set of demographic predictors of the spatial distribution of crime. Specific measurement strategies vary across studies, but, owing perhaps to its roots in the early Chicago School, virtually all neighborhood crime research entails consideration of the potential role of the distribution of populations by race/ethnicity and socioeconomic status, and of the influence of residential instability (Bursik and Grasmick 1993). Increasingly, the first of these factors has included assessments of nativity/immigrant status, with several recent studies focusing on the empirical connection between rates of immigration and crime (e.g., Akins, Rumbaut, and Stansfield 2009; Martinez, Stowell, and Lee 2010). Also, contemporary definitions of the second mentioned attribute, socioeconomic disadvantage (i.e., “concentrated disadvantage”), blend various indicators of economic adversity with indicators of family structures that tend to accompany and exacerbate economic stress (e.g., the prevalence of female-headed households). Finally, routine attention to residential instability in neighborhood crime studies has stimulated a growing interest in the potential effects of home foreclosures on crime in contemporary research (e.g., Immergluck and Smith 2006; Teasdale, Clark, and Hinkle 2011; Katz, Wallace, and Hedberg 2012).
and mounting foreclosures—emerge as vital components of contemporary theoretical models. With respect to empirical patterns, the published research in America has documented higher crime rates in neighborhoods where levels of socioeconomic disadvantage are greatest and where blacks tend to compose a larger share of the population (Sampson and Lauritsen 1994; Peterson et al. 2000; Hipp and Whitby Chamberlain 2011). Most research finds that levels of immigrant populations bear either no significant relationship (e.g., Akins et al. 2009) or are inversely associated with neighborhood crime rates (e.g., Graif and Sampson 2009; Stowell and Martinez 2009; Martinezet al. 2010). Results obtained for residential stability are contingent on a variety of other conditions. Early research routinely reported that neighborhood crime was lower in residentially-stable urban neighborhoods (Sampson and Lauritsen 1994), and many contemporary studies find a similar pattern (e.g., Kubrin, et al. 2011). However, other studies question the causal direction of the relationship (Boggess and Hipp 2010), some report no association (Veysey and Messner 1999; Bellair 2000), and some have found a positive relationship, especially for homicide (Sampson et al. 1997; Graif and Sampson 2009). The ambiguity surrounding the effects of residential stability has led scholars to suggest that “stability” may have unique meanings and implications for crime and other adverse outcomes depending on whether it arises by choice or circumstance (e.g., Warner and Rountree 1997; Ross, Reynolds, and Geis 2000). Finally, some recent research suggests a non-trivial positive association between neighborhood rates of foreclosure and crime (Immergluck and Smith 2006; Teasdale, Clark, and Hinkle 2011; Katz, Wallace, and Hedberg 2012), but it appears to be sensitive to model specification (Kirk and Hyra 2011).
3. Theoretical mechanisms and spatial heterogeneity in
neighborhood crime models
3.1 Theoretical mechanisms explaining the link between demographic context and crime rates
The dimensions of demographic context emphasized in this paper—racial composition, immigrant concentration, socioeconomic disadvantage, and residential instability (wrought by foreclosures or other processes)—have been linked to crime through a variety of theoretical processes, but in general, three primary mechanisms have been highlighted as proximate connections in the extant theoretical literature: neighborhood differences in levels of informal social control, neighborhood differences in values associated with the resolution of conflicts and the validity of the legal order, and neighborhood variation in perceived deprivation, frustration, and stress. The first two of these themes were prominent in the early Chicago School research on neighborhood variation in crime and deviance, and the third can be extracted from classic scholarship in the anomie/strain tradition. Each theme has been reiterated in contemporary scholarship as well (Sampson et al. 1997; Agnew 1999; Anderson 1999; Kirk and Popachristos 2011) even if rarely discussed together. Good summaries of these perspectives can be found in most contemporary criminology theory texts and they need not be reviewed thoroughly here. However, the key insight that emerges for the present study is that the effects of demographic context on crime are uniformly predicted to be indirect and/or contingent on the presence of other factors. In other words, from a theoretical vantage point, demographic context is not thought to represent some sort of criminogenic destiny for neighborhood environments.
(Anderson 1999; Patillo-McCoy 2000). Graif and Sampson (2009) articulate this general point well in their study of immigration and crime. They suggest that neighborhood levels of immigration could be positively, negatively, or unrelated to crime rates depending on the nature of the immigration streams and the social organization of the communities in which it occurs. Graif and Sampson (2009) show that the relationship between rates of immigration and crime across neighborhoods is locally contingent, and that a single global estimate of the association between these indicators can be misleading.
Research findings such as those presented by Graif and Sampson (2009) complicate the theoretical landscape and call into question the generalizations that tend to be drawn from many studies of neighborhood conditions and crime rates. In our judgment this is a good thing as it prompts us to reconsider untested assumptions about the non-stationarity of our empirical models and it leads us to focus more squarely on the most critical theoretical issues. In this specific instance, Graif and Sampson (2009) redirect the conversation away from whether immigration rates reduce (or increase) crime rates to a theoretically more productive exchange of the types of conditions that might be relevant to shaping the nature of observed immigration effects (negative or positive). We build on this logic and propose the broader possibility that the association between other indicators of neighborhood demographic context and crime rates also may be contingent on whether the former yield the implied mechanisms (e.g., weak informal social controls, distrust in the police, strong commitments to “street” codes, social alienation, and high levels of frustration) that are considered the key proximate neighborhood conditions that generate elevated levels of crime (see also Cahill and Mulligan 2007). Existing theories of neighborhood variation in crime focus on identifying “global” relationships, or patterns that might be anticipated to emerge across neighborhoods in general. The theoretical literature is thus not sufficiently developed to offer up a well-established list of reasons why the anticipated global relationships might differ locally, but we can suggest a variety of possibilities.
3.2 Spatial heterogeneity in relationships between demographic context and crime rates
that the magnitude and significance of the anticipated associations between neighborhood crime rates and racial composition and levels of socioeconomic disadvantage may be contingent on whether the latter conditions yield strong commitments to “street codes” (Anderson 1999) or are accompanied by strong public controls (Bursik and Grasmick 1993) or high levels of “collective efficacy” (Sampson et al. 1997). Indeed, even the protective benefits of high neighborhood collective efficacy have been shown to be contingent on the degree to which surrounding areas also exhibit strong doses of social cohesion and a thirst for engaging in informal social control (Morenoff, Sampson, and Raudenbush 2001). Similar arguments could be proffered for the theoretically-expected effects of residential instability and contemporary factors that overlap with it, including foreclosure rates. For example, neighborhoods that are residentially stable by choice (i.e., because they are desirable places to live) are probably better equipped to invoke the needed doses of informal social control to keep crime at a minimum, while neighborhoods that are stable because of external constraints to mobility among residents (e.g., racial discrimination in housing markets, economic inequalities that limit social mobility, etc.) may struggle to do so. Consistent with this general idea, Ross, Reynolds, and Geis (2000) show that residential stability reduces distress in affluent neighborhoods, but raises it in disadvantaged neighborhoods. Warner and Rountree (1997) report parallel findings with respect the role of residential stability in shaping rates of assault and burglary.
The purpose of this paper is not to formally sketch the myriad ways in which global models of the influence of demographic context on neighborhood crime might generate an incomplete portrait of the complex patterns that could exist. This clearly is an important next step in the theoretical literature, but our goals are much more modest. From a theoretical vantage point, we echo other scholars who recently have directed attention to the potential limits of only “thinking globally” when modeling the effects of demographic context on neighborhood crime patterns (Cahill and Mulligan 2007; Graif and Sampson 2009). Substantively, we focus on illustrating the empirical implications of thinking both globally and locally in carefully modeling the effects of key indicators of demographic context on neighborhood crime rates. We then use the empirical results obtained as a platform from which to inform some potentially fruitful modifications to existing theoretical approaches.
in an efficient manner, several potential instances of spatial variance in commonly considered relationships. As we illustrate in the remainder of the paper, GWR permits a comprehensive assessment of the degree to which demographic indicators exhibit effects on neighborhood crime that vary spatially. We adopt this approach in the present study and use the results as a lens through which to inform existing theoretical explanations and to envision more targeted types of conditional analyses.
4. The present study
4.1 Data and samples
Our assessment of spatial heterogeneity in contemporary models of neighborhood crime rates focuses on evaluating the effects of selected indicators of demographic context–racial composition, immigrant concentration, socioeconomic disadvantage, residential instability, and the recent rise in foreclosure rates–on robbery, burglary, and homicide rates across Chicago neighborhoods. Chicago is a particularly useful research site to assess the spatial heterogeneity of neighborhood crime predictors, for it is by far the most common location in which “global” models have been developed. The analysis integrates data on crime rates across Chicago census tracts as reported to the Chicago Police Department (CPD) with demographic data from the American Community Survey (ACS), foreclosure data from RealtyTrac, and vacancy data from the U.S. Department of Housing and Urban Development (HUD) and the U.S. Postal Service (USPS).
are not available annually, and which we assume reflects conditions present in approximately the mid-point of the period covered in these data (i.e., 2007).
We base our analysis on census tracts that fall wholly or partly within the city of Chicago, defined by 2009 city boundary definitions. The 2005-2009 ACS data contain 881 census tracts that meet this criterion. To minimize instability in the estimation of crime rates and other indicators, we exclude census tracts with populations of less than 100 persons (see also Graif and Sampson 2009), yielding a maximum potential sample of 825 tracts. We were able to obtain data on crime and the other included variables for 813 of these tracts and, as elaborated below, this serves as our baseline estimation sample. Descriptive statistics and inter-item correlations among the variables included in the analysis are displayed in Appendix A. Our homicide models are based on the full sample (n=813). However, as we elaborate below, preliminary GWR models for burglary and robbery indicated significant areas of ill-fit in this sample, thus stimulating the estimation of “robust” geographically weighted regression (RGWR) models in which the analysis samples are somewhat smaller for these crime types. Therefore, the analysis sample for the burglary models is based on 805 tracts and the sample for robbery is based on 797 tracts.
4.2 Measures
Table 1 presents definitions of the core variables included in our analysis. As the table shows, we focus on modeling neighborhood variation in three crime types (robbery, burglary, and homicide) that have been linked to indicators of demographic context in previous research. Tract-level counts for these crimes were obtained from the CPD and rates were computed using five-year estimates (2005-2009) of the relevant population at risk from the ACS. Rates for robbery and homicide represent the number of known offenses per 100,000 residents. Burglary rates refer to the number of burglaries per 100,000 housing units. As is typical, the measures of crime in our neighborhood sample were highly skewed. We therefore applied a log transformation to reduce possible bias.
foreclosure rates (per 1,000 housing units) between 2007 and 2009. In the models displayed below, we regress crime rates in 2009 on both the base level of foreclosure rates in 2007 and the change in foreclosure rates between 2007 and 2009 while also controlling for base levels of crime rates (described below). This strategy yields an assessment of whether recent changes in foreclosure are associated with recent changes in crime (see also Kirk and Hyra 2011), and minimizes the effects of omitted time-stable variables (e.g., Kessler and Greenberg 1981; Miethe, Hughes, and McDowall 1991).
The other key explanatory variables are drawn from the ACS pooled 2005-2009 census tract file, and thus are available only at a single temporal point that can be described as the mid-point of the period encompassed by these data (i.e., 2007). We use the ACS tract-level data to construct multi-item indices of residential stability, immigrant concentration, and socioeconomic disadvantage. Our measure of residential stability is a three-item standardized scale combining the percentage of owner-occupied units; the percentage of the population over 1 year old living in the same household the previous year; and the percentage of owners and renters in occupied housing units that moved into their current residence prior to 2000 (α=0.686). Immigrant concentration is a standardized index comprised of the percentage of the population who are foreign-born and the percentage of the Latino population (α=0.865). Finally, we measure socioeconomic disadvantage with a four-item standardized index containing the percentage of families below the poverty level, the percentage of female-headed households, the percentage of households receiving public assistance or food stamps, and the percentage of the population who are unemployed (α=0.898). Although neighborhood research sometimes has incorporated percent black as a component of socioeconomic disadvantage indices (e.g., Bellair 2000; Morenoff et al. 2001), racial composition and socioeconomic disadvantage are distinct conceptually (Peterson et al. 2010) and, accordingly, we include a logged transformed measure of percent black as a separate indicator of demographic context.
violence (Rosenfeld 2009). Finally, all of the models estimated incorporate measures of prior crime, defined for the year 2007. Doing so helps to account for prior sources of 2009 crime rates not captured by our measured variables, and yields an assessment of the relationship between demographic context and short-term changes in crime rates (between 2007 and 2009).
Table 1: Description of variables included in the analysis of demography, foreclosure, and crime
Variable Variable definition and data source(s)
Robbery rate, 2009 (logged) Number of robberies known to the police per 100,000 residents. Data sources: Chicago Police Department (CPD),
American Community Survey (ACS)
Burglary rate, 2009 (logged) Number of burglaries known to the police per 100,000 housing units. Data sources: CPD, ACS
Homicide rate, 2009 (logged)
Number of homicides known to the police per 100,000 residents. Data sources: CPD, ACS
Change in logged REO foreclosure rates, 2007-2009
Change in the number of Real Estate Owned (REO) properties per 1,000 housing units between 2007 and 2009. Data source: RealtyTrac
Residential stability Three-item standardized scale combining the percentage of owner-occupied units (2005-2009), the percentage of the population over 1 year old living in the same household one year ago (2005-2009), and the percentage of owners and renters in occupied housing units that moved into their current residence prior to 2000 (computed by subtracting the combined percentages of owners and renters who had reported moving between 2000-2004 and after 2005 from 100). Data source: ACS
Table 1: (Continued)
Variable Variable definition and data source(s)
Socioeconomic disadvantage
Four-item standardized scale combining the percentage of families below the poverty level (2005-2009), the percentage of female-headed households (2005-2009), the percentage of families receiving public assistance or food stamps (2005-2009), and the percentage of the population who are unemployed (2005-2009). Data source: ACS
Percent black (logged) Log-transformed percentage of the population who are non-Latino black (2005-2009). Data source: ACS
Population size and density Two-item standardized scale combining the log-transformed population size (2005-2007) and the log-transformed population density. Data source: ACS
Percent divorced Percentage of the population ages 15 and older who are divorced (2005-2009). Data source: ACS
Age structure Percentage of the population ages 15-29 (2005-2009). Data source: ACS
Pre-existing vacancy rate (logged)
Percentage of housing units vacant 90 days or longer, as of first quarter 2007. Data source: U.S. Department of Housing and Urban Development aggregated U.S. Postal Service data on address vacancies
Logged REO foreclosure rate, 2007
Number of REO properties per 1,000 housing units in 2007. Data source: RealtyTrac
Acquisitive crime rate, 2009 (logged)
Number of burglaries, robberies, and motor vehicle thefts known to the police per 100,000 residents. Data sources: CPD, ACS
4.3 Analytical strategy
using both Ordinary Least Squares (OLS) and Maximum Likelihood (ML) spatial regression estimators (see also Graif and Sampson 2009).The OLS and spatial regressions are “global” models in the sense that they both assume that a single set of parameters sufficiently describe the relationships between neighborhood demographic context and crime rates in Chicago. As noted in section 3, the global estimates obtained from these models may be biased if there is significant variability in the parameters across localized areas within the city. We assess this possibility by estimating GWR models to test for spatial heterogeneity in the effects of demographic context and the other predictors and formally testing, through a comparison of corrected Akaike Information Criterion (AICc) statistics, whether these “local” models yield a significant improvement in fit over the global models.3 As reported in section 5.2, we find consistent evidence that this is the case in Chicago, and so we accordingly present GWR results that summarize the variability in the estimated local parameters.
As elaborated more fully in Fotheringham, Brunsdon, and Charlton (2002), the basic GWR model we fit is of the form:
yi= β0i+ β1idemographic attribute1 + β2idemographic attribute2 + βnixn + εi (1)
where i signals specific spatial locations (in our study, Chicago census tracts) at which parameters are estimated. The local (census tract-specific) coefficients are obtained with the following estimator:
Y
W
X X W
X i
T i T i
1
) (
ˆ = −
β (2)
where Y is a vector of dependent variables, Wi is a matrix of weights specific to
census tract i, with observations nearer i attributed greater weight than more distal observations. Although there are a variety of possible spatial weighting functions (Wi) that might be used (see Wheeler and Páez 2010), we apply a continuous
weighting scheme with an adaptive bandwidth to obtain estimated local parameters. We use nearest neighbor weighting with a bi-square decay function, defined as:
Wij = [1-(dij/b)2]2 if j represents the Nth nearest neighbor of i, = 0 if j otherwise (3)
where i represents specific data points (i.e., census tracts) for which we estimate local regression parameters, j references data points to be encompassed within the local estimations, and b refers to the entirety of the spatial area, or “bandwidth,” that
defines the localized parameters. As detailed by Fotheringham et al. (2002: 58), this function spatially weights data from the regression point (i.e., census tract) up to distance b (defined to the Nth nearest neighbor), with weights of 0 applied beyond b. This approach seems logical in light of our interest in assessing whether demographic attributes yield spatially divergent relationships with crime rates within localized areas of Chicago. We identify the Nth nearest neighbor, which defines the “optimal” localized samples, using a bias-corrected AICc test (see Fotheringham et al. 2002). As elaborated in section 5, examination of model diagnostics of the GWR equations for robbery and burglary motivates the estimation of subsequent models in which points of exceptionally poor fit are excluded from the optimally-defined bandwidths (see also Harris, Fotheringham, and Juggins 2010).
5. Results
5.1. Global OLS and spatial regression models
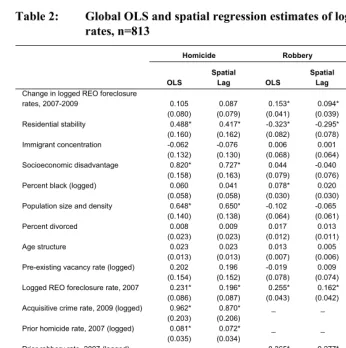
The standard approach to estimating neighborhood crime empirical models is to apply a “global” regression framework, most often OLS regression but increasingly ML spatial regression models, to account for the routinely observed spatial autocorrelation that tends to be present. Not surprisingly, preliminary estimations of Moran’s I using a row-standardized inverse distance squared weight matrix revealed significant spatial autocorrelation for each of the crime measures examined in our data, net of the explanatory and control variables. Evaluation of Lagrange Multiplier (LM) tests indicated that the spatial lag model provided the best fit to the data, a common pattern observed in studies of neighborhood crime rates in Chicago. In Table 2, we present estimates of both the OLS and spatial lag “global” models for our three crime measures.4 As these models show, we observe significant spatial autocorrelation in our data even after controlling for other factors. Focusing on the spatial lag models, the results of our analysis of neighborhood variation in homicide rates across Chicago neighborhoods largely parallel those reported in prior studies. We find that homicide rates are unrelated to levels of immigrant concentration and they are greatest in neighborhoods that are characterized by high levels of
socioeconomic disadvantage and high levels of residential stability (e.g., Sampson and Morenoff 2004; Graif and Sampson 2009; Browning et al. 2010). Controlling for other factors, homicide rates are not significantly associated with neighborhood racial composition for this sample of Chicago census tracts.
The spatial lag models for robbery and burglary, reported in Table 2, reveal a different set of patterns, both compared to one another and to the homicide results. As noted in section 2, the vast majority of neighborhood studies have focused on homicide, and the relatively small body of research that has considered other crimes, including robbery and burglary (e.g., Sampson and Raudenbush 1999; Bellair 2000; Velez 2001; Bernasco and Luykx 2003; Browning et al. 2010) differ notably in methods, specification, and study sites, making it difficult to extract a uniform “global” pattern from prior work. Nonetheless, our results are consistent with those reported by others who have employed similar specifications; we find no significant effects of neighborhood socioeconomic disadvantage on rates of robbery (e.g., Rosenfeld et al. 2007) and no significant effects of percent black and immigrant concentration on robbery (Browning et al. 2010) or burglary rates (Sampson and Raudenbush 1999). The global spatial lag models suggest that residential stability is associated with significantly lower robbery rates, but it is not associated significantly with burglary rates, a pattern also observed by Sampson and Raudenbush (1999) with data for Chicago neighborhoods from the mid-1990s. Finally, net of a wide array of controls, including prior levels of crime, robbery rates in 2009 are significantly higher in neighborhoods that experienced greater increases in logged foreclosure rates between 2007 and 2009. No such pattern was observed in the homicide and burglary spatial lag models, but it is worth noting that the strong association between acquisitive crime and homicide, coupled with the significant effects of foreclosure on robbery, imply that there is the potential for significant indirect effects of foreclosure on lethal violence.
the data, the global empirical estimates may be biased. To explore this issue, we estimated GWR models of homicide, robbery, and burglary with an eye toward identifying whether (a) local models yield a significant improvement in model fit over the global models and (b) whether the effects of the indicators of demographic context exhibit significant spatial heterogeneity.
Table 2: Global OLS and spatial regression estimates of logged crime rates, n=813
Homicide Robbery Burglary
OLS Spatial Lag OLS Spatial Lag OLS Spatial Lag
Change in logged REO foreclosure
rates, 2007-2009 0.105 0.087 0.153* 0.094* 0.066* 0.038
(0.080) (0.079) (0.041) (0.039) (0.026) (0.025) Residential stability 0.488* 0.417* -0.323* -0.295* 0.090 0.012
(0.160) (0.162) (0.082) (0.078) (0.052) (0.050) Immigrant concentration -0.062 -0.076 0.006 0.001 0.005 -0.001
(0.132) (0.130) (0.068) (0.064) (0.043) (0.041) Socioeconomic disadvantage 0.820* 0.727* 0.044 -0.040 -0.014 -0.103*
(0.158) (0.163) (0.079) (0.076) (0.051) (0.050) Percent black (logged) 0.060 0.041 0.078* 0.020 0.002 -0.016
(0.058) (0.058) (0.030) (0.030) (0.019) (0.018) Population size and density 0.648* 0.650* -0.102 -0.065 -0.045 -0.025
(0.140) (0.138) (0.064) (0.061) (0.041) (0.039) Percent divorced 0.008 0.009 0.017 0.013 -0.003 -0.003
(0.023) (0.023) (0.012) (0.011) (0.008) (0.007)
Age structure 0.023 0.023 0.013 0.005 -0.007 -0.008
(0.013) (0.013) (0.007) (0.006) (0.004) (0.004) Pre-existing vacancy rate (logged) 0.202 0.196 -0.019 0.009 0.269* 0.278*
(0.154) (0.152) (0.078) (0.074) (0.050) (0.048) Logged REO foreclosure rate, 2007 0.231* 0.196* 0.255* 0.162* 0.130* 0.080*
(0.086) (0.087) (0.043) (0.042) (0.028) (0.028) Acquisitive crime rate, 2009 (logged) 0.962* 0.870* _ _ _ _
(0.203) (0.206)
Prior homicide rate, 2007 (logged) 0.081* 0.072* _ _ _ _
(0.035) (0.034)
Prior robbery rate, 2007 (logged) _ _ 0.365* 0.277* _ _
(0.034) (0.034)
Prior burglary rate, 2007 (logged) _ _ _ _ 0.507* 0.433*
(0.032) (0.032)
Constant -9.324* -8.367* 2.911* -0.251 3.314* -0.363
(1.513) (1.573) (0.322) (0.478) (0.293) (0.553)
Spatial lag _ 0.211* _ 0.688* _ 0.574*
(0.108) (0.080) (0.075)
Adjusted R2 0.282 0.297 0.379 0.444 0.415 0.466
5.2. GWR models
As we hinted in section 4.3, preliminary estimation of GWR models for robbery and burglary produced high standardized residuals, or problematic outliers, for a small number of observations. Following Harris et al. (2010), we subsequently estimated robust models for these crime types by removing cases with standardized residuals with an absolute value greater than 5, a procedure that reduced the overall sample size for robbery to 797 and burglary to 805.5 The optimal bandwidth (i.e., local sample size) derived from these procedures in our analysis was 687 for homicide, 123 for robbery, and 199 for burglary.
Table 3 presents the results of the GWR model of homicide and the RGWR models of robbery and burglary. Before describing the substantive patterns that emerge in the geographically weighted models, we highlight two more general features of the models reported. First, the bottom portion of the table displays AICc values obtained from the “local” geographically weighted regressions (AICc GWR) and the parallel “global” OLS regressions (AICc global regression). For the robbery and burglary models, the AICc GWR values are substantially smaller than the AICc global regression values (AICc difference for robbery=357.951; AICc difference for burglary=95.994), indicating that the geographically weighted models provide a significant improvement in fit compared to the global models. The difference between the AICc GWR and AICc global estimates are smaller for homicide (AICc difference=11.678), but still well above the standard cutoff of 3 used in the literature to designate superior model fit (see Charlton and Fotheringham 2009). Second, it is noteworthy that the geographically weighted models displayed in Table 3 serve as a useful method for addressing the spatial autocorrelation of crime across Chicago census tracts. Specifically, post-estimation diagnostics of the residuals from the geographically weighted models reported in the table indicate no significant spatial autocorrelation for homicide (Moran’s I= -0.006, p >.05) and robbery (Moran’s I= -0.018, p >.05). We continue to observe statistically significant spatial autocorrelation for burglary, but the associated Moran’s I value is very small (0.022).
Do the indicators of demographic context considered in our study exhibit significant spatial heterogeneity within Chicago? Table 3 addresses this question by showing for each of our indicators of demographic context the median coefficient
obtained across all census tracts [in brackets], and the estimated coefficients that represent the 25th and 75th percentiles of the neighborhood-specific distribution of coefficients (in parentheses). We denote instances of statistically significant spatial heterogeneity with an asterisk, as determined by Monte Carlo significance tests, and we highlight some patterns visually by mapping the local parameter estimates as well as their distributions (Fotheringham et al. 2002).
Table 3: Geographically weighted regression estimates of logged crime rates
Homicide Robbery Burglary
Change in logged REO foreclosure
rates, 2007-2009 [0.091] [0.043]* [0.073]*
(0.060, 0.138) (0.0001, 0.112) (0.009, 0.126)
Residential stability [0.490] [-0.024] [0.048]*
(0.416, 0.529) (-0.199, 0.071) (-0.045, 0.129)
Immigrant concentration [-0.073] [-0.085]* [-0.012]*
(-0.173, 0.088) (-0.168, -0.001) (-0.068, 0.046)
Socioeconomic disadvantage [0.851] [0.094]* [0.033]
(0.623, 0.976) (-0.017, 0.264) (-0.013, 0.086)
Percent black (logged) [0.049] [0.005]* [0.001]*
(0.030, 0.061) (-0.047, 0.050) (-0.024, 0.032)
Population size and density [0.756]* [-0.188] [-0.001]
(0.533, 0.991) (-0.271, -0.089) (-0.038, 0.041)
Percent divorced [-0.002] [0.009] [0.0003]
(-0.009, 0.015) (-0.0004, 0.021) (-0.010, 0.009)
Age structure [0.026] [-0.001] [-0.002]
(0.023, 0.032) (-0.007, 0.007) (-0.007, 0.001)
Pre-existing vacancy rate (logged) [0.205] [0.017] [0.030]
(0.151, 0.264) (-0.090, 0.134) (-0.030, 0.119) Logged REO foreclosure rates, 2007 [0.26] [0.076]* [0.099]*
(0.183, 0.279) (-0.0003, 0.159) (0.022, 0.137)
Acquisitive crime rate, 2009 (logged) [1.110]* _ _
(0.845, 1.350)
Prior homicide rate, 2007 (logged) [0.125]* _ _
(0.018, 0.158)
Prior robbery rate, 2007 (logged) _ [0.277] _
(0.155, 0.563)
Prior burglary rate, 2007 (logged) _ [0.515]*
(0.433, 0.619)
Constant [-10.530]* [3.839]* [3.419]*
(-12.373, -8.259) (2.177, 4.704) (2.670, 4.238)
Adjusted R2 0.305 0.794 0.747
AICc global regression 3950.664 1987.736 1103.987
AICc GWR 3938.986 1629.785 1007.993
Local sample size 687 123 199
N 813 797 805
The median coefficient estimates in Table 3 show, among other things, that some of the indicators of demographic context exhibit different patterns in the geographically weighted results than were observed in the global models. Specifically, the global models for robbery and burglary (Table 2) suggest no significant effects of immigrant concentration. However, the RGWR specifications reveal significant negative effects of immigration on neighborhood robbery and burglary rates that are consistent with other recent empirical work and contemporary theoretical arguments (e.g., Martinez et al. 2010). A similar pattern is observed for homicide, though the GWR estimate in this instance does not quite attain statistical significance. Additionally, the local models suggest a significant positive relationship for the percentage of the black population for both burglary and robbery rates, a relationship masked by the global models presented in Table 2.6 Like the effect of immigrant concentration on homicide, the effect of racial context does not reach significance in the GWR estimates for homicide.
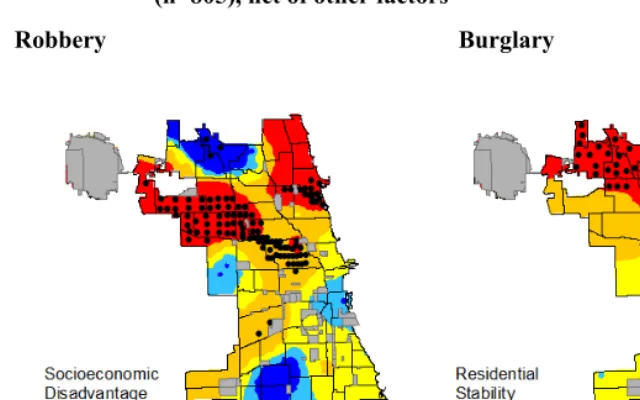
The other demographic indicators considered in this analysis exhibit greater comparability in “average” effects for the global and local specifications, but several appear to exhibit significant spatial variability within Chicago, as evidenced by the estimated interquartile intervals for the local coefficients displayed in Table 3. For example, a commonly considered predictor of aggregate-level variation in crime—socioeconomic disadvantage—exhibits significant spatial variance in its effect on robbery rates across local neighborhood clusters (n=123) within Chicago, yielding estimated unstandardized coefficients that range from below -0.017 (the 25th percentile) to greater than 0.264 (the 75th percentile). A similar pattern is observed for the effects of residential stability in the burglary model, where the RGWR models reveals a significant positive median coefficient overall [β= 0.048], but the inter-quartile estimates point to a high degree of variability in the estimated effect (i.e., from -0.045 to 0.129) across local neighborhood clusters (n=199).
We illustrate the nature of the effects of socioeconomic disadvantage on robbery and residential instability on burglary visually in Figure 1, which maps the RGWR estimated coefficients for each of the census tracts included in the models. In these and all other maps presented herein, we display the geographic distribution of the localized coefficients using quintiles to define categories; census tracts with the smallest values are designated in shades of blue and those with the largest values are shaded in red. Black dots denote estimates for census tract centroids that emerge as statistically significant based on Monte Carlo tests. To enhance the visual
presentation, we overlay on the map boundaries for 77 historically meaningful Chicago community areas.
Figure 1 yields a somewhat paradoxical pattern when juxtaposed against extant theoretical frameworks, which guide and are largely informed by global empirical models. Specifically, socioeconomic disadvantage is a particularly strong predictor of robbery rates for a large swath of neighborhoods in northeast Chicago. Based on the 2005-2009 ACS data, this is one of the more racially and economically heterogeneous areas of the city, where census tracts with relatively heavy concentrations of foreign-born populations are geographically proximate to several tracts with large relative black populations. This is also a region of the city that contains a diverse mix of census tracts with respect to levels of social and economic disadvantage, with large numbers of neighborhoods scoring high on our socioeconomic disadvantage index near many that score quite low on the index. In contrast, we see a much weaker association between socioeconomic disadvantage and robbery in the southeastern section of Chicago, and even several instances of negative relationships in this region. This area encompasses several neighborhoods in which the population is predominantly black and many of these neighborhoods have exhibited high levels of socioeconomic disadvantage for several decades and are, in many ways, socially isolated from other areas (Morenoff and Sampson 1997). Robbery rates are relatively high in this region of the city, but our data indicate that there is not a significant association between levels of robbery and levels of socioeconomic disadvantage across tracts within the region.
Figure 1: Socioeconomic disadvantage parameter estimates for robbery (n=797) and residential stability parameter estimates for burglary (n=805), net of other factors
Robbery Burglary
clusters that yield divergent effects of residential stability on burglary rates exhibit levels of residential stability that are quite similar, they are embedded within regions that represent stark contrasts with respect to housing conditions and in which “residential stability” appears to denote qualitatively different things. The two neighborhood clusters exhibit roughly comparable median housing values, but the Southside neighborhoods in which residential stability is negatively associated with burglary are adjacent to a region that exhibits relatively high residential stability in the context of relatively low incomes and median housing values as documented by the Illinois Real Estate Market Pulse (Chicago Rehab Network, personal communication, August 15, 2011), and the highest rates of vacancies and other “red flag” properties in the city (Smith and Duda 2011). Thus, the “more residentially stable” areas to which these neighborhoods are proximate do not represent places that are likely to be attractive to would-be burglars. In contrast, the neighborhoods for which residential stability is positively associated with burglary encompass or are adjacent to areas in which the highest levels of residential stability are found in neighborhoods with relatively high median incomes and housing that would likely be perceived as highly attractive to burglars, at least based on considerations of potential yield.
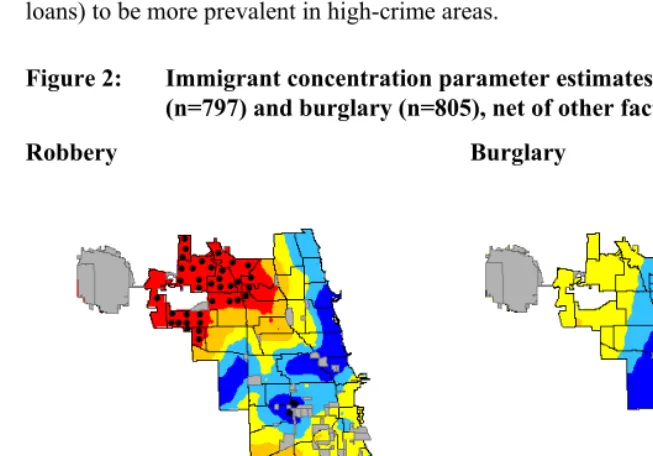
The RGWR estimates for robbery and burglary also reveal statistically significant spatial heterogeneity in the effects of immigrant concentration, which we depict visually in Figure 2. Though the specific geographic patterns shown in this figure differ from the GWR patterns for immigrant concentration effects on homicide reported for Chicago earlier in the 2000s by Graif and Sampson (2009), the general conclusions implied by our results are similar. The “protective” (i.e., significant negative) effects of immigration on crime appear to emerge only in particular contexts, and specifically for neighborhoods located in South (for burglary) and West Chicago (for robbery), areas that tend to be nested within larger contexts of relatively high socioeconomic disadvantage, a larger share of black residents, and elevated crime. This is an interesting pattern warranting continued attention in the theoretical literature. However, our results for robbery and burglary, along with those reported by Graif and Sampson (2009) for homicide, also indicate that the protective effects of immigration commonly referenced in the literature do not operate uniformly across the geographic landscape of Chicago, including some of the city’s neighborhoods in which immigrant concentration is prevalent (e.g., those located in the northwest and far north).
data from the early part of the 2000s. Kirk and Hyra (2011) subsequently extended Immergluck and Smith’s (2006) research in Chicago by using longitudinal data on foreclosure and crime and applying dynamic regression modeling, ultimately finding no significant association between foreclosure and crime. Kirk and Hyra (2011) attribute the primary divergence between their estimates and the findings reported by Immergluck and Smith (2006) to differences in empirical specification. Further, their results provide compelling evidence that foreclosure rates do not exhibit significant effects on subsequent crime rates after accounting indirectly for the tendency of some of the strongest predictors of foreclosure (e.g., sub-prime loans) to be more prevalent in high-crime areas.
Figure 2: Immigrant concentration parameter estimates for robbery (n=797) and burglary (n=805), net of other factors
Robbery Burglary
burst and foreclosures spiked (i.e., 2007 through 2009).7 The results displayed in Table 3 provide an important caveat to the debate on the implications of the recent foreclosure crisis for neighborhood crime rates in Chicago by reframing the question from whether there is a “global” relationship between foreclosure and crime to how and why this phenomenon might be associated in some contexts but perhaps not others.
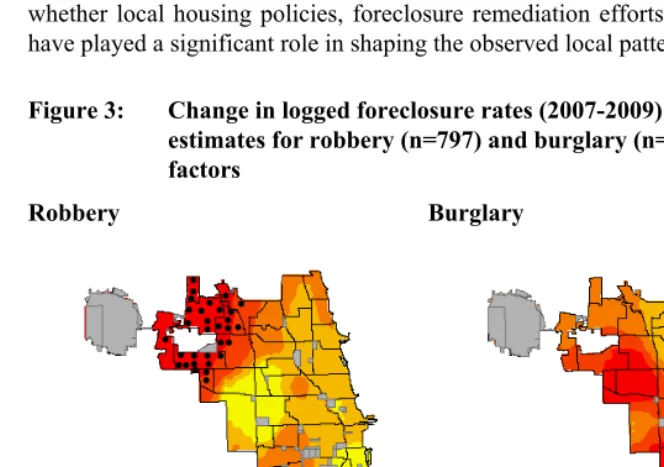
Table 3 suggests that the estimated effects of changes in foreclosure between 2007 and 2009 on robbery and burglary rates during this period vary significantly across local neighborhood clusters and was not uniformly statistically significant. We display these results visually in the maps shown in Figure 3. Given the substantive attention devoted in the previous foreclosure research in Chicago to the potential for spuriousness (Kirk and Hyra 2011), we adopt a conservative approach by computing adjusted t-statistics for purposes of judging statistical significance of the parameters that represent the local effects of recent shifts in foreclosure on robbery and burglary. This method adjusts the Monte Carlo estimated t-statistics for the multiple testing that is inherent in the RGWR models (Byrne, Charlton, and Fotheringham 2009), which is important when moving beyond exploratory analyses and drawing specific inferences from these models.
Figure 3 illuminates a pattern that is consistent with the findings reported both by Immergluck and Smith (2006) and by Kirk and Hyra (2011). It shows that for both robbery and burglary, recent increases in foreclosure have not been germane to increases in crime across much of Chicago. However, there are notable sectors of the city in which foreclosure appears to have been highly influential in yielding elevated crime rates. The pattern for robbery yields a noticeable link to the distribution of Chicago’s population by race and ethnicity; the two neighborhood clusters in which foreclosure changes are positively associated with robbery encompass neighborhoods of heavy immigrant concentration (the northwest) and predominantly black populations (the southwest). The burglary map yields a less obvious pattern, but the two clusters of significant positive local effects of foreclosure have at least one feature in common—very high rates of poverty and unemployment. Yet, the findings shown here also suggest that narrowly construed theoretical arguments that link foreclosure and crime through processes such as disorder, socioeconomic disadvantage, and neighborhood decline do not capture the full story. Though some of the areas in which foreclosure yields a significant positive association between foreclosure and crime might be characterized as places
in which disorder and decline are relatively high on the basis of high levels of poverty and dwelling abandonment (e.g., North Lawndale), others that also yield positive associations between foreclosure and crime are far from being characterized in that way (e.g., Edison Park). Equally pertinent is that many neighborhoods in Chicago that exhibit the highest rates of structural disadvantage and which have been hit relatively hard by foreclosure have not experienced significant increases in crime. Theoretical discussions of foreclosure and crime would thus be strengthened by moving beyond simple disorder, disadvantage, and decline arguments. Additional empirical analyses of the noted spatial heterogeneity in the link between foreclosure and crime also would be useful. Our analysis provides an admittedly cursory assessment of the possible explanation for the observed local variability in the nature of how the recent foreclosure crisis has influenced crime rates, but we think it illustrates the potential utility of exploring the matter further. It would be worthwhile, for example, to formally examine whether local housing policies, foreclosure remediation efforts, or other dynamics have played a significant role in shaping the observed local patterns.
Figure 3: Change in logged foreclosure rates (2007-2009) parameter estimates for robbery (n=797) and burglary (n=805), net of other factors
6. Conclusion
The goal of this study was to assess the role of demographic context in contemporary models of neighborhood crime rates while exploring spatial heterogeneity across a sample of Chicago census tracts. Drawing from the extant literature assessing “global” models of crime, we suggested that the assumption of non-stationarity in “global” empirical models might dissuade researchers from exploring more nuanced ways in which demographic context and crime rates may be related. We demonstrate this point by employing GWR and regressing 2009 neighborhood crime rates (homicide, robbery, and burglary) on several demographic explanatory variables—racial composition, immigrant concentration, socioeconomic disadvantage, residential stability, and foreclosure—controlling for other factors. Specifications of our contemporary models of neighborhood crime rates indicated that geographically-weighted estimations provided a better fit to the data (over “global” OLS models) and they revealed evidence of significant spatial heterogeneity among many of our variables of interest across the city of Chicago. To summarize briefly, we found significant variation in the local parameter estimates for both burglary and robbery for logged percent black and immigrant concentration, and significant local variation in the effects of socioeconomic disadvantage on robbery rates and residential stability on burglary rates. In each case, the local variability suggested both positive and negative estimates across the city, implying that the “global” patterns emphasized in the extant literature for these measures do not fully capture the empirical complexity that exists. Further, we found significant variation in our measure of foreclosure (the change in logged REO foreclosures from 2007 to 2009) on both robbery and burglary, providing important context for recent research findings that have yielded disparate conclusions regarding the link between foreclosure and crime in the city of Chicago (i.e., Immergluck and Smith 2006; Kirk and Hyra 2011).
7. Acknowledgements
References
Agnew, R. (1999). A general strain theory of community differences in crime rates. Journal of Research in Crime and Delinquency 36(2): 123-155. doi:10.1177/0022427899036002001.
Akins, S., Rumbaut, R.G., and Stansfield, R. (2009). Immigration, economic disadvantage and homicide: A community-level analysis of Austin, Texas. Homicide Studies 13(3): 307-314.doi:10.1177/1088767909336814.
Anderson, E. (1999). Code of the street: Decency, violence, and the moral life of the inner city. New York: W. W. Norton & Company.
Associated Press (2007). Squalor, crime follow wave of foreclosures. http://www.msnbc.msn.com/id/21773482/. (last accessed April 11, 2012). Baller, R.D., Anselin, L., Messner, S.F., Deane, G., and Hawkins, D.F. (2001).
Structural covariates of U.S. county homicide rates: Incorporating spatial effects. Criminology 39(3): 561-588. doi:10.1111/j.1745-9125.2001.tb00 933.x.
Baumer, E.P. (2008). An empirical assessment of the contemporary crime trends puzzle: A modest step toward a more comprehensive research agenda. In: Goldberger, A. and Rosenfeld, R. (eds.). Understanding crime trends. Washington, D.C.: National Academies Press: 127-176.
Baxter, V. and Lauria, M. (2000). Residential mortgage foreclosure and neighborhood change. Housing Policy Debate 11(3): 675-699.doi:10.1080/ 10511482.2000.9521382.
Bellair, P.E. (2000). Informal surveillance and street crime: A complex relationship. Criminology 38(1): 137-170.doi:10.1111/j.1745-9125.2000.tb00886.x.
Belsley, D.A., Kuh, E., and Welsch, R.E. (1980). Regression diagnostics: Identifying influential data and sources of collinearity. Hoboken: John Wiley & Sons, Inc.doi:10.1002/0471725153.
Boggess, L.N., and Hipp, J.R. (2010). Violent crime, residential instability and mobility: Does the relationship differ in minority neighborhoods? Journal of Quantitative Criminology 26(3): 351-370. doi:10.1007/s10940-010-9093-7.
Browning, C.R., Byron, R.A., Calder, C.A., Krivo, L.J., Kwan, M-P., Lee, J-Y., and Peterson, R.D. (2010). Commercial density, residential concentration, and crime: Land use patterns and violence in neighborhood context. Journal of Research in Crime and Delinquency 47(3): 329-357. doi:10.1177/0022 427810365906.
Bursik, R.J., Jr. and Grasmick, H.G. (1993). Neighborhoods and crime: The dimension of effective community control. New York: Lexington Books. Byrne, G., Charlton, M., and Fotheringham, A.S. (2009). Multiple dependent
hypothesis tests in geographically weighted regression. Paper presented at the 10th International Conference on GeoComputation, Sydney, Australia, November 30-Decemeber 2 2009.
Cahill, M. and Mulligan, G. (2007). Using geographically weighted regression to explore local crime patterns. Social Science Computer Review 25(2): 174-193.doi:10.1177/0894439307298925.
Fotheringham, A.S., Brunsdon, C., and Charlton, M. (2002). Geographically weighted regression: The analysis of spatially varying relationships. Chichester: John Wiley & Sons, Inc.
Graif, C. and Sampson, R.J. (2009). Spatial heterogeneity in the effects of immigration and diversity on neighborhood homicide rates. Homicide Studies 13(3): 242-260.doi:10.1177/1088767909336728.
Greenberg, D.F. (1985). Age, crime, and social explanation. American Journal Sociology 91(1): 1-21. doi:10.1086/228242.
Harris, P., Fotheringham, A.S., and Juggins, S. (2010). Robust geographically weighted regression: A technique for quantifying spatial relationships between freshwater acidification critical loads and catchment attributes. Annals of the Association of American Geographers 100(2): 286-306. doi:10.1080/00045600903550378.
Hipp, J.R. and Whitby Chamberlain, A. (2011). Community change and crime. Oxford bibliographies online: Criminology. doi:10.1093/obo/978019539660 7-0072.
Hirschman, C. and Tolnay, S.E. (2005). Social demography. In: Poston, D.L. and Micklin, M. (eds.). Handbook of population. New York: Kluwer Academic/Plenum Publishers: 419-449. doi:10.1007/0-387-23106-4_15. Hirshon, N. (2009). Homes abandoned via foreclosures becoming havens for crime,
study says. NY Daily News. http://articles.nydailynews.com/2009-03-05/local/17918620_1_high-foreclosure-advocacy-group-acorn-abandoned (last accessed April 11, 2012).
Immergluck, D. and Smith, G. (2006). The impact of single-family mortgage foreclosures on neighborhood crime. Housing Studies 21(6): 851-866. doi:10.1080/02673030600917743.
Katz, C.M., Wallace, D., and Hedberg, E.C. (2012). A longitudinal assessment of the impact of foreclosure on neighborhood crime. Journal of Research in Crime and Delinquency. doi:10.1177/0022427811431155.
Kessler, R.C. and Greenberg, D.F. (1981). Linear panel analysis: Models of quantitative change. New York: Academic Press.
King, R.D., Massoglia, M., and Macmillan, R. (2007). The context of marriage and crime: Gender, the propensity to marry, and offending in early adulthood. Criminology 45(1): 33-65.doi:10.1111/j.1745-9125.2007.00071.x.
King, R.D., and South, S.J. (2011). Crime, race, and the transition to marriage. Journal of Family Issues 32(1): 99-126.doi:10.1177/0192513X10375059. Kirk, D.S, and Hyra, D.S.(2011). Home foreclosures and community crime: Causal
or spurious association? Social Science Research Network. http://papers.ssrn.com/sol3/papers.cfm?abstract_id=1697871 (last accessed April 11, 2012).
Kirk, D.S., and Papachristos, A.V. (2011). Cultural mechanisms and the persistence of neighborhood violence. American Journal of Sociology 116(4): 1190-1233.doi:10.1086/655754.
Li, Y. and Morrow-Jones, H.A. (2010). The impact of residential mortgage foreclosure on neighborhood change and succession. Journal of Planning and Education Research 30(1): 22-39.doi:10.1177/0739456X10375305. Linz, D., Land, K., Williams, J., Paul, B., and Ezell, M. (2004). An examination of
the assumption that adult businesses are associated with crime in surrounding areas: A secondary effects study in Charlotte, North Carolina. Law and Society Review 38(1): 69-101.doi:10.1111/j.0023-9216.2004.0380 1003.x.
Martinez, R., Jr., Rosenfeld, R., and Mares, D. (2008). Social disorganization, drug market activity, and neighborhood violent crime. Urban Affairs Review 43(6): 846-874. doi:10.1177/1078087408314774.
Martinez, R., Jr., Stowell, J.I., and Lee, M.T. (2010). Immigration and crime in an era of transformation: A longitudinal analysis of homicides in San Diego neighborhoods, 1980-2000. Criminology 48(3): 797-829.doi:10.1111/j.1745 -9125.2010.00202.x.
Matthews, S.A., Yang, T-C., Hayslett, K.L., and Ruback, R.B. (2010). Built environment and property crime in Seattle, 1998-2000: A Bayesian analysis. Environment and Planning A 42(6): 1403-1420.doi:10.1068/a42393.
Merton, R.K. (1938). Social structure and anomie. American Sociological Review 3(5): 672-682.
Messner, S.F. and Sampson, R.J. (1991). The sex ratio, family disruption, and rates of violent crime: The paradox of demographic structure. Social Forces 69(3): 693-713. doi:10.1093/sf/69.3.693.
Miethe, T.D., Hughes, M., and McDowall, D. (1991). Social change and crime rates: An evaluation of alternative theoretical approaches. Social Forces 70(1): 165-185. doi: 10.1093/sf/70.1.165
Morenoff, J.D. and Sampson, R.J. (1997). Violent crime and the spatial dynamics of neighborhood transition: Chicago, 1970-1990. Social Forces 76(1): 31-64. doi:10.1093/sf/76.1.31.
Mummolo, J. and Brubaker, B. (2008). As foreclosed homes empty, crime arrives. Washington Post. http://www.washingtonpost.com/wp-dyn/content/article/ 2008/04/26/AR2008042601288.html (last accessed April 11, 2012).
Ousey, G.C. and Kubrin, C.E. (2009). Exploring the connection between immigration and violent crime rates in U.S. cities, 1980-2000. Social Problems 56(3): 447-473. doi:.1525/sp.2009.56.3.447.
Papachristos, A.V., Smith, C.M., Sherer, M.L., and Fugiero, M.A. (2011). More coffee, less crime? The relationship between gentrification and neighborhood crime rates in Chicago, 1991 to 2005. City and Community 10(3): 215-240.doi:10.1111/j.1540-6040.2011.01371.x.
Patillo-McCoy, M. (2000). Black picket fences: Privilege and peril among the black middle class. Chicago: University of Chicago Press.
Peterson, R.D., Krivo, L.J., and Hagan, J. (2010). Divergent social worlds: Neighborhood crime and the racial-spatial divide. New York: Russell Sage Foundation.
Peterson, R.D., Krivo, L.J., and Harris, M.A. (2000). Disadvantage and neighborhood violent crime: Do local institutions matter? Journal of Research in Crime and Delinquency 37(1): 31-63.doi:10.1177/00224278000 37001002.
Pridemore, W.A. and Grubesic, T.H. (2011). Alcohol outlets and community levels of interpersonal violence: Spatial density, outlet type, and seriousness of assault. Journal of Research in Crime and Delinquency. doi:10.1177/00224 27810397952.
Roncek, D.W. (1981). Dangerous places: Crime and residential environment. Social Forces 60(1): 74-96. doi:10.1093sf60.1.74.
Rosenfeld, R. (2009). Crime is the problem: Homicide, acquisitive crime, and economic conditions. Journal of Quantitative Criminology 25(3): 287-306. doi:10.1007/s10940-009-9067-9.
Rosenfeld, R., Fornango, R., and Rengifo, A.F. (2007). The impact of order-maintenance policing on New York City homicide and robbery rates: 1988-2001. Criminology 45(2): 355-384.doi:10.1111/j.1745-9125.2007.00081.x. Ross, C.E., Reynolds, J.R., and Geis, K.J. (2000). The contingent meaning of
Sampson, R.J. and Groves, W.B. (1989). Structure and crime: Testing social-disorganization theory. American Journal of Sociology 94(4): 774-802. doi:10.1086/229068.
Sampson, R.J. and Laub, J.H. (1993). Crime in the making: Pathways and turning points through life. Cambridge: Harvard University Press.
Sampson, R.J. and Lauritsen, J.L. (1994). Violent victimization and offending: Individual-, situational-, and community-level risk factors. In Reiss, A.J. and Roth, J.A (eds.). Understanding and preventing violence, volume 3: Social influences. Washington, D.C.: National Academy Press: 1-114.
Sampson, R.J. and Lauritsen, J.L. (1997). Racial and ethnic disparities in crime and criminal justice in the United States. Crime and Justice 21: 311-374. doi:10.1086/449253.
Sampson, R.J. and Morenoff, J.D. (2004). Seeing disorder: Neighborhood stigma and the social construction of “broken windows.” Social Psychology Quarterly 67(4): 319-342. doi:10.1177/019027250406700401.
Sampson, R.J. and Raudenbush, S.W. (1999). Systematic social observation of public spaces: A new look at disorder in urban neighborhoods. American Journal of Sociology 105(3): 603-651.doi:10.1086/210356.
Sampson, R.J. Raudenbush, S.W., and Earls, F. (1997). Neighborhoods and violent crime: A multilevel study of collective efficacy. Science 277(5328): 918-924.doi:0.1126/science.277.5328.918.
Shaw, C.R. and McKay, H.D. (1942). Juvenile delinquency and urban areas. Chicago: University of Chicago Press.
Smith, G. and Duda, S. (2011). Left behind: Troubled foreclosed properties and servicer accountability in Chicago. Woodstock Institute. http://www.woodstockinst.org/research/ (last accessed April 11, 2012).
South, S.J. and Deane, G.D. (1993). Race and residential mobility: Individual determinants and structural constraints. Social Forces 72(1): 147-167. doi:10.1093/sf/72.1.147.
Stowell, J.I. and Martinez, R., Jr. (2009). Incorporating ethnic-specific measures of immigration in the study of lethal violence. Homicide Studies 13(3): 315-324.doi:10.1177/1088767909335869.
Taylor, R.B. (2001). Breaking away from broken windows: Baltimore neighborhoods and the nationwide fight against crime, grime, fear, and decline. Boulder: Westview.
Teasdale, B., Clark, L., and Hinkle, J. (2011). Subprime lending foreclosures, crime, and neighborhood disorganization: Beyond internal dynamics. American Journal of Criminal Justice. doi:10.1007/s12103-010-9093-z.
Triplett, R.A., Gainey, R.R., and Sun, I.Y. (2003). Institutional strength, social
control and neighborhood crime rates. Theoretical Criminology 7(4):
439-467.doi:10.1177/13624806030074003.
Velez, M.B. (2001). The role of public social control in urban neighborhoods: A multi-level analysis of victimization risk. Criminology 39(4): 837-864. doi:10.1111/j.1745-9125.2001.tb00942.x.
Veysey, B.M. and Messner, S.F. (1999). Further testing of social disorganization theory: An elaboration of Sampson and Grove’s “community structure and crime.” Journal of Research in Crime and Delinquency 36(2): 156-174. doi:10.1177/0022427899036002002.
Warner, B.D. and Rountree, P.W. (1997). Local ties in a community and crime model: Questioning the system of informal social control. Social Problems 44(4): 520-536.doi:10.1525/sp.1997.44.4.03x0235a.
Western, B. (2006). Punishment and inequality in America. New York: Russell Sage Foundation.
Wheeler, D.C., and Páez, A. (2010). Geographically weighted regression. In Fischer, M.M. and Getis, A. (eds.), Handbook of applied spatial analysis: Software tools, methods and applications. New York: Springer: 461-486. doi: 10.1007/978-3-642-03647-7_22.
Wheeler, D.C. and Waller, L.A. (2009). Comparing spatially varying coefficient models: A case study examining violent crime rates and their relationships to alcohol outlets and illegal drug arrests. Journal of Geographic Systems 11(1):1-22.doi:10.1007/s10109-008-0073-5.
Woodstock Institute (2007). Vacant homes send crime rocketing. http://www.woodstockinst.org/press-clips/woodstock-in-the-news/vacant-homes-send-crime-rocketing-(cnn-money.com)/ (last accessed April 11, 2012).
Wright, R. and Decker, S. (1994). Burglars on the job: Streetlife and residential break-ins. Boston: Northeastern University Press.
Xie, M. and McDowall, D. (2010). The reproduction of racial inequality: How crime affects housing turnover. Criminology 48(3): 865-896.doi:10.1111/j. 1745-9125.2010.00204.x.