Strojniški vestnik - Journal of Mechanical Engineering 53(2007)4, 253-264 UDK - UDC 620.178.3:669.1
Strokovni članek - Speciality paper (1.04)
Določevanje parametrov utrujanja jekla z veliko trdnostjo
S1100Q
Determination of the Low-Cycle Fatigue Parameters of S1100Q High-Strength Steel
Marko Knez - Janez Kramberger - Srečko Glodež (Fakulteta za strojništvo, Maribor)
V prispevku j e predstavljena preizkusna raziskava za določitev utrujenostnih parametrov jekla z veliko trdnostjo S1100Q, ki se z namenom zmanjšanja skupne teže, pogosto uporablja pri zelo obremenjenih strojnih delih in konstrukcijah (premični žerjavi). Preizkusi so izvedeni v režimu malocikličnega utrujanja po standardu ASTM E 606 z nespremenljivim premerom preizkušanca. Na podlagi izsledkov preizkusa so po predpisani računski metodi po ASTM E 606 določeni ustrezni parametri malocikličnega utrujanja.
V drugem delu prispevka je predstavljen računski model za določitev dobe trajanja nosilnega droga protiutežipremičnega žerjava. Računski model temelji na deformacijski metodi (e-N), pri čemer so uporabljene poprej določene snovne lastnosti jekla z veliko trdnostjo S1100Q. Na posebej izvedenem hidravlično vodenem utripnem stroju so izvedeni tudi utrujenostni preizkusi nosilnega droga. Primerjava med računskimi in preizkusnimi izsledki kaže dobro ujemanje.
© 2007 Strojniški vestnik. Vse pravice pridržane.
(Ključne besede: utrujanje materialov, doba trajanja, numerični izračuni, deformacijske metode)
We designed an experimental investigation to determine the fatigue properties o f the high-strength steel S1100Q, which is often used in highly loaded machine components and structures, e.g., mobile cranes, to reduce weight. Fatigue tests were carried out in a low-cycle regime according to the ASTM E 606 standard, where standardized, uniform-gauge test specimens are used. On the basis o f the experimental results the appropriate low-cycle fatigue parameters were determined using the calculation procedure described in ASTM E 606.
In the second part o f the paper, a service-life evaluation o f the counterweight o f a mobile crane by means o f a computational analysis is presented. The computational analysis was performed using the local strain-life approach (s-N), where the appropriate material properties fo r treated high-strength S1100Q steel were used. The experimental fatigue tests on the bars were carried out in a specially constructed hydraulic pulsation test machine. The comparison o f the computational and experimental results showed a reasonable agreement.
© 2007 Journal o f Mechanical Engineering. All rights reserved.
(Keywords: fatigue, life times, numerical calculations, strain-life approach)
OUVOD
Pri dimenzioniranju dinamično obremenjenih stro jn ih d elo v in k onstrukcij p o staja vse bolj pom em bna napoved njihove dobe trajanja. Pri mnogih konstrukcijah (npr. premični žeijavi) so vedno večje tudi zahteve po zmanjšanju njihove skupne teže. Ena od m ožnosti za dosego tega cilja je zmanjšanje nosilnih prečnih prerezov z uporabo jekel z veliko trdnostjo, pri čem er je treba uporabiti ustrezne konstrukcijske rešitve, ki zm anjšujejo možnost nastanka utrujenostnih poškodb. Če se
le-0 INTRODUCTION
te pojavijo, je treba znati oceniti preostalo dobo trajanja konstrukcije.
Iz ra č u n dobe tra ja n ja d in am ičn o obrem enjenih kom ponent tem elji na poznavanju napetosti oziroma deformacij v kritičnih prečnih prerezih, ki jih običajno določimo numerično po metodi končnih elementov (MKE). Glavne vplivne veličine na dobo trajanja so zunanje obremenitve in trdnostne lastnosti uporabljenega m ateriala. To pomeni, da je za tovrstne preračune treba poznati trd n o stn e la stn o sti m a te ria la p ri u tru je v a ln ih obremenitvah.
Z a re še v a n je p ro b le m o v u tru ja n ja se dandanes vse več uporablja deformacijska metoda ([1] in [2]), še posebej pri dimenzioniranju dinamično obrem enjenih kom ponent ob navzočnosti raznih zarez. Če je strojni del z zarezo izpostavljen dinamični obremenitvi, je obnašanje materiala mogoče opisati s poznavanjem deformacij ob zarezi. Predvsem v primem plastifikacije materiala je določitev deformacij preprostejša kakor določitev ustreznih napetosti. N a p o v e d o v a n je u tru je n o s tn ih p o šk o d b z deformacijsko metodo se v takšnih primerih nanaša predvsem na krajevne deform acije ob zarezi in d e ja n sk o p o m e n i d o lo č ite v š te v ila n ih a je v obremenitve za nastanek razpoke. Za celotno rešitev problema je mimo lokalnih deformacij ob zarezi treba poznati tudi ustrezne param etre m alocikličnega utrujanja uporabljenega materiala.
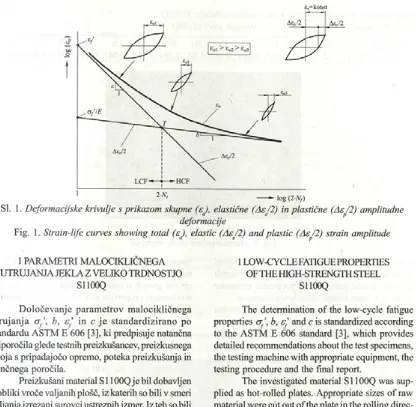
Slika 1 prikazuje deformacijske krivulje v dvojnem logaritemskem diagramu, kjer je število nihajev do pojava poškodbe. Skupna amplitudna deformacija ea na sliki 1 sestoji iz elastične (A e/2) in plastične (Ae /2) am plitudne deform acije, ki jih p re b e re m o iz s ta b iln ih h is te re z n ih zan k . Pri določenem številu nihajev N je skupna deformacija vsota elastične in plastične deformacije ([1] in [2]):
kjer so E modul elastičnosti, ay’ koeficient trdnosti pri utrujanju, b eksponent trdnosti pri utrujanju, e ’ koeficient žilavosti pri utrujanju in c eksponent žilavosti pri utrujanju. Utrujenostne parametre a ’, b,
8 ’ in c, k i jih im e n u je m o tu d i “p a ra m e tri malocikličnega utrujanja”, določimo s preizkusi po standardu ASTM E 606 [3], Če je pri dejanskem strojnem delu ali konstrukciji poznana skupna amplitudna deformacija eo (ki jo določimo numerično ali z m eritv am i), d oločim o dobo trajan ja Nf z ponavljajočim postopkom po enačbi (1).
structures, there is also an increasing interest in as sessing the remaining fatigue life o f existing structures. The service-life calculation o f a cyclically loaded component is based on a knowledge o f the stresses or deformations in the critical cross-sec tions, usually calculated by means o f a finite-ele ment analysis (FEA). The main parameters influenc ing the fatigue life are the external loads and the strength behavior o f the material. Therefore, the appropriate fatigue properties o f the material should be known for such an analysis.
The strain-based approach to fatigue prob lems is widely used at present ([ 1 ] and [2]). The most common application o f the strain-based approach is in the fatigue o f notched members. In a notch com p o n en t subjected to cy clic external lo ad s, the behavior o f the material at the root o f the notch is best considered in terms o f strain. As long as there is an elastic constraint surrounding a local plastic zone at the notch, the strains can be calculated more easily than the stress. Since fatigue dam age is assessed d irectly in term s o f local strain, this approach is also called the “local strain approach”. A reasonable expected fatigue life, based on the nucleation or formation o f small macrocracks, can then be determined if one knows the local strain time history at a notch in the component and the unno tch ed strain -life fatigue p ro p erties o f the material.
Strain-life fatigue curves plotted on log-log scales are shown schematically in Fig. 1, where A^.is the number o f cycles to failure. The total strain am plitude, s , shown in F ig.l has been resolved into the elastic (AeJ2) and the plastic (AeJ2) strain com ponents from the steady-state hysteresis loops. At a given life Nf the total strain is the sum o f the elastic and plastic strains, as follows ([1] and [2]):
(1),
where E is the modulus o f elasticity, a ’ is the fatigue- stre n g th c o e ffic ien t, b is the fatig u e -stre n g th exponent, e ’ is the fatigue-ductility coefficient and c
is the fatigue-ductility exponent. The strain-life fatigue properties ay’, b, z'f and c, which are often referred to as the “low-cycle fatigue properties”, are obtained experimentally according to the ASTM E 606 standard [3], When the total strain amplitude, za, in real machine part or structure is known (it can be measured or determined numerically), the fatigue life N can then be calculated iteratively using Equation (1).
k s e As s„ = — £. + — p
£«,=konst
Sl. 1. Deformacijske krivulje s prikazom skupne (ej, elastične (Ae/2) in plastične (AeJ2) amplitudne deformacije
Fig. 1. Strain-life curves showing total (ej, elastic (Ae/2) and plastic (Ae/2) strain amplitude
1 PARAMETRI MALOCIKLIČNEGA UTRUJANJA JEKLA Z VELIKO TRDNOSTJO
S1100Q
1LOW-CYCLE FATIGUE PROPERTIES OF THE HIGH-STRENGTH STEEL
S1100Q
D oločevanje param etrov m alocikličnega u tru ja n ja <jf \ b, e ' in c je standardizirano po standardu ASTM E 606 [3], ki predpisuje natančna priporočila glede testnih preizkušancev, preizkusnega stroja s pripadajočo opremo, poteka preizkušanja in končnega poročila.
Preizkušam material S 1100Q je bil dobavljen v obliki vroče valjanih plošč, iz katerih so bili v smeri valjanja izrezani surovci ustreznih izmer. Iz teh so bili z mehansko obdelavo izdelani končni preizkušanci na sliki 2.
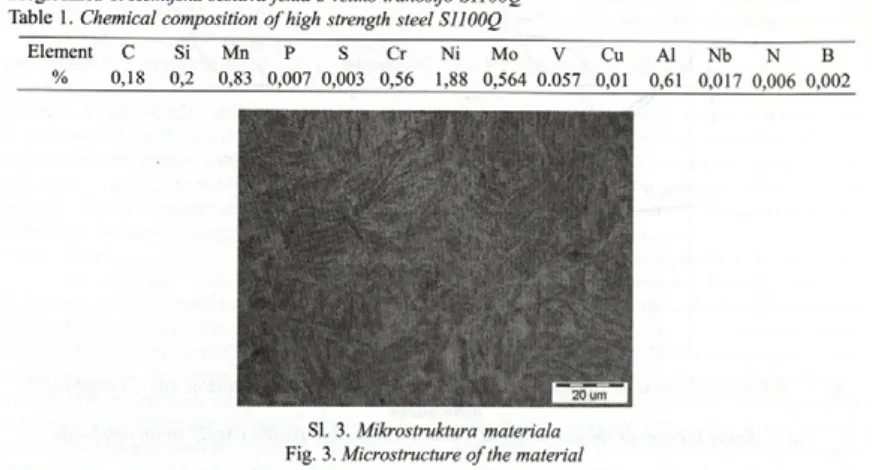
P re g led n ica 1 p o d aja kem ijsk o sestavo preizkušanega gradiva, na sliki 3 pa je prikazana mikrostruktura gradiva. S slike je razvidno, da je
The determination o f the low-cycle fatigue properties af \ b, ej and c is standardized according to the ASTM E 606 standard [3], which provides detailed recommendations about the test specimens, the testing machine with appropriate equipment, the testing procedure and the final report.
The investigated material SI 100Q was sup plied as hot-rolled plates. Appropriate sizes o f raw material were cut out o f the plate in the rolling direc tion. Further specimens were machined to the final shape shown in Fig. 2.
Table 1 shows the chemical composition o f the tested material. The material microstructure is shown in Fig. 3. It is evident that the structure
Preglednica 1. Kemijska sestava jekla z veliko trdnostjo S1100Q
Table 1. Chemical composition o f high strength steel S1100Q
Element C Si Mn P S Cr Ni Mo V Cu Al Nb N B
% 0,18 0,2 0,83 0,007 0,003 0,56 1,88 0,564 0.057 0,01 0,61 0,017 0,006 0,002
SI. 3. Mikrostruktura materiala
Fig. 3. Microstructure o f the material
struktura gradiva igličasti bainit z zelo drobnimi iglicami. Zaradi različne usmeijenosti rasti posameznih kristalov je moč predpostaviti povprečne mehanske lastnosti v vseh smereh obravnavane sestave.
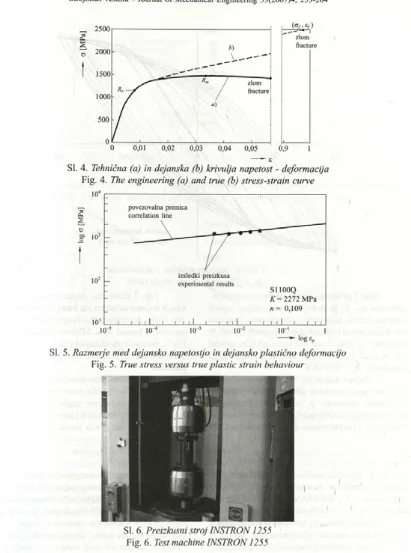
Pred utrujenostnimi preizkusi je bil izveden statični natezni preizkus z enakim preizkušancem kakor ga prikazuje slika 2. Slika 4a prikazuje tehnični diagram napetost - deform acija, iz katerega so določeni natezna trdnost R m = 1450 M Pa, meja plastičnosti Re = 1148 M Pa in modul elastičnosti gradiva E = 194889 MPa. Iz dejanskega diagrama n a p e to s t - d e fo rm a c ija n a slik i 4b pa sta ob u p o šte v a n ju d ejan sk e n ap eto sti a in dejanske plastične deformacije ep iz Hollomonovega razmerja (2) določena trdnostni koeficient K =2272 M Pa in deformacijski eksponent utijanja n = 0,109. Pri tem je p red p o stav ljen o , da je razm erje m ed dejansko n ap eto stjo in plastično deform acijo v dvojnem logaritemskem diagramu linearno, kjer pomenita K
napetost pri s = 1, n pa strmino premice (sl. 5).
resembles lower needle bainite with extremely fine needles. Because o f the different orientations o f crystal growth it can be assumed that the average mechanical properties can be used in all loading directions.
Before the fatigue tests, the monotonie tensile test was made using the same specimen as shown in Fig. 2. The engineering stress-strain curve is shown in Fig. 4a, from which the ultimate tensile strength
Rm = 1450 MPa, the yield stress Re = 1148 M Pa and the modulus o f elasticity E = 194889 M Pa are re corded. Considering the true stress, a, and true plas tic strain, e, from the true stress-strain curve in Fig.
4b, the strength coefficient K =2272 M Pa and the strain-hardening exponent « = 0.109 were determined using the Hollomon relationship (2). Here it is as sumed that the plot o f trae stress versus true plastic strain in log-log coordinates results in a linear curve, where K is the stress intercept at £p = 1 and « de notes the slope o f the line (see Fig. 5).
°r = K ( e pY (
2
).U trujenostni preizkusi so bili izvedeni z nadzorom deformacije na hidravličnem preizkusnem s tro ju za u tru ja n je In s tro n 1255 (s lik a 6) z računalniškim vm esnikom in sistem om zbiranja podatkov Instron 8500. Nihaj obremenitve je imel trikotno obliko z obremenitvenim razmerjem R = —l.
T e m p e ra tu ra p re iz k u ša n ja 20 °C je b ila m ed
(<*/>£/) i
zlom fracture
0,9 1 Sl. 4. Tehnična (a) in dejanska (h) krivulja napetost - deformacija
Fig. 4. The engineering (a) and true (h) stress-strain curve
Sl. 5. Razmerje med dejansko napetostjo in dejansko plastično deformacijo
Fig. 5. True stress versus true plastic strain behaviour
SI. 6. Preizkusni stroj INSTRON1255 '
Fig. 6. Test machine INSTRON 1255
■I
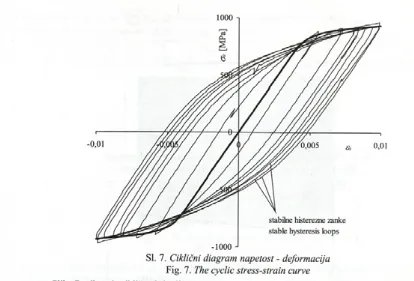
p re iz k u s o m n a d z o ro v a n a ro čn o z d ig ita ln im termometrom. Frekvenca obremenjevanja je bila višja pri nižjih amplitudnih deformacijah, saj je nastala e n e rg ija v tem p rim e ru m an jša. P aram etri malocikličnega utrujanja so bili določeni na podlagi rezultatov osmih preizkušancev, pri čemer je bil kriterij poškodbe zlom preizkušanca.
Fig. 7. The cyclic stress-strain curve
Slika 7 prikazuje ciklično krivuljo napetost - d e fo rm a c ija, ki je d o b ljen a na p o d lag i osm ih histereznih zank, ki opisujejo utrujenostno obnašanje preizkušancev na različnih deformacijskih ravneh. Iz diagram a na sliki 7 sta določena ciklični modul e la stičn o sti E ’ = 183443 M P in ciklična m eja plastičnosti Re ’ = 875 MPa.
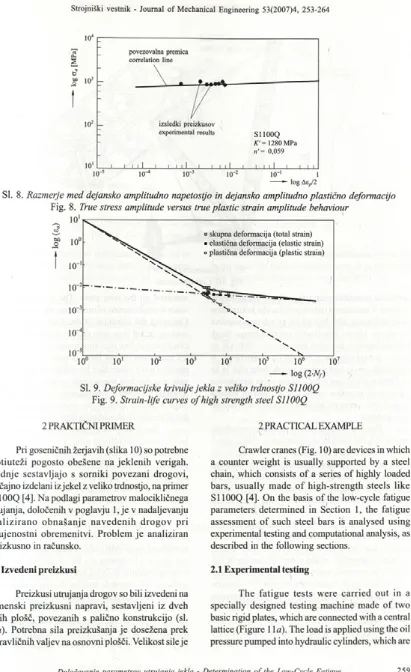
Podobno kakor pri statičnem je tudi pri utrujenostnem preizkusu odvisnost m ed dejansko amplitudno napetostjo <r in dejansko amplitudno deformacijo A s 12 v dvojnem logaritemskem diagramu linearna (sl. 8) in jo izrazimo z eksponentno enačbo:
Fig. 7 shows the cyclic stress-strain curve, which is constructed on the basis o f 8 stable hyster esis loops describing the fatigue behavior o f the specimens loaded on a different strain level. From Fig. 7, the cyclic modulus o f elasticity, E ’= 183443 MPa, and the cyclic yield stress, Re ’ = 875 MPa, are recorded.
Similar to the monotonie deformation in a ten sion test, a plot o f the true stress amplitude, c r, ver sus the true plastic-strain amplitude, A s/2, in log- log coordinates results in a linear curve (see Fig. 8) represented by the power function
a = K'- (3),
kjer sta K’ trdnostni koeficient in « ’deformacijski eksponent uhjanja pri dinamični obremenitvi. S slike 8 se vidi, d a je K’ = 1280 MPa (pripadajoča napetost pri AsJ2 = 1) in « ’ = 0,059 (strmina premice).
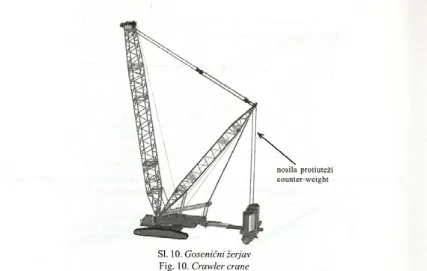
Slika 9 prikazuje krivulje dobe trajanja v dvojnem logaritemskem diagramu, kjer pomeni N
število nihajev do zloma preizkušanca. Če primeijamo dobljene veličine na sliki 9 s teoretičnimi veličinami na sliki 1, sledijo parametri malocikličnega utrujanja zajeklo z veliko trdnostjo S l 100Q:
- koeficient trdnosti pri utrujanju: a'f = 2076 MPa - eksponent trdnosti pri utrujanju: b = -0,0997 - koeficient žilavosti pri utrujanju: sf ’ = 9,93 - eksponent žilavosti pri utrujanju: c = -0,978
where fC is the cyclic strength coefficient and « ’ is the cyclic strain-hardening exponent. It is evident from Fig. 8 that K’ = 1280 M Pa (stress intercept at
Sl. 8. Razmerje med dejansko amplitudno napetostjo in dejansko amplitudno plastično deformacijo
Fig. 8. True stress amplitude versus true plastic strain amplitude behaviour
SI. 9. Deformacijske krivulje jekla z veliko trdnostjo S1100Q
Fig. 9. Strain-life curves o f high strength steel S1100Q
2 PRAKTIČNI PRIMER
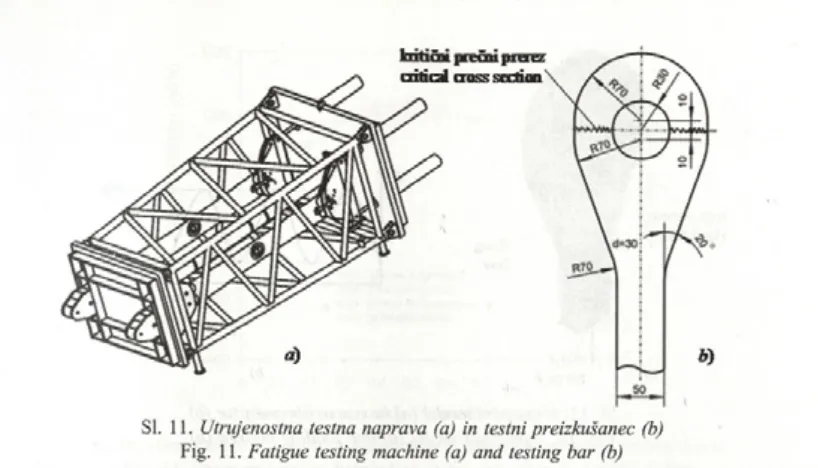
Pri goseničnih žeijavih (slika 10) so potrebne p ro tiu teži pogosto obešene na jeklenih verigah. S lednje sestavljajo s sorniki povezani drogovi, običajno izdelani iz jekel z veliko trdnostjo, na primer S l 100Q [4], N a podlagi parametrov malocikličnega utrujanja, določenih v poglavju 1, je v nadaljevanju a n a liz ira n o o b n a ša n je n a v e d e n ih d ro g o v pri u trujenostih obrem enitvi. Problem je analiziran preizkusno in računsko.
2.1 Izvedeni preizkusi
Preizkusi utrujanja drogov so bili izvedeni na nam enski preizkusni napravi, sestavljeni iz dveh togih plošč, povezanih s palično konstrukcijo (sl. I l a ) . Potrebna sila preizkušanja je dosežena prek hidravličnih valjev na osnovni plošči. Velikost sile je
2 PRACTICAL EXAMPLE
Crawler cranes (Fig. 10) are devices in which a counter weight is usually supported by a steel chain, which consists o f a series o f highly loaded bars, usually m ade o f high-strength steels like S1100Q [4]. On the basis o f the low-cycle fatigue param eters determ ined in Section 1, the fatigue assessm ent o f such steel bars is analysed using experimental testing and computational analysis, as described in the following sections.
2.1 Experimentaltesting
Fig. 10. Crawler crane
določena posredno prek tlaka olja v hidravličnem sistemu. S spremembo smeri pretoka olja je krmiljena smer delovanja sile. Navedena preizkusna naprava o m o g o ča h k rati sim ultano p re iz k u ša n je štirih preizkušancev z največjo natezno silo 1000 kN za v s a k p re iz k u š a n e c . D e ja n sk e n a p e to sti v preizkušancu so nadzorovane prek tlaka olja in še dodatno z merilnimi lističi. Slaba stran preizkusne naprave so potrebne velike sile za dosego želenih napetosti ter težave pri zagotavljanju želenih frekvenc preizkušanja.
Preizkusni drogovi (sl. lift) imajo pravokotni prerez (30x50 mm) in so sklenjeni v obliki ušes z izvrtino za somik. 6 m dolgi drogovi so iz osnovnih plošč izrezani s plamenskim rezanjem, vse površine rezanja pa so pozneje obdelane z brušenjem. Pri preizkusu so drogovi obremenjeni na nateg, pri čemer je zasledovana natezna napetost v kritičnem prerezu
droga.
Za zbiranje podatkov je uporabljena ustrezna oprem a “N ational Instrum ents” . C elotni sistem vsebuje kartico zbiranja podatkov AT-MIO-16E-2, vgrajeno v računalnik, modul za analizo signalov SCXI- 1520 in programski paket Lab VIEW 6.1. Modul za analiziranje signalov omogoča sprejem do 8 signalov z merilnih lističev pri frekvencah do 300 kHz. Za končno vrednotenje poteka testiranja je treba podati natančno obliko nihaja obremenitve (največja in najmanjša obremenitev znotraj nihaja). Zaradi velike dolžine kablov (približno 12 m) so uporabljeni 350 Q merilni
mounted on the base plate. The oil pressure pro vides a simple means o f measuring the applied force. Changing the direction o f the load is done by re versing the oil flow with electrical control. The ma chine can test four bars simultaneously, with a 1000- kN maximum tensile force in each bar. The actual stresses were controlled by means o f the oil pres sure and checked using strain gauges. The loading machine has certain disadvantages, like the need for large forces to achieve the necessary stresses and the difficulty in providing a high testing frequency.
The testing bar (Figure 11ft) had a rectangu lar cross-section (30x50 mm). Each side o f the bar contains a head with a hole for a bolt. The fabrication o f approximately 6-m-long bars was carried out under normal production procedure, i.e., gas cutting. The grinding was done on gas-cut surfaces. The bars were loaded in tension so that the nominal applied stress was controlled in the critical cross-section.
six-lističi s šestimi kabelskimi priključki. Dodana sta še dva dodatna kabla za kalibriranje, tako daje ocenjena napaka meritev manjša od enega odstotka.
wire connection were used. An additional two wires were used for the shunt calibration. It is estimated that the measurement error was less than 1%.
2.2 Računska analiza
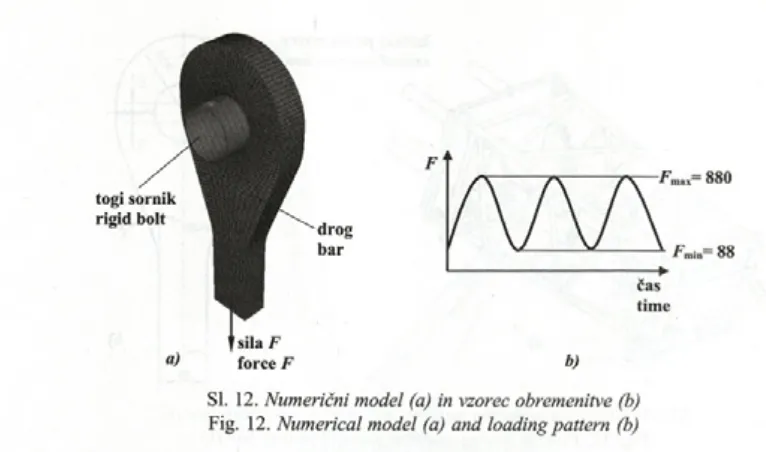
Računska analiza je potekala v dveh korakih. V prvem je s programskim paketom Abaqus 6.4 [5] n u m e rič n o po M K E d o lo č e n o n a p e to stn o in deformacijsko polje v kritičnem prečnem prerezu droga. Pri numerični analizi sta bila uporabljena numerični model na sliki 12« in vzorec obremenitve na sliki 126. Vzorec obremenitve na sliki 126 je enak kakor pri poprej opisanih testnih preizkusih.
V naslednjem koraku je izvedena analiza utrujanja s programskim paketom FE-Safe [6]. Analiza utrujanja je zasnovana na deformacijski metodi ( s-N), p ri čem er je za d o lo čitev štev ila n ih ajev obremenitve N do pojava utrujenostne poškodbe v kritičnem prečnem prerezu droga uporabljena Cof- fin-Mansonova enačba z Morrowo popravo vpliva srednje napetosti [7]:
A s _ 2 ~ E~~
kjer so A s dejanska am plitudna deformacija, a n
srednja napetost ter E, <r’, s'f , 6 in c materialni parametri, opisani v poglavju 1.
2.2 Computational analysis
The computational analysis was made in two steps. First, a stress and deformation field in the critical cross-section o f the bar was determined numerically using the FEM program code Abaqus 6.4 [5]. The FE model shown in Fig. 12a and the loading pattern shown in Fig. 126 were used in the computational analysis. Here, the loading pattem in Fig. 126 is the same as that used in the experimental testing, described previously.
In the next steep, the fatigue analysis was performed using the FE-Safe program code [6]. The fatigue analysis was based on the strain-life method
(e-N), where the Coffin-Manson relationship with a Morrow mean stress correction was used to deter mine the number o f stress cycles, Np required for the fatigue failure in a critical cross-section o f the treated bar connection [7]:
7 )* + « / "(22V»e (4),
where A s is the true strain range, am is the mean stress and E, <j' s j, 6 and c are material parameters described in Section 1.
2.3 Preizkusni in računski rezultati
Slika 13a prikazuje utrujenostni prelom preizkusnega droga. S slike 136 je razvidna začetna
2.3 Experimental and computational results
Sl. 12. Numerični model (a) in vzorec obremenitve (b)
Fig. 12. Numerical model (a) and loading pattern (b)
razpoka na robu izvrtine, ki se je z nadaljnjim utrujanjem širila do končnega zlom a v kritičnem p re re z u p re iz k u sn e g a d ro g a. Š te v ilo n ih a je v obremenitve Nf do končnega zloma je razvidno iz preglednice 2.
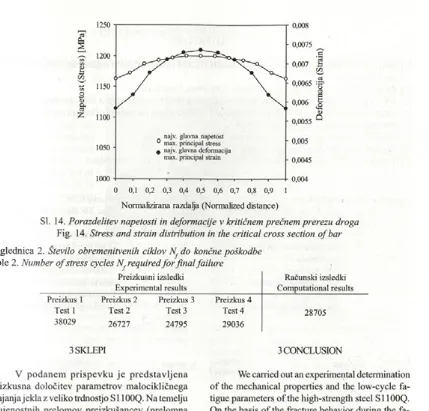
Slika 14 prikazuje porazdelitev napetosti in deformacij vzdolž kritičnega prereza droga, ki so bile upoštevane pri analizi utrujanja s program skim paketom FE-Safe. S slike je razvidno, da se pojavljajo največje napetosti in deformacije v sredini droga, kar je v nasprotju z rezultati preizkusov, pri katerih so se z a č e tn e ra z p o k e p o ja v ile n a p o v rš in i preizkušancev. Domnevno so začetne površinske razpoke posledica plamenskega rezanja pri izdelavi testnih preizkušancev. Čeprav so bili preizkušanci po plam enskem rezanju še dodatno obdelani z b ru šen jem , le-to ni v zadostni m eri odpravilo površinskih nepravilnosti (površinska hrapavost, mikrorazpoke, vključki itn.), na katera so jekla z veliko trdnostjo še posebej občutljiva. Računsko število nihajev obremenitve Nf do končnega zloma navaja preglednica 2.
o f the hole, which can be seen from Figure 13 b. The initial crack then propagates until the final fracture in the critical cross-section. The number o f stress cycles, Nf required for the final fracture is shown in Table 2.
Figure 14 shows the stress and strain distri bution along the critical cross-section o f the bar, which was used for the fatigue analysis with the FE- Safe program code. It is clear that the m aximum stresses and deformations appear in the middle o f bar thickness, which is opposite to the experimental testing, where the crack is initiated at the edge o f the hole. It can be explained by the fact that the test bar specimens were produced with a thermal cutting process, w hich results in initial surface damage. Although additional surface grinding was applied, this was apparently not sufficient to alleviate the sensitivity o f high-strength steel to notches and other m aterial im perfections (surface roughness, micro-cracks, inclusions etc.). The computational number o f stress cycles, N , required for final fracture is shown in Table 2.
SI. 13. Utrujenostni prelom testnega droga (a) in primer prelomne površine (b)
Sl. 14. Porazdelitev napetosti in deformacije v kritičnem prečnem prerezu droga
Fig. 14. Stress and strain distribution in the critical cross section o f bar
Preglednica 2. Število obremenitvenih ciklov Nf do končne poškodbe
Table 2. Number o f stress cycles Nf required fo r final failure
Preizkusni izsledki Experimental results
Računski izsledki Computational results Preizkus 1 Preizkus 2 Preizkus 3 Preizkus 4
Test 1 Test 2 Test 3 Test 4 28705
38029 26727 24795 29036
3 SKLEPI 3 CONCLUSION
V p o d an em p risp ev k u je p red sta v lje n a preizkusna določitev param etrov malocikličnega utrujanja jekla z veliko trdnostjo S i l 00Q. N a temelju utrujenostnih prelomov preizkušancev (prelomna površina poteka poševno pri vseh preizkušancih) lahko povzam em o, da im a preizkušano gradivo dobro utrujenostno trdnost. V primerjavi s statičnim p reizk u so m je m odul elastičnosti pri cikličnem p re iz k u s u m an jši za p rib liž n o 7,5 %. Z arad i razm erom a nizkega eksponenta utrjanja se bo pri u tru jen o stn ih obrem enitvah pravilom a pojavilo ciklično mehčanje gradiva.
V drugem delu prispevka je predstavljen preizkusni in računski postopek določitve dobe trajanja nosilnega droga protiuteži pri žerjavu. Oba postopka potrjujeta, d a je izvrtina za somik v ušesu d ro g a kritično m esto za nastanek utrujenostne razpoke in pojav končne poškodbe. V preglednici 2 predstavljeni izsledki pomenijo koristne informacije inženirjem pri oceni utrujenostne trdnosti nosilnega droga protiuteži kot pomembnega člena v žerjavnih konstrukcijah.
We carried out an experimental determination o f the mechanical properties and the low-cycle fa tigue parameters o f the high-strength steel SI 100Q. On the basis o f the fracture behavior during the fa tigue tests (the fracture surface was not in-plane for all the tested specimens) it can be concluded that the in v estig ated m aterial show s good fatigue strength. The modulus o f elasticity is, based on fa tigue tests, approximately 7.5% lower compared to the monotonie test. Because o f the low strain-hard ening exponent the cyclic softening o f the material is expected as a result o f fatigue loading.
4 LITERATURA 4 LITERATURE
[1] Stephens R.I., Fatemi A., Stephens R.R., Fuchs H.O (2001) Metal fatigue in engineering, John Wiley & Sons Inc, New York.
[2] Zahavi E., Torbilo V. (1996) Fatigue design, CRC Press, New York.
[3] ASTM E 606 (1998) Standard practice for strain-controlled fatigue testing, ASTMstandard.
[4] Kramberger J., Potrč L, Bombek G. and Flašker J (2003) Fatigue assessment o f high strength steel beam for crawler track cranes, Gep, Voi. 10-11,87-90.
[5] Abaqus, Version 6.4, Online documentation, 2003. [6] FE-Safe, Version 5, U ser’s manual, 2003.
[7] Suresh S. (1998) Fatigue o f materials, Cambridge University Press, Cambridge.
Naslovi avtorjev: Marko Knez A uthors’ Address: Marko Knez doc. dr. Janez Kramberger
prof. dr. Srečko Glodež Univerza v Mariboru Fakulteta za strojništvo Smetanova 17
2000 Maribor
marko.knez@uni-mb.si jkramberger@uni-mb.si
srecko.glodez@uni-mb.si
2000 Maribor, Slovenia marko .knez@uni-mb. si jkramberger@uni-mb. si
Faculty o f Mechanical Eng. Smetanova 17
Doc. Dr. Janez Kramberger Prof. Dr. Srečko Glodež University o f Maribor
srečko. glodez@uni-mb .si
Prejeto:
Received: 29.8.2006
Sprejeto:
Accepted: 21.2.2007