Max Planck Institute for Demographic Research Konrad-Zuse Str. 1, D-18057 Rostock·GERMANY www.demographic-research.org
DEMOGRAPHIC RESEARCH
VOLUME 20, ARTICLE 26, PAGES 623-656
PUBLISHED 05 JUNE 2009
http://www.demographic-research.org/Volumes/Vol20/26/ DOI: 10.4054/DemRes.2009.20.26
Research Article
Does fertility decrease household consumption?
An analysis of poverty dynamics and fertility in
Indonesia
Jungho Kim
Henriette Engelhardt
Alexia Prskawetz
Arnstein Aassve
c
°2009 Jungho Kim et al.
2 Measuring household consumption 626
3 Statistical methods 631
4 Institutional background and data 634
4.1 Background and data description 634
4.2 Control variables 635
5 Household consumption expenditure and fertility 638
6 Private expenditure on child and intra-household bargaining 643
7 Conclusion 650
8 Acknowledgements 651
References 652
Does fertility decrease household consumption?
An analysis of poverty dynamics and fertility in Indonesia
Jungho Kim1
Henriette Engelhardt2
Alexia Prskawetz3
Arnstein Aassve4
Abstract
This paper presents an empirical analysis of the relationship between fertility and poverty for Indonesia, a country which has experienced unprecedented economic growth and sharp fertility decline over recent decades. We illustrate the sensitivity of the effect of fertility on household consumption with respect to the equivalence scale in a unitary household framework. Using the propensity score matching method, the analysis sug-gests that a newborn child decreases household consumption per person by 20 percent within four years. When the estimates of equivalence scales implied by the Indonesian sample are applied, the effect of a child on household consumption is still negative, but the magnitudes are in the range of 20 to 65 percent of that found with the per-capita ex-penditure as a measure of consumption. Therefore, it is suggested that analysis based on the conventional measure of poverty is likely to exaggerate the effect of fertility on poverty at least because of neglect of the proper equivalence scale. Given that household preference for consumption of private goods such as children’s education is negatively associated with fertility, the test for household bargaining supports the model of the uni-tary household as a valid assumption for examining the relationship between fertility and household consumption.
1Korea Development Institute, Cheongnyangni-dong Dongdaemun-gu, Seoul 130-740, Korea,
Phone: +82 2-958-4742, Fax: +82 2-958-4090, E-mail: [email protected].
2Otto-Friedrich-Universität Bamberg, Professur für Bevölkerungswissenschaft, Lichtenhaidestraße 11,
D-96045 Bamberg, Germany, Phone: +49 0951-863-2645, Fax: +49 0951-863-5644. E-mail: [email protected].
3Institute for Mathematical Methods in Economics (Research Unit Economics), Vienna University of
Tech-nology, Argentinierstr. 8/4/105-3, 1040 Vienna, Austria and Vienna Institute of Demography, Wohlleben-gasse 12-14, 6th floor, 1040 Vienna, Austria. Phone: +43 1-58801-17510. Fax: +43 1-58801-17599. E-mail: [email protected].
1. Introduction
The causal relationship between population growth and standard of living has long been of interest to policymakers. While the estimates of the effect of fertility on poverty range from being significantly positive to insignificant, a growing body of literature suggests that the true relationship is likely to be more complicated than unidirectional (e.g. Bird-sall et al. 2001). The relationship between poverty and fertility is not unidirectional but dependent on the stage of economic development (McNicoll 1997, Schoumaker and Tabutin 1999). While in most contemporary developing countries this relationship is positive, a negative relationship has been reported within the poorest countries. The lat-ter results are associated with lower reproduction capability and higher rates of infertility among extremely poor households (Lipton 1998, Livi-Bacci and De Santis 1998). Clearly many factors that influence fertility also determine well-being. These include education, health services and family planning policies. In addition tojoint causation,reverse causa-tionmay also take place. Among poor households, the demand for children is high since those households rely on their children’s labor supply and often the child’s support is crit-ical when parents become old. Higher fertility in turn is associated with lower investment in education (i.e. demand for quantity rather than quality of children) and consequently lower earnings potential for children, which in turn fosters intergenerational transmission of poverty (Moav 2005).
The theoretical perspectives suggest various mechanisms linking fertility and poverty. Empirical studies that tried to identify the causal relationship between fertility and poverty have so far relied on aggregate level data and cross-sectional micro level data (cf. the re-view by Merrick 2001). With these data, it is difficult to provide robust causal information about fertility and well-being because fertility and household income are jointly deter-mined. Recent longitudinal household surveys in developing countries that incorporate the timing of fertility together with information on consumption expenditure, income and other measures of well-being allow researchers to identify the dynamic relation between poverty and fertility. So far, these data sets have not been used to study the link between poverty and fertility, which is the goal of this paper. In particular, we examine the Indone-sian experience for which we have excellent longitudinal information on both fertility and household expenditure, together with a range of other background information.
of household welfare. In addition, parents may enjoy having children and children may make the consumption of other goods more enjoyable. However, in light of the Mil-lennium Development Goals, set out by the United Nations, the materialistic measure of welfare is clearly of interest.5As a result, we examine here whether and how much having
an additional child decreases household consumption.
One difficulty in establishing a relationship between fertility and household consump-tion is related to the measure of consumpconsump-tion (Ravallion 1996). As argued in Lanjouw and Ravallion (1995) “Despite extensive work on welfare measurement in economics, there is still no preferred method for making inter-personal comparisons across households of different size and/or composition.” For instance, a common measure of well-being at the household level isexpenditure per adult equivalent. However, assigning equal weight to all household members and overlooking economy of scale with household size ignores the compositional and size effect of households on the measure of well-being. As shown in Lanjouw and Ravallion (1995) for Pakistan, the measure of poverty is sensitive to the economy of scale parameter that is assumed. In this paper we investigate whether the causal relation between fertility and household consumption is sensitive to two dimen-sions of equivalence scale frequently discussed in the literature: the weight of a child’s consumption relative to an adult’s and the economy of scale (Banks and Johnson 1994; Koulovatianos et al. 2005)
A further complication in verifying the relationship between fertility and poverty is the issue of measuring a variation of fertility that is exogenous with respect to the measures of well-being. Two approaches have been adopted in the existing literature. The first one is to use the context of a natural experiment such as samples of twins or the sex composi-tion of the first two children as an instrumental variable for fertility (e.g. Rosenzweig and Wolpin 1980; Angrist and Evans 1998). Although these instruments are reasonably valid, Rosenzweig and Wolpin (2000) note that this approach requires restrictions on the utility function (e.g. the separability of leisure and consumption, etc.). The second approach is to use the residual from a fertility regression as a measure of unobserved fecundity (Rosen-zweig and Schultz 1985). Measuring female fecundity is certainly a useful approach, but the result is less intuitive. As an alternative approach, we apply here a matching method in order to estimate the effect of an additional child on household consumption in the short run. This approach assumes that the event of childbearing is independent of household consumption given observable characteristics. However, our focus is on illustrating the extent to which the effect of fertility on poverty depends on the measure of equivalence scale under a reasonable estimation strategy, and we minimize any possible bias due to
5The first goal of the Millennium Development Goal is to eradicate extreme poverty and hunger by 2015. It
unobservable characteristics by conditioning on an extensive set of observable character-istics.6
The sensitivity of the effect of fertility on household consumption suggests that the expenditure share of private good may affect fertility decision. Then, the share of pri-vate good in household expenditure may be determined by the intrahousehold bargaining process. Therefore, these possibilities are further investigated in order to find an empirical evidence that connects unitary and collective models of a household.
Our main finding is that households with a new born child between 1993 and 1997 experience about 20 percent reduction in consumption when per-capita consumption is used as a measure of household consumption. However, the effect of fertility on con-sumption is highly sensitive to the choice of the equivalence scale. When we apply the estimated equivalence scale parameters with further assumptions on household welfare, the magnitude of the effect of fertility on consumption is in the range 20 to 65 percent of that found with the per-capita consumption. Therefore, it is suggested that the analysis based on the conventional measure of poverty is likely to exaggerate the effect of fertility on poverty at least because of the neglect of the proper equivalence scale. On the other hand, the household preference for consumption of private goods such as children’s edu-cation is found to be negatively correlated with fertility. Further, the results of the tests for the household bargaining process supports the framework of a unitary household model, which is a basic assumption for the analysis of equivalence scale.
The rest of the paper is organized as follows. Section 2 introduces the measure of household consumption and summarizes estimates of the equivalence scale implied by the data. The method of analysis is discussed in section 3. Section 4 describes the in-stitutional background, data and variables used in our study. The results on whether and in which direction fertility causes household consumption are presented in section 5. We apply household consumption expenditure per person and investigate the sensitivity of the results depending on the way in which household size and household composition are taken care of. Section 6 examines the effect of private goods share of expenditure on fertility and the effect of bargaining power on the share of private goods in household expenditure. In section 7 we conclude.
2. Measuring household consumption
The most commonly used measure of welfare ishousehold expenditure per person. A critical issue when considering the effect of a new born child on household consumption is the definition of the equivalence scale (Lanjouw and Ravallion 1995). One approach is to directly estimate the cost of a child in terms of an adult’s consumption (e.g. Deaton
and Muellbauer 1986). A limitation of this approach is that the calculation is based on households of a specific demographic type. Therefore, the result is not directly applicable to households of various demographic types. Unlike developed countries where nuclear households are common, there are 67 different types of households in our sample with the numbers of children and adults ranging from zero to ten and from one to twelve, re-spectively. Although, in principle, it is correct to calculate the cost of a child for each household type separately, it seems more appropriate here to estimate the effect of a new-born child in an average household.
One way of estimating the equivalence scale is to use a complete demand system and to estimate the equivalence scale for a particular type of household compared to a base-line household (e.g. De Santis and Maltagliani 2003). Our approach is to estimate two parameters of equivalence scale in a functional form, which can be applied to all house-holds with different demographic composition. It has the disadvantage of assuming a particular functional form for the equivalence scale, but, at the same time, has an impor-tant advantage since it allows us to evaluate the effect of a birth on individual household consumption, on average, under the equivalence scale implied by the data. The functional form is widely used, and in this sense we are in line with the majority of the previous literature.
There are two dimensions of the equivalence scale to be considered: 1) the weight assigned to children relative to adults, and 2) the economy of scale in household con-sumption. We adopt a simple form of a welfare measure incorporating these dimensions, as suggested by Banks and Johnson (1994).7
W = H
(A+αK)θ, (1)
whereH denotes total household expenditure, andAandKdenote the number of adults and the number of children respectively. A measure of household consumption per equiv-alence scale,W, is the measure of household consumption when the cost of each member is taken into account. Therefore, if two households of different demographic character-istics have the same level ofW, then it can be argued that they have the same level of welfare. In equation (1), the weight for a child relative to an adult isα, and the economy of scale is reflected through the parameter θ. Bothαandθ take values between zero and one. Using the expenditure per person as a measure of household consumption im-plies that a child consumes as much as an adult and that there is no economy of scale in consumption of goods (α= 1,θ= 1).
7We are aware that the functional form used in the paper is not the only one used, but this version is a frequently
Since estimating the equivalence scale requires a set of assumptions about the household preference structure, we first study the effect of a child on consumption expenditure for different values of the equivalence scale (α = 1/2,1; θ = 1/2,1), and then apply our estimates of equivalence scale to illustrate the range of the effect of a child on individual consumption.
One way to estimateαandθin equation (1) is to use experimental data as in Koulo-vatianos et al. (2005). Given the lack of the data on direct compensation for an additional child or an adult, we take an alternative approach using the Engel curve estimation as in Deaton and Muellbauer (1986).8 That is, under the assumption that the inverse of food
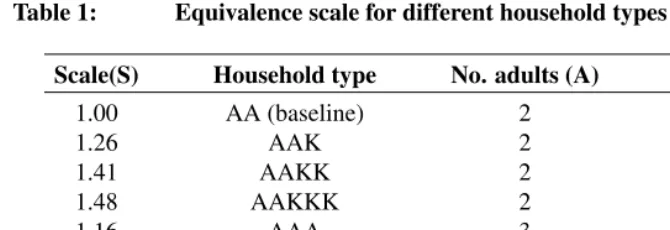
share of expenditure correctly indicates the welfare of household members, we calcu-late the amount of consumption that is needed in order to compensate for the additional members of the household compared to the baseline household. A household with two adults is taken as the baseline, and the estimated equivalence scales for households with different demographic characteristics are presented in Table 1. The estimation procedure is described in Appendix A. The second row in Table 1 states that a household with two adults and a child needs 126 percent of the consumption of the reference household in order to have the same level of welfare, suggesting that a child costs 52 percent of an adult’s consumption.9
It is notable that the estimation procedure taken in the paper considers food as having a private good aspect. This assumption is not against the finding by Deaton and Paxson (1998). They show that conditional on the per capita expenditure the food expenditure per person as a private good should increase as household size increases but that data suggest the opposite. Since food having a public good aspect did not prove to be a good explanation for their puzzle, our assumption seems to be reasonable with regard to their findings.
As Blundell and Lewbel (1991) pointed out, the conditional demand equation can be used to identify the cost of living indices for different household compositions but not the true equivalence scale. Restoring the equivalence scale requires an identifying assumption such as independence of base utility, or the assumption that unconditional preference orderings depend on demographics only through Barten scales. With this limitation, we use the relative magnitudes of the costs of additional household members in order to estimate the parameters of equivalence scale.
8The Engel curve refers to the demand for a good (food in this case) as a function of income when the prices
are fixed.
9Using an Indonesian survey (Susenas) in 1978, Deaton and Muellbauer (1986) estimated that a child costs 90
Table 1: Equivalence scale for different household types
Scale(S) Household type No. adults (A) No. children (K)
1.00 AA (baseline) 2 0
1.26 AAK 2 1
1.41 AAKK 2 2
1.48 AAKKK 2 3
1.16 AAA 3 0
1.30 AAAK 3 1
1.37 AAAKK 3 2
1.38 AAAKKK 3 3
Notes: 1)Data source: The 1993 Indonesian Family Life Survey. 2) A child is defined as a household member under age 15.
3) The estimation is conducted under the assumption that the inverse of food share of expenditure cor-rectly indicates the welfare of household members.
4) The estimated scale indicates the amount of consumption (compared to that of the baseline household) needed to make the household as well-off as the baseline household.
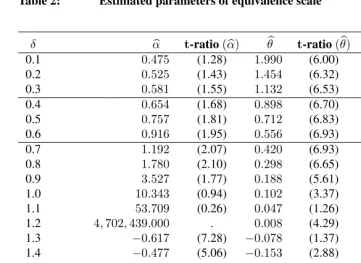
Given that there is a wide variety of household types in the sample, we run the fol-lowing non-linear regression to find a set of parameters of equivalence scale, using the equivalence scales for eight different household types as shown in Table 1. We do this instead of estimating the equivalence scale for every household type separately.
S=δ(A+αK)θ+ε, (2)
Table 2: Estimated parameters of equivalence scale
δ αb t-ratio(αb) θb t-ratio(bθ) Residual R2
0.1 0.475 (1.28) 1.990 (6.00) 1.609 0.882
0.2 0.525 (1.43) 1.454 (6.32) 0.901 0.934
0.3 0.581 (1.55) 1.132 (6.53) 0.547 0.960
0.4 0.654 (1.68) 0.898 (6.70) 0.336 0.975
0.5 0.757 (1.81) 0.712 (6.83) 0.203 0.985
0.6 0.916 (1.95) 0.556 (6.93) 0.118 0.991
0.7 1.192 (2.07) 0.420 (6.93) 0.064 0.995
0.8 1.780 (2.10) 0.298 (6.65) 0.032 0.998
0.9 3.527 (1.77) 0.188 (5.61) 0.016 0.999
1.0 10.343 (0.94) 0.102 (3.37) 0.015 0.999
1.1 53.709 (0.26) 0.047 (1.26) 0.033 0.998
1.2 4,702,439.000 . 0.008 (4.29) 0.072 0.566
1.3 −0.617 (7.28) −0.078 (1.37) 0.094 0.993
1.4 −0.477 (5.06) −0.153 (2.88) 0.099 0.993
1.5 −0.363 (3.39) −0.227 (3.82) 0.121 0.991
1.6 −0.284 (2.38) −0.294 (4.38) 0.149 0.989
1.7 −0.226 (1.76) −0.356 (4.75) 0.181 0.987
1.8 −0.183 (1.34) −0.415 (5.01) 0.215 0.984
1.9 −0.149 (1.05) −0.470 (5.20) 0.250 0.982
2.0 −0.122 (0.83) −0.523 (5.35) 0.288 0.979
Notes: 1) Data source: Table 1.
3. Statistical methods
In order to estimate the causal effect of fertility on material wellbeing, we apply a match-ing approach based on the treatment effect literature followmatch-ing the counterfactual model of causal inference. This approach is based on the intuitively attractive idea of contrast-ing the outcomes of a treatment group,Y1, with the outcomes of a ‘comparable’ control group,Y0, conditional on a set of characteristics of individuals,X. The outcome in this study is the household consumption expenditure per equivalence scale in 1997, and the treatment is defined as the birth of a child between 1993 and 1997. The control variable, X, includes the observable characteristics of households in 1993. Differences in the out-comes between the two groups are consequently attributed to the treatment,D. Matching methods for estimating causal effects have several advantages. First, they make no as-sumptions about the functional form of the dependence between the outcome of interest and the control variables. Second, matching ensures that the control variables of interest in the treatment group are similar to those in the control group and, thus, only similar units are compared. Third, since fewer parameters are estimated than in a traditional regression model, matching may be more efficient. This can be especially important if samples are small.
The matching method is based on the identifying assumption that, conditional onX, the outcome of the control groupY0is independent of the treatmentD. Using the notation of Dawid (1979), the assumption ofstrongly ignorable treatment assignment
Y0⊥⊥D|X, (3)
is sufficient to identify themean effect of treatment on the treated, or ATT (Rosenbaum and Rubin 1983):
AT T =E(Y1−Y0|D= 1) =E(Y1|D= 1)−E(Y0|D= 0). (4)
Assumption (3) produces a comparison group that resembles the control group of an ex-periment in one key aspect: conditional onX, the distribution ofY0givenD = 1is the same as the distribution ofY0givenD= 0:
In general, the households that experience the event of childbearing are likely to be differ-ent from those who do not in many respects. Examples include educational achievemdiffer-ent, working status, preference for having children, and so forth. Thus a simple tabulation of the treatment and controls will most likely yield biased estimates of the treatment ef-fect. In other words, these differences are going to affect the total household consumption expenditure, which induces a bias of the estimate due to selection. By matching the households based on a set of control variables, ATT in equation (4) corrects for the selec-tion bias due to the correlaselec-tion between childbearing and the observable characteristics of households (Rosenbaum and Rubin 1983). Strictly speaking, the matching method does not resolve any selection bias due to the unobservable characteristics (Heckman and Robb 1985). However, in so far as the observed variables used for matching also cap-ture outcomes due to unobserved heterogeneity, this bias will be reduced. Hence, the set of variables included in the matching should be as extensive as possible, including both exogenous and endogenous variables. To further refine our estimates, we consider the difference between outcome variables in 1993 and 1997.
AT T = E((Y1,1997−Y1,1993)−(Y0,1997−Y0,1993)|D= 1)
= E(Y1,1997−Y1,1993|D= 1)−E(Y0,1997−Y0,1993|D= 0)
= E(∆Y1|D= 1)−E(∆Y0|D= 0). (6)
The ATT in equation (6) is the so-calleddifference-in-differenceestimator, and corrects for the selection bias due to the fixed component of unobservable characteristics. That is, if the effect of the unobservable characteristics of a household such as the preference for childbearing on individual household consumption is present in both 1993 and 1997 and if its magnitudes are the same, it is removed in equation (6) as the change in the outcome variable is considered. It should be noted that the identifying assumption for ATT in equation (6) has a weaker form implying that the change in the outcome of the control group is independent of the treatment.
Y0,1997−Y0,1993⊥⊥D|X. (7)
However, our analysis is still prone to selection bias due to the time-varying component of the unobservable characteristics.
E(∆Y1−∆Y0|D= 1) =
X
i∈T
wi
∆Y1i−X j∈C
Wi,j∆Y0j
, (8)
that is, the average (weighted bywi) of the differences between the events,Y1i, of the
treatment groupT and the events, Y0j, of the control groupCweighted byWi,j. The
different matching algorithms differ in the construction of the comparison weights,Wi,j.
Traditional matching methods pair the non-treated with the treated persons that are ‘close’ in terms ofX using different metrics, e.g. caliper matching of different widths, Mahlanobis distance matching, or kernel-based matching. In practice (i.e. with samples of typical size) it is often difficult to match on high dimensionalX. Instead it is easier to do the matching based on individuals’ probability of treatment, or in other words the propensity score(Rosenbaum and Rubin 1983). We defineP(X)as the propensity score withP(X) =P(T = 1|X). If thebalancing property
D⊥⊥X|P(X) (9)
is satisfied, i.e. X andDare independent conditional on P(X), observations with the same propensity score must have the same distribution of observable and unobservable characteristics independent of treatment status. In other words, for a given propensity score, exposure to treatment is random. A theorem of Rosenbaum and Rubin (1983) demonstrates that if assumption (7) is satisfied, then
Y0,1997−Y0,1993⊥⊥D|P(X), (10)
provided0 < P(X) < 1, so that there is a positive probability that the eventsD = 1 andD = 0occur. This insight shows that matching can be performed onP(X)alone, provided that the balancing property (9) holds.
Finally, with stratification matching, the range of variation of the propensity score is di-vided into intervals such that within each interval, treated and control units have on aver-age the same propensity score.
4. Institutional background and data
4.1 Background and data description
In many developing countries we observe that fertility declines often come along with re-ductions in poverty. Indonesia is perhaps the most striking example of this pattern. Over the last four decades, Indonesia has experienced unprecedented economic growth together with a dramatic fertility decline. Table 3 shows that the real GDP per person increased by more than three times over the period 1970 to 1995, and total fertility rate fell by around 50%over the same period. This dynamic nature of the socio-economic change combined with a large population and its vast geographical diversity has attracted considerable inter-est among demographers and policymakers alike. We focus on the period between 1993 and 1997, which is at the end of the fertility transition and before the Asian Financial Crisis.10
Table 3: Total fertility rate and GDP per capita in Indonesia Period TFR GDP per capita
1965-1970 5.57 297.6
1970-1975 5.20 384.3
1975-1980 4.73 503.0
1980-1985 4.11 601.7
1985-1990 3.50 776.7
1990-1995 3.00 1,048.7
Notes: 1) Source of TFR: World Population Prospects: The 2000 Revision, Vol. I, United Nations Population Division (requoted from World Resources Institute)
2) Source of GDP per capita: World Development Indicators 2004, The World Bank.
3) GDP per capita is in constant 1995 US dollars, and indicates the value in the last year of each period.
Our study is based on data from the Indonesian Family and Life Survey (IFLS). The IFLS consists of three waves in total, IFLS1 conducted in 1993/94, IFLS2 and IFLS2+ in 1997 and 1998, and IFLS3 in 2000. In 1997, the Indonesian economy was hit by the Asian financial crisis. The second wave of the IFLS was conducted shortly before the event. We do not use any of the waves after 1997 in order to prevent estimates from being driven by the financial crisis. The IFLS is of exceptional quality and is ideal for the purpose of constructing a quasi-experiment of the type implemented here, as the survey contains extensive questionnaires on a range of aspects of household economy covering a period of steady economic growth. The survey has been conducted by RAND Corporation in col-laboration with UCLA and Lembaga Demografi, University of Indonesia (Frankenberg and Karoly 1995). The sample is representative of about 83%of the Indonesian popula-tion and contains over 30,000 individuals living in 13 of the 27 provinces in the country. IFLS1 has 7,224 households, and subsequent waves targeted all the split-off households as well as all the original households previously interviewed. The response rate for the IFLS2 was 94 percent of the original sample (Frankenberg and Thomas 2000). The survey contains a wealth of information collected at the individual and household levels, includ-ing multiple indicators of economic well-beinclud-ing such as consumption, income, and assets. It also includes information on education, migration, labor market outcomes, marriage, fertility, contraceptive use and health. Information on relationship among co-residents and non-co-resident family members and inter-generational mobility are included as well. Another outstanding feature of the IFLS is the quality of information provided at the com-munity level. The panel has information concerning the physical and social environment, infrastructure, employment opportunities, food prices, access to health and educational facilities, and the quality and prices of services available at those facilities.
4.2 Control variables
The educational attainment of household heads increases from 4.7 years in 1993 to 5.3 years in 1997. The proportion of households with new household heads in the second wave is four percent. General educational attainment of household members increases between 1993 and 1997 as can be seen in Table 2. The average number of adult men who worked in the previous year increases by 0.05, but that for adult women decreases by 0.07 in the second wave. The prevalence of child labor is low in the sample, which is partly due to the fact that the question of whether an individual worked in the past year does not capture part-time workers or unpaid family workers. The proportion of households with at least one farmer decreases from 42%in 1993 to 37%in 1997. Real monthly expenditure per person is 39,106 Rupiah in 1993 (in 1986 Rupiah), and it slightly decreases to 38,808 in 1997 (in 1986 Rupiah).11 The expenditure share of food is 61%in
1993, and it increases to 67%in 1997.
Table 4: Summary statistics of the balanced panel (N = 4,852) 1993 1997 Variable Mean S. D. Mean S. D.
Demographic variables
Urban residence (index) 0.44 (0.50) 0.43 (0.50) Household size 4.57 (2.07) 4.47 (2.01) Proportion of children in household 0.31 (0.22) 0.28 (0.22) Proportion of adults in household 0.69 (0.22) 0.72 (0.22) No. of children 1.62 (1.41) 1.44 (1.32)
No. of adults 2.95 (1.39) 3.03 (1.43)
No. of head’s own children 2.13 (1.66) 2.01 (1.56) No. of head’s own sons 1.11 (1.15) 1.05 (1.09) No. of head’s own daughters 1.02 (1.06) 0.96 (1.01) No. of generations 2.09 (0.58) 2.16 (0.60) No. of newly born children between waves 0.31 (0.55)
11The consumption expenditure includes expenditures on food, non-food and education. The questionnaire
Table 4: (Continued)
1993 1997
Variable Mean S. D. Mean S. D.
Household head characteristics
Head is female (index) 0.15 (0.36) 0.17 (0.38)
Head’s age 45.57 (14.21) 48.38 (13.81)
Head is Muslim (index) 0.87 (0.34) 0.87 (0.34)
Head worked last year (index) 0.82 (0.38) 0.86 (0.35)
Head’s years of schooling 4.74 (4.22) 5.34 (4.36)
Head is married (index) 0.85 (0.35) 0.83 (0.38)
Head has a spouse in HH (index) 0.81 (0.39) 0.79 (0.41)
Head is new in the second wave (index) 0.04 (0.19)
Educational attainment
No. of adult men with more than primary education 0.55 (0.81) 0.63 (0.86) No. of adult women with more than primary education 0.43 (0.72) 0.53 (0.79) No. of adult men with only primary education 0.30 (0.56) 0.33 (0.56) No. of adult women with only primary education 0.29 (0.51) 0.34 (0.54) No. of adult men with less than primary education 0.57 (0.66) 0.47 (0.63) No. of adult women with less than primary education 0.82 (0.71) 0.72 (0.68)
Working status
No. of adult men who worked last year 1.01 (0.70) 1.06 (0.67) No. of adult women who worked last year 0.69 (0.70) 0.62 (0.68) No. of male children who worked last year 0.02 (0.16) 0.01 (0.09) No. of female children who worked last year 0.02 (0.14) 0.00 (0.07) Household with at least one farmer (index) 0.42 (0.49) 0.37 (0.48)
Measure of welfare
Real monthly expenditure per person/100 (1986 Rupiah) 391.06 (324.99) 388.08 (308.12)
Expenditure share of food 0.61 (0.20) 0.67 (0.18)
Notes: 1) Data source: IFLS1 (1993) and IFLS2 (1997).
2) 21 observations are dropped due to missing expenditure share of food.
3) Only primary education (six years of schooling) was compulsory until 1994. Since then, junior high school became mandatory. However, the full enrollment of junior high school has not been achieved. 4) A child is defined as a household member who is less than 15 years old.
5. Household consumption expenditure and fertility
This section presents our estimates of the effect of a new born child on household con-sumption using the average treatment effect model. The estimation is conducted in two stages. The first stage involves estimating the probability of receiving the treatment, in this case, having a child born between two waves is estimated. In the second stage, the average treatment effect is estimated by comparing households with and without the treat-ment that have similar propensity scores.
Since the main purpose for probit estimation is to construct a set of variables that can be used as a basis for matching households, the specification includes an extensive set of variables representing a household’s demographic characteristics, educational attainment and working status including the head’s characteristics. However, there still remains an issue of unobservable characteristics such as cultural norms that might affect female la-bor force participation and fertility. The identifying assumption for the matching method is that the treatment (i.e. to have a newborn child between 1993 and 1997) is indepen-dent of the characteristics observed in 1993 including female working status and female education. This assumption is not testable, and it is true that in the presence of unobserv-able characteristics such as cultural norms, two households identical with respect of all the variables except the treatment assignment may be different in a way unobserved by a statistician. Therefore, we try to minimize the bias in matching households by including as many variables as possible, including endogenous variables, and by including quadratic terms and interaction terms of those variables.
Table 5 presents the results of estimating a probit model for having a child between 1993 and 1997 with a set of variables satisfying the balancing property. Among the de-mographic variables, the age of previous children is an important determinant in addition to the number of previous children to explain a further childbearing. The households that have more children under five face a higher likelihood of a new birth as the household head ages. When there are more children aged 10 to 14, a household is less likely to experience a birth and the tendency is mitigated as the number of children of 10 to 14 increases. When more generations live together, a household has higher chance of having a birth.
Table 5: Probit estimation of having a new child between 1993 and 1997
Explanatory variables Coefficients Std. Error Dependent variable: Index for having a new-born child between 1993 and 1997
Demographic Urban -0.035 (0.051)
characteristics No. of children of ages 0-4 -0.084 (0.134)
No. of children of ages 0-4 sq. -0.013 (0.036)
No. of children of ages 0-4 * Head’s age 0.005 * (0.002)
No. of children of ages 5-9 0.012 (0.139)
No. of children of ages 5-9 sq. 0.017 (0.037)
No. of children of ages 5-9 * Head’s age -0.001 (0.003)
No. of children of ages 10-14 -0.521 ** (0.125)
No. of children of ages 10-14 sq. 0.101 ** (0.027)
No. of children of ages 10-14 * Head’s age 0.004 (0.002)
No. of adults -0.069 (0.047)
No. of generations 0.173 ** (0.051)
Household Head’s age -0.052 ** (0.011)
head’s Head’s age sq./100 0.029 ** (0.010)
characteristics Head being Muslim 0.309 ** (0.069)
Head worked last year -0.273 ** (0.087)
Head worked last year * Head’s female 0.167 (0.148)
Head’s years of schooling -0.011 (0.009)
Head’s years of schooling * Head’s female -0.053 ** (0.018)
Head’s female -0.060 (0.142)
Educational No. of adult men with more than compulsory education -0.013 (0.063) attainment No. of adult women with more than compulsory education 0.139 ** (0.048) No. of adult men with only compulsory education -0.001 (0.074) No. of adult women with only compulsory education 0.079 (0.048) No. of adult men with less than compulsory education -0.025 (0.081)
Working status No. of adult men who worked last year 0.196 ** (0.055)
No. of adult women who worked last year -0.002 (0.035)
No. of male children who worked last year -0.110 (0.148)
No. of female children who worked last year -0.158 (0.161)
Any member worked as a farmer last year 0.069 (0.050)
Constant 0.621 * (0.275)
No. of observations 4,694
Log Likelihood -2,406.96
Notes: 1) Standard errors are in parentheses. 2) * significant at 5%; ** significant at 1%. 3) The unit of observation is a household.
Among a set of variables representing educational attainment of household members only the number of women with more than primary education exhibits a significant as-sociation with having a child. The fact that higher female education is correlated with childbearing suggests that female education reflects higher income in the context of In-donesia.
Regarding the working status of household members, the only significant variable is the number of men working, which is positively associated with a new birth. This again suggests an income effect where higher labor income leads to more children.12
Table 6 presentsthe effect of a newly born child on expenditurein a household using the matching method described in Section 4 for the whole sample. The outcome is the difference in the household real monthly expenditure per equivalence scale.13 A child
is defined as a household member of age below fifteen. When the expenditure per per-son is used as a measure of individual household income, as in the first column, a newly born child has a significant negative impact on expenditure per person. Using the nearest neighbor matching method, the households with a new born child between the two waves experienced a decrease in consumption per person by 7,600 Rupiah, or 20 percent of con-sumption per person in 1997. This implies a substantial impact of fertility on household economy. Other matching methods produce similar results in terms of magnitude.
When a child is counted as half of an adult, as in the second column, the ATT is significant and negative, and the magnitude is in the range of 4,200 to 4,800 Rupiah. This is around 40%less than the per-capita reduction in expenditure. Although this result is expected, the level of change is surprising. The cost of a child is calculated to be 52%of that of an adult based on the comparison of the baseline household and the household of two adults and one child in Table 1. Therefore, the assumption that the weight of a child’s consumption is one half is not totally unrealistic. The point is that the effect of a new born child on the individual household consumption can decrease by 40%when a child consumes a half of what an adult consumes.
12Strictly speaking there is no theoretical justification for having the number of adults working rather than the
proportion of them as an explanatory variable. In principle the number and the proportion convey the same information. However, we are careful in introducing nonlinear variables in the specification because those variables seem to be hard to interpret for the marginal effects. Moreover, the specifications with nonlinear variables tend to make the balancing property unsatisfied. Therefore, we stick to the linear specification. 13If a birth took place near the time of the survey in 1997, then the consumption expenditure might be measured
Table 6: Effect of fertility on household expenditure per equivalence scale I
Equivalence scale Cons. per Case A Case B Case C person
α 1.00 0.50 1.00 0.50
θ 1.00 1.00 0.50 0.50
Matching method n(T) n(C)
Nearest neighbor 1,135 853 −76.169∗∗ −50.339∗∗ −20.347 13.320 (18.318) (20.700) (39.841) (36.119) Radius 1,135 3,546 −76.025∗∗ −42.159∗∗ −7.361 34.697
(9.710) (12.568) (19.286) (26.586) Kernel 1,135 3,546 −80.243∗∗ −52.637∗∗ −17.531 18.202
(9.888) (13.543) (20.718) (20.501) Stratification 1,135 3,546 −82.023∗∗ −56.011∗∗ −20.560 13.557
(10.585) (13.384) (20.946) (24.550)
Notes: 1) The dependent variable is the difference in real expenditure per equivalent scale between 1993 and 1997 (100 Rupiah).
2) Standard errors (S.E.) are computed using bootstrap.
3) 179 households with more than one newborn child were dropped. 4) Treatment is to have a newly born child between 1993 and 1997.
5) n(T) and n(C) denote the size of treatment group and controlled group, respectively. 6) * significant at 5%; ** significant at 1%.
Next, the role of economy of scale is examined. The third column in Table 6 deals with a case where the economy of scale parameter is one half with a child consuming as much as an adult. The ATT is still negative but not significant. The magnitude of the ATT is in the range of 1,000 to 1,300 Rupiah, which is only around 16%of the reduction in per-capita expenditure. That is, the effect of new childbearing on individual household consumption almost disappears when the parameter of economy of scale is one half. Un-der this assumption, the expenditure of a household with three adults increases by 32% compared to a household of two adults at the same level of utility.14 The estimated
equiv-alence scale in Table 1 suggests that the expenditure increases by 16%from a household of two adults to that of three adults. Therefore, the size of one half as a parameter of economy of scale is reasonable.
When both the relative weight of a child and the economy of scale parameter are set to be one half as in column (4) of Table 6, the ATT becomes positive but insignificant. The result is well expected from columns (2) and (3), but it is still surprising that the individual household consumption can increase even after a new birth under a different equivalence scale. When the significance of the estimates in Table 6 is considered, the exercise at least suggests that the negative effect of a new birth on individual household consumption can disappear for some range of realistic values of the equivalence scale.15 16
Next we estimate the effect of a child on household consumption applying the es-timates of the equivalence scale obtained in Table 2. The results are presented in Ta-ble 7. The first column is the case where expenditure per person is used as a measure of household consumption. The effects of a newly born child on consumption per estimated equivalence scale in the other columns are all negative although the estimates in column (3) and (4) are not precisely estimated. The magnitudes of the ATT are in the range from 20 percent to 65 percent of that estimated when the per-capita expenditure is used as a measure of consumption. Since the estimates of both equivalence scale parameters in Ta-ble 2 are between 0.5 and 1, the ATT in column (4) of TaTa-ble 6 serves as an upper bound of the effect of a birth on individual household consumption. On the other hand, when it is used as a measure of individual consumption, the expenditure per person is likely to exaggerate the effect of a new born child on individual household consumption at least by 35%.
15Given the huge geographical diversity in Indonesia, one might expect a systematic difference between rural
and urban samples due to the differences in relative prices or in the child care cost. However, it is found that the patterns of estimates with different equivalence scales in rural and urban samples are similar to that from the total sample.
Table 7: Effect of fertility on household expenditure per equivalence scale II
Equivalence scale (ES) Cons. per Implied Implied Implied person ES 1 ES 2 ES 3
α 1.00 0.65 0.76 0.92
θ 1.00 0.90 0.71 0.56
Matching method n(T) n(C)
Nearest neighbor 1,135 853 −76.169∗∗ −54.287∗∗ −42.877 −27.683 (18.318) (20.914) (25.913) (32.502) Radius 1,135 3,546 −76.025∗∗ −47.248∗∗ −33.178∗ −15.625
(9.710) (11.270) (16.115) (19.355) Kernel 1,135 3,546 −80.243∗∗ −56.250∗∗ −42.872∗∗ −25.685
(9.888) (14.446) (15.829) (19.121) Stratification 1,135 3,546 −82.023∗∗ −59.196∗∗ −45.903∗∗ −28.721
(10.585) (14.164) (15.759) (20.025)
Notes: 1) The dependent variable is the difference in real expenditure per equivalent scale between 1993 and 1997 (100 Rupiah).
2) Standard errors (S.E.) are computed using bootstrap.
3) 179 households with more than one newborn child were dropped. 4) Treatment is to have a newly born child between 1993 and 1997.
5) n(T) and n(C) denote the size of treatment group and controlled group, respectively. 6) * significant at 5%; ** significant at 1%.
6. Private expenditure on child and intra-household bargaining
The finding of the previous section has implications on the relationship between fertility and the expenditure on private-public goods. Our results indicate that fertility affects household consumption differently depending on the assumption about the economy of scale and the relative weight of a child consumption to that of an adult (see Table 6). These findings in turn, imply that the characteristics of household consumption is likely to affect fertility.17 In particular, the composition of the expenditure on private and public
goods may reflect the price of having a child. For example, the share of private goods such as children’s education in household expenditure can be interpreted as indicating a
17We owe this section to two anonymous referees, who suggested adding the discussion on fertility, the
household’s preference for quality of a child. The larger share of educational expenditure a household has, the less likely it is to give birth. We test this hypothesis using a probit model as used in Table 5. As a measure of the expenditure on private goods, three vari-ables are used: share of educational expenditure, educational expenditure per person and educational expenditure per child.18
The results are displayed in Table 8. The basic specification in column (1) shows the result similar to that of Table 5. Most variables representing household characteristics and provinces are abbreviated in order to keep the focus on educational expenditure. Total household expenditure per capita does not exhibit any significant impact on fertility in the sample of all the households, whereas a positive income effect is found for the group of households with any child in column (4).
Table 8: The effect of educational expenditure on fertility (Probit Model) Dependent variable: Index for (1) (2) (3) (4) having a newly-born child All All All HH with
between 1993 and 1997 children
Share of educational expenditure - −0.864∗∗ - -(0.199)
log Educational expenditure - - −0.084∗∗
-per -person (0.015)
log Educational expenditure - - - −0.072∗∗
per child (0.015)
log Total household expenditure −0.003 0.012 0.059 0.083∗
per person (0.035) (0.035) (0.036) (0.042)
No. of observations 4,694 4,694 4,694 3,480 Log Likelihood −2,421.43 −2,411.55 −2,405.13 −1,880.73
Notes: 1) Standard errors are in parentheses. 2) * significant at 5%; ** significant at 1%. 3) The unit of observation is a household.
4) All the explanatory variables denote the values in 1993. 5) 179 households with more than one newborn child were dropped.
6) Household characteristics and province dummies are included in all specifications.
18 The educational expenditure as a part of the information on consumption expenditure is measured at the
Column (2) of Table 8 indicates that a household spending more on education is less likely to give birth as expected. The implied marginal effect suggests that one percent change in educational share of expenditure is associated with a quarter percent change in the probability of giving birth between 1993 and 1997. The absolute level of educational expenditure per person also has a negative effect on the likelihood of having a new child as in column (3). Using the educational expenditure per child as a measure of the educa-tional expenditure generates the similar result, where only households with any child are considered (column (4)). The changes in probability of giving birth associated with one percent change in educational expenditure per person and per child are 0.25 percent and 0.23 percent, respectively. Therefore, it may be inferred that those households with more expenditure on private goods like education are less likely to give birth.
In examining the relationship between fertility and household consumption so far, we have assumed that a household makes a decision the same way as an individual does. If a household behaves collectively through a bargaining process among its members, the specification for equivalence scale needs to be modified accordingly as suggested by Browning et al. (2006). Therefore, it would be informative to investigate whether the framework of a unitary household is supported by the same data.
In understanding the relationship between household preference and fertility, the de-mand for private goods may be determined by household members with different prefer-ence and bargaining power (Browning and Chiappori 1998). Specifically, the expenditure on children’s education may be determined by the husband and wife’s collective decision. It is a common conjecture that mothers tend to care more about children’s education, or that mothers at least have different preference from fathers. Therefore, we focus on in-vestigating the differences in preferences of husband and wife with regard to children’s education in the context of Indonesia. Using the first wave of the IFLS, the effect of the bargaining power on the educational share of expenditure is examined.
One measure of bargaining power suggested in the literature is nonlabor income (Lundberg et al. 1997; Duflo 2003; Park 2007). In the IFLS, the nonlabor income is constructed by combining income from pension, scholarship, insurance claim, lottery or gift from family, friends and charity. One limitation is that the percentage of the house-holds with positive nonlabor income is relatively small (17% for husband’s nonlabor in-come, 22% for wife’s at household level). Another measure indicating bargaining power is premarital assets (Quisumbing and Maluccio 2003; Park 2007). The IFLS has the infor-mation on premarital assets, but there is a substantial attrition (48%) due to the availability of premarital assets and the relevant price indices.
a measure of bargaining power. That is, the sum of shares of ownership between husband and wife is set to be one. A husband’s share of one asset, for example, farm business should be interpreted to be valid among households with farm business since it is, in fact, the interaction term between farm business owner dummy and the husband’s share.
As discussed in the literature, we test for unitary versus collective household decision process by investigating whether the individual resources of husband and wife have the same effect on educational expenditure. Also we examine whether husband’s share of assets have any impact on the expenditure on education.19
Regarding the dependent variable, there are two sources for educational expenditure in the IFLS. The first is the information on educational expenditure as a part of the house-hold consumption expenditure. The educational expenditure for a househouse-hold includes the expenditure on adults’ education as well as children’s education. The second is the ed-ucational expenditure for a particular child. The IFLS has a special section on children under age 14, which was conducted for two randomly chosen children per household. The educational expenditure on a child was collected only for those attending school. We use both pieces of information. First, the household educational expenditure per person is used as a measure of educational expenditure with the assumption that the expenditure on adults’ education is negligible. Second, the results using the expenditure on a school child as a measure of educational expenditure in a sample of children are presented.
The results using the data at the household level are presented in Table 9. According to column (1), households with non-farm business tend to spend less on education, whereas households with farm business or house do not exhibit any difference. Husband’s share of three assets does not have any impact on educational spending. Households with larger total household expenditure per person tend to spend more on education. One percent increase in per capita household expenditure is associated with 2.5 percent increase in share of the expenditure on education. This magnitude is roughly consistent in column (2) and (3). In column (2) the husband’s and wife’s premarital assets have an impact on educational spending with different direction, but the result does not reject the hypothesis that they have the same impacts at the conventional level of significance. Husband’s and wife’s nonlabor income does not show any effects significantly different from each other as in column (3). When the log of educational expenditure per person is used as a dependent variable in column (4) to (6), the results remain qualitatively the same.
19Under the null hypothesis that the resources of a husband and a wife have the same effects, the husband’s
Table 9: Household bargaining and educational spending I
(1) (2) (3) (4) (5) (6)
Dependent variable Share of educational log Educational expenditure expenditure per person
Farm business owner 0.003 - - 0.040 -
-(0.004) (0.052)
Farm business −0.006 - - −0.080 -
-husband’s share (0.009) (0.111)
Non-farm business −0.009∗ - - −0.037 -
-owner (0.004) (0.046)
Non-farm business 0.003 - - 0.022 -
-husband’s share (0.008) (0.097)
House owner −0.002 - - 0.019 -
-(0.005) (0.064)
House husband’s 0.009 - - 0.052 -
-share (0.009) (0.107)
log Husband’s - −0.001 - - −0.002
-premarital asset(α1) (0.001) (0.009)
log Wife’s - 0.002 - - 0.011
-premarital asset(α2) (0.001) (0.012)
log Husband’s - - −0.0004 - - −0.003
nonlabor income(α3) (0.0010) (0.013)
log Wife’s nonlabor - - −0.0001 - - 0.020
income(α4) (0.0009) (0.012)
log Total household 0.025∗∗ 0.018∗∗ 0.023∗∗ 0.806∗∗ 0.800∗∗ 0.802∗∗
expenditure per person (0.004) (0.005) (0.004) (0.039) (0.051) (0.039) No. of observations 4,595 2,412 4,466 4,595 2,412 4,466
R2 0.19 0.21 0.19 0.44 0.47 0.44
p-value for:
H0:α1=α2 - 0.08 - - 0.38
-H0:α3=α4 - - 0.80 - - 0.21
Notes: 1) White heteroscedasticity-corrected standard errors are in parentheses. 2) * significant at 5%; ** significant at 1%.
3) The unit of observation is a household.
The results from the child level data are shown in Table 10. In column (1), households with non-farm business tend to spend more on children’s education in contrast to column (1) in Table 9. The difference is likely to be due to the selection of samples. Households with other assets do not spend on education any differently. Husband’s share of the three assets do not have any significant effects on children’s educational spending. In column (2) the premarital assets of a husband and a wife do not have any significant impact on education nor are their effects different from each other. Nonlabor income of a husband and a wife in column (3) is associated with a larger spending on education, but the result does not reject the hypothesis that their effects are of the same magnitude.
One limitation of the analysis is that the size of samples vary over the specifications due to the availability of data. However, data at both household and child level produce results in favor of a unitary household model. The results are consistent with Park (2007), who did not find a clear evidence that a parental household bargaining plays an impor-tant role in the decision of expenditure on children’s education using the third wave of IFLS.20 Therefore, the framework of a unitary household seems to be valid at least in
understanding the relationship between fertility and household consumption.
Table 10: Household bargaining and educational spending II
(1) (2) (3)
Dependent variable:
log Educational expenditure for a child
Farm business owner −0.087 -
-(0.051)
Farm business husband’s share 0.097 -
-(0.106)
Non-farm business owner 0.125∗∗ -
-(0.041)
Non-farm business husband’s share 0.043 - -(0.087)
House owner −0.073 -
-(0.061)
House husband’s share −0.166 -
-(0.099)
20Park (2007) also found a consistent evidence in favor of a collective household model examining the children’s
Table 10: (Continued)
(1) (2) (3) Dependent variable: log Educational expenditure
for a child
log Husband’s premarital assets (α1) - 0.010
-(0.008) log Wife’s premarital assets (α2) - −0.008
-(0.009)
log Husband’s nonlabor income (α3) - - 0.019
(0.010)
log Wife’s nonlabor income (α4) - - 0.015
(0.010) log Total household expenditure 0.376∗∗0.351∗∗0.395∗∗
per person (0.036) (0.046) (0.037)
Female 0.021 0.032 0.026
(0.034) (0.042) (0.034)
Age 0.113∗∗0.122∗∗0.109∗∗
(0.009) (0.011) (0.010)
No. of observations 2,665 1,716 2,612
R2 0.34 0.35 0.34
p-value for:
H0:α1=α2 - 0.14
-H0:α3=α4 - - 0.81
Notes: 1) White heteroscedasticity-corrected standard errors are in parentheses. 2) * significant at 5%; ** significant at 1%.
3) The correlation between children from the same household is allowed when the standard errors are calculated.
4) The unit of observation is a child.
5) All the explanatory variables denote the values in 1993. 6) 179 households with more than one newborn child were dropped.
7. Conclusion
This paper describes the causal effect of fertility on household consumption in Indonesia at the end of a fertility transition in a unitary household framework. Using the nonpara-metric propensity score matching method, it is found that a newly-born child leads to a reduction of consumption by 20 percent within four years, when consumption expendi-ture per person is used as a measure of household consumption. This effect, however, is extremely sensitive to the choice of equivalence scale. Using the estimates of equivalence scale based on the assumption that food share inversely indicates the level of household welfare, it is shown that the effect of a child on household consumption is still negative but the magnitude is in the range from 20 to 65 percent of that obtained when per-capita consumption is used as a measure of household consumption. Hence, the results suggest that the analysis based on the conventional measure of poverty is likely to exaggerate the effect of fertility on poverty at least because the equivalence scale is not properly taken into account (e.g. Mason and Lee 2004).
The prevalence of poverty measure based on consumption per person is mainly due to its practical convenience and the strong assumptions required for alternative measures. Our analysis presents a reasonable and practical way of estimating the equivalence scale and applying it to the question on the relationship between fertility and poverty. The increasing quality of survey data in recent years enables one to incorporate the equivalence scale in the poverty analysis in demographic research at least within a certain country.
The sensitivity of the effect of fertility on household consumption with respect to the equivalence scale generates two theoretical implications. First, it illustrates the impor-tance of separating public from private consumption. The expenditure on private goods such as children’s education reflects the price of having a child. Second, our analysis pro-vides an empirical bridge between unitary and collective models of the household. The results suggest that the expenditure share of private goods can be used to test for a collec-tive decision making process in a household. Although the data are limited, our finding is that the demand for children’s education does not seem to be affected by the parental bargaining process.
8. Acknowledgements
References
Anand, S. and Harris, C. J. (1994). Choosing a welfare indicator.The American Economic Review84(2): 226–231.
Angrist, J. and Evans, W. (1998). Children and their parents’ labor supply: Evidence from exogenous variation in family size.The American Economic Review88(3): 450–477. Banks, J. and Johnson, P. (1994). Equivalence scale relativities revisited. Economic
Journal104(425): 883–890.doi: 10.2307/2234982.
Becker, S. O. and Ichino, A. (2002). Estimation of average treatment effects based on propensity scores.The Stata Journal2: 358–377.
Birdsall, N., Kelley, A. C., and Sinding, S. W. (2001).Population matters: Demographic change, economic growth, and poverty in the developing world. Oxford University Press.
Blundell, R. and Lewbel, A. (1991). The information content of equivalence scales. Journal of Econometrics50: 49–68.doi: 10.1016/0304-4076(91)90089-V.
Browning, M. and Chiappori, P. A. (1998). Efficient intra-household allocations: A general characterization and empirical tests.Econometrica66(6): 1241–1278. Browning, M., Chiappori, P. A., and Lewbel, A. (2006). Estimating
consump-tion economies of scale, adult equivalence scales, and household bargaining power. Department of economics discussion paper series 289. Oxford: University of Oxford. doi: 10.2307/2999616.
Dawid, A. P. (1979). Conditional independence in statistical theory.Journal of the Royal Statistical Society Series B41: 1–31.
De Santis, G. and Maltagliani, M. (2003). Equivalence scales: A fresh look at an old problem. theory and empirical evidence. In: Camilo, D. and Guido, F. (eds.). Household behaviour, equivalence scales, welfare and poverty, pp. 29–54. New York: Physica-Verlag Heidelberg.
Deaton, A. and Paxson, C. (1998). Economies of scale, household size, and the demand for food.Journal of Political Economy106(5): 897–930.doi: 10.1086/250035. Deaton, A. S. and Muellbauer, J. (1986). On measuring child costs: With applications to
poor countries.Journal of Political Economy94(4): 720–744. doi: 10.1086/261405. Duflo, E. (2003). Grandmothers and granddaughters: Old-age pensions and
Frankenberg, E. and Karoly, L. (1995). The 1993 Indonesian family life survey: Overview and field report. Field report. Santa Monica: RAND.
Frankenberg, E., Smith, J. P., and Thomas, D. (2003). Economic shocks, wealth and welfare. Journal of Human Resources38(2): 280–321.
Frankenberg, E. and Thomas, D. (2000). The Indonesia family life survey (IFLS): Study design and results from waves 1 and 2. (dru-2238/1-nia/nichd). Santa Monica: RAND. Heckman, J., Ichimura, H., and Todd, P. E. (1998). Matching as an econometric evaluation estimator.Review of Economic Studies65: 261–294.doi: 10.1111/1467-937X.00044. Heckman, J. J. and Robb, R. (1985). Alternative methods for evaluating the
impact of interventions: An overview. Journal of Econometrics 30(1): 239–267. doi: 10.1016/0304-4076(85)90139-3.
Koulovatianos, C., Schröder, C., and Schmidt, U. (2005). On the income dependence of equivalence scales. Journal of Public Economics 89: 967–996. doi: 10.1016/j.jpubeco.2004.09.005.
Lanjouw, P. and Ravallion, M. (1995). Poverty and household size. Economic Journal 105(433): 1415–1434.doi: 10.2307/2235108.
Lipton, M. (1998).Successes in anti poverty. Geneva: International Labor Organization. Livi-Bacci, M. and De Santis, G. (1998). Population and poverty in developing world.
Oxford: Clarendon Press.
Lundberg, S. J., Pollak, R. A., and Wales, T. J. (1997). Do husbands and wives pool their resources? evidence from the United Kingdom child benefit. The Journal of Human Resources32(3): 463–480.doi: 10.2307/146179.
Mason, A. and Lee, S. H. (2004). The demographic dividend and poverty reduction. Paper presented in seminar on the relevance of population aspects for the achievement of the millennium development goals, November 17-19 2004. New York, U.S.A.
Mattei, A. (2004). Estimating causal effects in experimental and observational studies suffering from missing data. Ph.d thesis, Firenze: Applied Statistics, Dipartimento di Statistica "G. Parenti", Universita degli Studidi Firenze.
McNicoll, G. (1997). Population and poverty: A review and restatement. Policy research division working papers 105. New York: Population Council.
Oxford University Press.
Moav, O. (2005). Cheap children and the persistence of poverty. The Economic Journal 115(500): 88–110.doi: 10.1111/j.1468-0297.2004.00961.x.
Park, C. (2007). Marriage market, parents’ bargaining powers, and children’s nutri-tion and educanutri-tion. Oxford Bulletin of Economics and Statistics 69(6): 773–793. doi: 10.1111/j.1468-0084.2007.00479.x.
Quisumbing, A. R. and Maluccio, J. A. (2003). Resources at marriage and intrahousehold allocation: Evidence from Bangladesh, Ethiopia, Indonesia, and South Africa.Oxford Bulletin of Economics and Statistics65(3): 283–327. doi: 10.1111/1468-0084.t01-1-00052.
Ravallion, M. (1996). Issues in measuring and modelling poverty.The Economic Journal 106(438): 1328–1343.doi: 10.2307/2235525.
Rosenbaum, P. T. and Rubin, D. B. (1983). The central role of propensity score in obser-vational studies.Biometrika70: 41–55.doi: 10.1093/biomet/70.1.41.
Rosenzweig, M. and Schultz, T. P. (1985). The demand for and supply of births: Fertility and its life cycle consequences.The American Economic Review75(5): 992–1015. Rosenzweig, M. and Wolpin, K. (1980). Testing the quantity-quality fertility model:
The use of twins as a natural experiment. Econometrica 48(1): 227–240. doi: 10.2307/1912026.
Rosenzweig, M. and Wolpin, K. (2000). Natural “natural experiments” in economics. Journal of Economic Literature38(4): 827–874.