BREEDING AND GENETICS
Visual Selection for Yield in Cotton Breeding Programs
Daryl T. Bowman*, Fred M. Bourland, Gerald O. Myers, Ted P. Wallace, and David Caldwell
D. T. Bowman, Crop Science Department, North Carolina State University, Raleigh, NC 27695-8604; F. M. Bourland, University of Arkansas, NEREC, P.O. Box 48, Keiser, AR 72351; G. O. Myers, Department of Agronomy, Louisiana State University, Baton Rouge, LA 70803-2110; T. P. Wallace, Mississippi State University, Box 9555, Mississippi State, MS 39762; D. Caldwell, LSU Ag Center, Red River Research Station, P.O. Box 8550, Bossier City, LA 7113
* Corresponding author: [email protected]
ABSTRACT
Cotton breeders routinely discard progeny rows that visually appear low yielding. Such a pro-cess is essential, because it would be highly inef-ficient to continue to work with progeny that have no commercial value. A dilemma for all breeders is whether they are inadvertently discarding promising lines. Cotton breeders from four states conducted a 2-year study to determine if visual selection was an effective method of selecting for yield. To accomplish this, progeny rows in repli-cated preliminary yield trials for seedcotton yield were visually rated. Correlations between visual ratings and actual yields ranged from -0.22 to 0.70, and there were differences among breeders in their ability to select superior-yielding genotypes. High-yielding genotypes that were visually rated low would have been discarded in every study. This is an inherent danger in visual selection, but recur-ring placement of high-yielding check cultivars and the use of a grid system should alleviate some of this problem. Generally, high-yielding genotypes were rated higher than low-yielding genotypes. Range of yields, mean yields, plant height, and soil type did not affect a breeder’s ability to visually rate the plots for seedcotton yield.
V
isual selection was the first breeding method practiced by man. Beginning in the 1700s, visual selection within cotton (Gossypium hirsutumL.) cultivars resulted in the development of adapted, successful cultivars in the USA (Niles and Feaster, 1984). In the early 1800s, Henry W. Vick in Mississippi developed ‘Hundred Seed’ and later
‘Jethro’, which were selected by workers in the field from the largest and most productive plants of ‘Petit Gulf’ (Moore, 1956). With so much variability in the stocks of introduced cultivars, “good” plants were easy to identify and progress was made toward yield improvement (Richmond, 1951).
There is some evidence that visual selection in the early generations is effective in identifying su-perior phenotypes. Phenotypic variability among in-dividual plants is large even for established cultivars (Kohel and White, 1963; Thomson, 1973a). Gardner (1961) devised a method of stratifying the selection block in order to manage environmental variability among plants. Verhalen et al. (1975) used Gardner’s grid system to improve selection in cotton by 20 to 35%. Meredith and Bridge (1973) used visual selec-tion to identify F2 plants that had higher yielding F3
progeny. The 5.7% gain in yield was significant, but the authors recommended that selection begin in the F3 generation due to nonadditive gene effects evident
in the F2 generation.
In later generations, selection among unrepli-cated progeny becomes a challenge. In a typical cot-ton breeding program, actual harvest of hundreds or thousands of rows may be impossible. Yet a breeder must quickly evaluate and select superior lines for advancement (Allard, 1966). Effectiveness of selec-tion for superior phenotypes declined from single hills to single rows to multi-row plots in a study by Thomson (1973b). Variability due to inter-genotypic competition that increased from single hills to multi-row plots was thought to be involved.
only half as effective as actual yield determination for identifying superior-yielding phenotypes.
Dao and Ram (1992) observed a positive correla-tion of 0.36 between visual yield rating and actual yield in soybean and concluded this was an effective discrimination method, although lodging hampered their judgment in scoring for high yield. Plant height and maturity of plants also influenced judgment. Byth et al. (1969) also found positive phenotypic correlations between visual yield ratings and actual measured yields.
The ability of three breeders to select superior lines of soybean has been compared (Helms et al., 1995). Two of three breeders were able to select lines that were higher yielding than the population average and were just as effective as selection based on weighed yields. This study involved crosses of adapted with unadapted lines, but most crosses in a typical commercial cotton breeding program are usually among adapted lines only.
Response to visual selection in small grains was minimal. In oat (Avena sativa L.), visual selection for high or low yield was ineffective (Frey, 1962). Stuthman and Steidl (1976) were not able to consis-tently select high or low yielding lines and cautioned against discarding large numbers of oat progeny via visual selection. Studies by Briggs and Shebeski (1970) on wheat (Triticum aestivum L.) concluded that selection intensity of visual ratings should be low because of inaccuracies in choosing the best-yielding lines. Selection intensity in triticale (Tritioco secale
W.) via visual rating for yield should be low also (Salmon and Carter, 1978).
The objective of this study was to determine if vi-sual selection could be effectively used to determine the highest yielding lines in unreplicated nurseries for advancement to replicated trials. Information from this study could aid cotton breeders in deciding whether to discard potentially low yielding lines in progeny rows prior to actual yield testing to make their breeding program more efficient.
MATERIALS AND METHODS
The study was conducted in 2001 and 2002 in Arkansas, Louisiana, Mississippi, and North Caro-lina. Data from Arkansas are reported only for 2002. Mean seedcotton yield and, when available, range of yields, soil type, and plant height, were analyzed to determine their impact on the ability to choose higher yielding genotypes.
In Arkansas, 188 progeny rows were rated for yield by three persons, one each with greater than 30 yr, greater than 4 yr, and less than 1 year of breed-ing experience. The plots were 12 m long and four rows wide and harvested by machine. Two check cultivars were used and a check was planted in every 6th plot. The accuracy of the visual assessments was
compared with actual measured seedcotton yields. Visual ratings of yield potential were based on a scale of 0 to 9, where 0 = poor yield potential and 9 = excellent yield potential.
In Louisiana in 2001, a strains test was rated for seed cotton yield on three replicates at three locations. Yield potential was rated using the 0 to 9 scale. Plots were four rows and 12.2 to 15.3 m long. Ratings were made on the center two rows. There were 20 entries in the trial. Visual ratings were taken prior to defoliation.
In Mississippi, the official early-maturing state-wide variety test at Brooksville was rated for seedcotton yield in 2002. The test had 32 entries and four replicates. Yield potential was rated using a 0 to 5 scale, where 0 = poor yield potential and 5 = best yield potential.
In North Carolina, visual ratings on a scale of 1 (worst yield potential) to10 (best yield potential) were made on all advanced breeding line (strain) trials at three locations in 2001 and two locations in 2002. Each plot consisted of two rows, 12 m long with 3 or 4 replicates per test. Every replicate was rated. Seedcot-ton yields were correlated with visual ratings. Eleven tests were rated in 2001 and 15 in 2002.
The genetic material in the studies at Arkansas, Louisiana, and North Carolina are typical of cotton breeding programs. Since the genetic material in the Mississippi trial was part of a state-wide variety trial, the material had been tested and selected prior to entry into the trial. In either case, the objective of this study was to determine if breeders could visually discern higher yielding genotypes without going through the expensive process of yield testing all progenies.
In all replicated trials, correlations were run as if entries were not repeated. Correlation coefficients were examined between identical trials at the two separate locations in both years of the North Carolina data.
RESULTS AND DISCUSSION
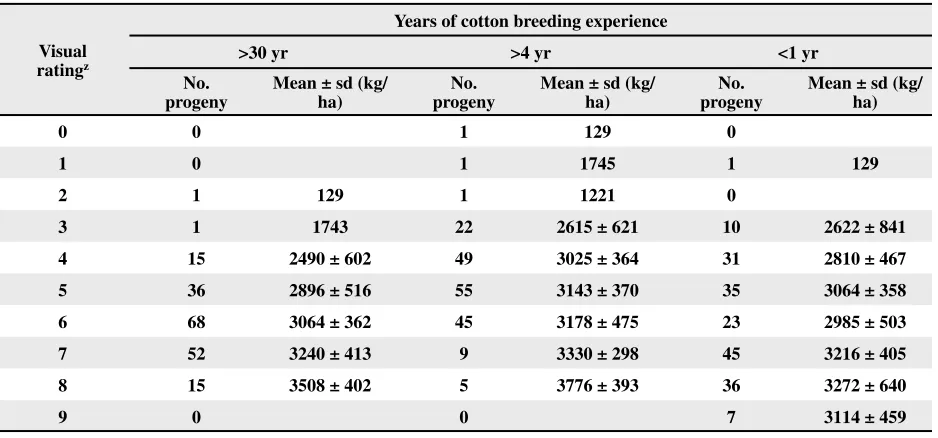
Table 1. Comparison of visual quality ratings by three breeders and seedcotton yield of 188 progeny at Keiser, AR in 2002
Visual ratingz
Years of cotton breeding experience
>30 yr >4 yr <1 yr
No.
progeny Mean ± sd (kg/ha) progenyNo. Mean ± sd (kg/ha) progenyNo. Mean ± sd (kg/ha)
0 0 1 129 0
1 0 1 1745 1 129
2 1 129 1 1221 0
3 1 1743 22 2615 ± 621 10 2622 ± 841
4 15 2490 ± 602 49 3025 ± 364 31 2810 ± 467
5 36 2896 ± 516 55 3143 ± 370 35 3064 ± 358
6 68 3064 ± 362 45 3178 ± 475 23 2985 ± 503
7 52 3240 ± 413 9 3330 ± 298 45 3216 ± 405
8 15 3508 ± 402 5 3776 ± 393 36 3272 ± 640
9 0 0 7 3114 ± 459
z Visual rating of yield potential on a scale of 0 to 9, where 0 = poor yielding to 9 = excellent yielding.
ratings and actual yields, and higher correlations were associated with greater experience (>30 yr, r = 0.51; >4 yr, r = 0.48; and <1 yr, r = 0.36).
Table 1 shows the distribution of ratings and the mean seedcotton yield for each rating. With four exceptions, mean seedcotton yield increased with higher visual ratings by the breeders. The breeder with more than 30 years of experience had the best progression of increasing yield with higher ratings. The breeder with 4 years of experience tended to rate the plots lower than the other two breeders.
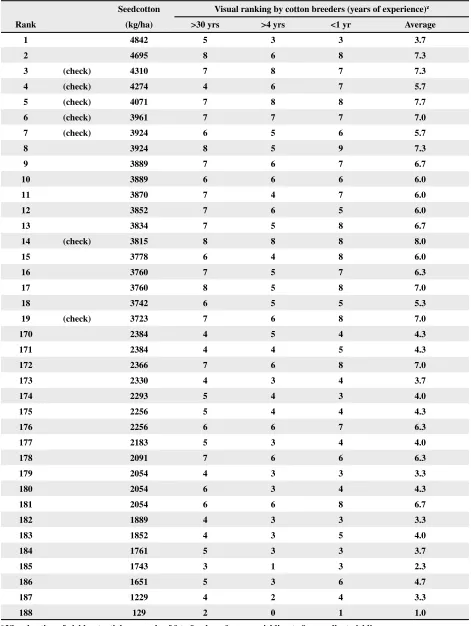
More interesting was their ability to choose the best and the worst lines. Table 2 shows the seedcotton yields of the top and bottom 10% of the lines and the ratings they received. If a rating criteria of 6.0 to retain was applied, four (including the highest) of the top 10% would have been rejected. Two of these were the checks. Four of the bottom 10% would have been retained and all four were near each other in the field. This points to a potential difficulty in identifying superior lines that may appear different from what is considered to be “normal”. The breeder with more than 30 years of experience would have rejected only one of the top 10% (the second was a check), whereas the breeders with greater than 4 years of experience and with less than one year of experience would have rejected eight and three, respectively. Relying on visual selection to evaluate phenotypes that appear different from current high-yield phenotypes may result in the loss of potentially good material. Of course, many breeders do not discard enough lines
due to the danger of throwing away excellent mate-rial. Yield trials are expensive and any technique to expedite the process of eliminating less-than-desir-able genotypes may be warranted.
The Louisiana study conducted by two breeders with many years of experience demonstrated the effect of leaves on the plant in obscuring the abil-ity to visually rate for yield (Table 3). Correlations were all nonsignificant. There was little difference between the two breeders in their ability to determine seedcotton yields. There was a trend, although not statistically significant, for correlations to be higher and positive for the higher yielding location (St. Joseph). There was little difference in the range of yields at the three locations.
In Mississippi, the correlation between seedcot-ton yields and visual rating was 0.49 (significant at
Table 2. Actual rank of the top and bottom 10%-yielding cotton progeny in 2002 compared with the visual ratings given by three breeders with different levels of experience
Seedcotton Visual ranking by cotton breeders (years of experience)z
Rank (kg/ha) >30 yrs >4 yrs <1 yr Average
1 4842 5 3 3 3.7
2 4695 8 6 8 7.3
3 (check) 4310 7 8 7 7.3
4 (check) 4274 4 6 7 5.7
5 (check) 4071 7 8 8 7.7
6 (check) 3961 7 7 7 7.0
7 (check) 3924 6 5 6 5.7
8 3924 8 5 9 7.3
9 3889 7 6 7 6.7
10 3889 6 6 6 6.0
11 3870 7 4 7 6.0
12 3852 7 6 5 6.0
13 3834 7 5 8 6.7
14 (check) 3815 8 8 8 8.0
15 3778 6 4 8 6.0
16 3760 7 5 7 6.3
17 3760 8 5 8 7.0
18 3742 6 5 5 5.3
19 (check) 3723 7 6 8 7.0
170 2384 4 5 4 4.3
171 2384 4 4 5 4.3
172 2366 7 6 8 7.0
173 2330 4 3 4 3.7
174 2293 5 4 3 4.0
175 2256 5 4 4 4.3
176 2256 6 6 7 6.3
177 2183 5 3 4 4.0
178 2091 7 6 6 6.3
179 2054 4 3 3 3.3
180 2054 6 3 4 4.3
181 2054 6 6 8 6.7
182 1889 4 3 3 3.3
183 1852 4 3 5 4.0
184 1761 5 3 3 3.7
185 1743 3 1 3 2.3
186 1651 5 3 6 4.7
187 1229 4 2 4 3.3
188 129 2 0 1 1.0
Since the entries were replicated four times in this study, entries that were rated 5 in one replicate were examined in the remaining three replicates. Soil variability between and within replicates may have been a factor. There is often soil variability in most breeders’ nurseries because the better fields are used for yield and quality trials. Seven of the nine entries rated 5 in one or more replicates had ratings 3 or below in at least one replicate. Only three had ratings of 3 or below in two replicates. This would suggest that high-yielding check plots should be planted (spaced) at intervals to assist in making valid comparisons for selection.
In North Carolina, correlations between visual ratings and actual yields averaged 0.38 in 2001 and 0.51 in 2002 (Table 4). Only three correlations were not significant in 2001 and one in 2002. In 2002, correlations improved throughout the day with low-est correlations occurring in the morning. One corn breeder (Don Thompson, personal communication, 2003) takes visual disease ratings three times on his plots, not trusting his initial numbers.
Several of the trials in North Carolina were identical, i.e. had the same entries and replicates, but were planted at different locations. There was inconsistency between those trials. In 2001, trial 1 (0.55) was the same as trial 6 (0.32), trials 2 and 7 were the same (0.11 vs. 0.70), trials 3 and 8 were the same (0.40 vs. 0.56), trials 4 and 10 were the same (0.08 vs. 0.40), and trials 5 and 11 were the same (0.56 vs. 0.06). In 2002, trials 4 and 15 (0.84 vs. 0.29), trials 5 and 10 (0.50 vs. 0.39), trials 6 and 11 (0.40 vs. 0.60), trials 7 and 12 (0.55 vs. 0.61), trials 8 and 13 (0.38 vs. 0.66), and trials 9 and 14 (0.51 vs. 0.47) were the same. The correlation between the visual ratings and mean yield was -0.34. It was thought that it may be easier to visually rate for yield at higher yield levels, but the negative correlation indicated otherwise.
One would also think that trials with a larger range of yields would have larger correlation coef-ficients with their visual ratings, i.e. easier to tell the
difference, but that wasn’t always the case. Trials 4 and 10 were the same with trial 4 having the largest range of yields (1343 vs. 901), but the lowest cor-relation coefficient (0.08 vs. 0.40).
Soil types were examined but no definite conclu-sion can be drawn because only two soil types were used in the North Carolina study. Plant height was also examined, but the correlation between visual rat-ing and plant height was not significant (r = -0.20). In 2002, ratings (0 to 10) and their mean yields for NC were 1 = 879, 2 = 1279, 3 = 1698, 4 = 2519, 5 = 3060, and 6 = 3341 kg/ha. No plots were rated 7 or better. There was a positive trend for higher yields with higher visual ratings.
In this study, seven breeders rated plots in four states. There were differences among breeders in their ability to discern high-yielding plots, but in the Arkansas and Louisiana studies these differences did not appear to be large.
Overall, the data supports the idea that some se-lection for yield can be made on a progeny row basis. The Louisiana study demonstrated the difficulty in rating plots for yield when the leaves have not been removed and suggested that visual rating should not be attempted before defoliation. It is recognized that some good-yielding lines will be discarded due to imprecision of the visual rating system and soil vari-ability. As the number of progeny rows to evaluate is increased, a breeder might be more willing to accept the loss of a few good lines in exchange for time/cost savings. The placement of high-yielding check culti-vars at appropriate intervals is highly recommended. Gardner’s grid system (Verhalen et al., 1975) would infer that selections be made in small blocks, thus the check cultivar should enhance the ability to select the best within small grids or blocks.
The eye needs to be trained in estimating po-tential yield. Conducting a second rating at least on the first hundred progeny rows may be necessary to improve correlations. Size of bolls and number of bolls must be mentally factored into the breeder’s judgment when making ratings.
Table 3. Correlations between visual yield ratings by two breeders and actual seedcotton yield in Louisiana in 2001
Yield Correlation (r)
Location Mean yield (kg/ha) range (kg/ha) Breeder A Breeder B
Bossier City 867 519 -0.22 -0.09
St. Joseph 1210 620 0.14 0.06
Another factor to consider is the orientation of the rows. Rows east-west may be difficult to rate depending on whether you were facing the sun or not. In such cases, a second rating at the other end of the plots may be in order.
REFERENCES
Allard, R.W. 1966. Principles of plant breeding. John Wiley and Sons, New York.
Briggs, J.G., and L.H. Shebeski. 1970. Visual selection of yielding ability of F3 lines in a hard red spring wheat
breeding program. Crop Sci. 10:400-402
Byth, D.E., C.R. Weber, and B.E. Caldwell. 1969. Correlated truncation selection for yield in soybean. Crop Sci. 9:699-702.
Dao, P.T., and H.H. Ram. 1992. Visual selection for seed yield in standard plots in soybean. Soybean Genet. Newsl. 1992:57-60.
Table 4. Correlations between visual yield ratings and actual seedcotton yield, range of yield, mean yield, soil type, and plant height in North Carolina
Test rz Yield range
(kg/ha) Mean yield (kg/ha) Soil type plant height (cm)Mean 2001
1 0.55* 1479 3703 Norfolk loamy sand 91
2 0.11 1071 4007 Norfolk loamy sand 91
3 0.40** 1122 4088 Norfolk loamy sand 91
4 0.08 1343 3266 Goldsboro fine sandy loam 86
5 0.56** 1734 2989 Goldsboro fine sandy loam 86
6 0.32* 1598 3484 Goldsboro fine sandy loam 86
7 0.70** 1785 3418 Goldsboro fine sandy loam 86
8 0.56** 1785 3512 Goldsboro fine sandy loam 86
9 0.50** 1122 2951 Goldsboro fine sandy loam 91
10 0.40** 901 3761 Goldsboro fine sandy loam 99
11 0.06 901 3647 Goldsboro fine sandy loam 99
2002
1 0.51** 1564 1733 Goldsboro fine sandy loam 81
2 0.44** 1666 1599 Goldsboro fine sandy loam 81
3 0.51** 1989 1990 Goldsboro fine sandy loam 81
4 0.84** 1530 2132 Goldsboro fine sandy loam 94
5 0.50** 1649 2256 Goldsboro fine sandy loam 94
6 0.40** 1632 2608 Goldsboro fine sandy loam 94
7 0.55** 1972 2666 Goldsboro fine sandy loam 94
8 0.38** 1734 2951 Goldsboro fine sandy loam 94
9 0.51** 1377 2885 Goldsboro fine sandy loam 94
10 0.39** 901 1286 Goldsboro fine sandy loam 76
11 0.60** 1003 1304 Goldsboro fine sandy loam 76
12 0.61** 935 1210 Goldsboro fine sandy loam 76
13 0.66** 986 1028 Goldsboro fine sandy loam 76
14 0.47** 1139 999 Goldsboro fine sandy loam 76
15 0.29 748 83 8 Goldsboro fine sandy loam 76
Frey, K.J. 1962. Effectiveness of visual selection in oat crosses. Crop Sci. 2:102-105.
Gardner, C.O. 1961. An evaluation of effects of mass selec-tion and seed irradiaselec-tion with thermal neutrons on yield of corn. Crop Sci. 1:241-245.
Hanson, W.D., R.C. Leffel, and H.W. Johnson. 1962. Visual discrimination for yield among soybean phenotypes. Crop Sci. 2:93-96.
Helms, T.C., J.H. Orf, and R.A. Scott. 1995. Actual yield advance from selection for visual score and yield. Can. J. Plant Sci. 75:187-189.
Kohel, R.J., and T.G. White. 1963. An analysis of the variabil-ity of five parents and their F1 progenies in Gossypium
hirsutum L. Crop Sci. 3:359-361.
Kwon, S.H., and J.H. Torrie. 1964. Visual discrimination for yield in two soybean populations. Crop Sci. 4:287-290. Meredith, W.R., Jr., and R.R. Bridge. 1973. The relationship
between F2 and selected F3 progenies in cotton
(Gossy-pium hirsutum L.). Crop Sci. 13:354-356.
Moore, J.H. 1956. Cotton breeding in the Old South. Agric. Hist. 30:95-104.
Niles, G.A., and C.V. Feaster. 1984. Breeding p. 201-231. In R.J. Kohel and C.F. Lewis (ed.) Cotton. Agron. Mon. 24. ASA, Madison, WI.
Richmond, T.R. 1951. Procedures and methods of cotton breeding with special reference to American cultivated species. Adv. Genet. 4:213-245.
Salmon, D.F., and E.N. Carter. 1978. Visual selection as a method for improving yield of triticale. Crop Sci. 18:427-430.
Stuthman, D.D., and R.P. Steidl. 1976. Observed gain from vi-sual selection for yield in diverse oat populations. Crop. Sci. 16:262-264.
Thomson, N.J. 1973a. Intra-varietal variability and response to single plant selection in Gossypium hirsutum L. I. Phenotypic variability. J. Agri. Sci. (Cambridge). 80:135-145.
Thomson, N.J. 1973b. Intra-varietal variability and response to single plant selection in Gossypium hirsutum L. III. Response to selection. J. Agric. Sci. (Cambridge) 80:161-170.