Desert 21-1 (2016) – 24-34
Flood hazard zoning using HEC-RAS in GIS environment
and impact of manning roughness coefficient changes on flood
zones in Semi-arid climate
M. Golshan
a, A. Jahanshahi
a, A. Afzali
b*a
Department of watershed Management, Faculty of Natural Resources, Natural Resources and Agricultural Science University,Sari, Iran
b Desert Management Dept., International Desert Research Center (IDRC), University of Tehran, Tehran, Iran
Received: 30 August 2015; Received in revised form: 30 November 2015; Accepted: 22 February 2016
Abstract
Development of rural areas in rivers margins and flood plains, without understanding and attention to the dynamical and hydrological conditions and upstream areas of the rivers will cause to increase flood risk and loss of life and financial. Flood zoning has many applications, in floodplain management. For management of the three major branches of the Halilrood River, Rabor, Roodar and Javaran in Safarood watershed in Kerman Province, flood hazard zonation was considered in this research. For this purpose, Flood levels in 2 to 200 return periods in three mentioned reaches (72.13 km) using HEC-RAS and HEC-GeoRAS extension were determined in GIS environment. Initially, Rivers Plan was divided to 163 cross sections and in 75 of them, hydrological data were collected and roughness coefficient was determined by Manning method. Results showed that 90.26 percent of the total area affected by the 200-year flood, Susceptible to flooding by the flood under 25 years as well as study on flood depth in the floodplain showed that 68.26 percent of the average depth of floods with 200 years return period is belonged to
floods with under 25 year return period.Survey on roughness coefficient in the return period of 200 years, revealed
that with a doubling of the roughness coefficient, area under flood 7.15 percent increase which proves direct relationship between the return period and flood area. The result confirms accuracy of combination geographic information system and HEC-RAS software in flood zoning and river modeling.
Keywords: Zoning; Flood; Manning coefficient; Halilrood
1. Introduction
In international culture, flood is defined as a water flow with high discharge, which water rises and drowning out its land around that are not usually under water (Ghodsian, 1998). Flood plains are often fertile lands, which are under flood risk (Ahmadi, 2007). In recent years the development of the cities that are on the rivers margins, the growing population, lack of attention to the environment capacity and inappropriate use of resources has led to damage to the mentioned communities that indicates the necessity of applying flood plains management
Corresponding author. Tel.: +98 912 3317789,
Fax: +98 21 88971717.
E-mail address: [email protected]
use of geographic information systems (GIS) and its combination with the hydraulic and hydrological models (Rezaei Moghaddam and Esmaili, 2005). Results of flood plain zone are compared with the two hydraulic models, MIKE11 and HEC-RAS. Initially The Analysis of hydraulic flood is performed with entry data geometric cross sections, boundary conditions and initial data after calibration then the results of the model that consists of flood zones as layers of data transfer to ARCVIEW software and overlay with topographic maps 1/2500 national mapping agency. Finally, results are shown in flood zone maps for the HEC-RAS and MIKE11 models. When we compared the results of the two models, we found little difference between the models (Montazami et al., 2014). In these models,Manning roughness coefficient can be noted among several factors which are effective on velocity, depth and water stress during the floods. Several studies have been conducted on flood hazard zonation and flood areas in Iran and the world. Rezaei Moghaddam and Ismaili (Mousavi Baygi et al.,
2012) studied the geomorphologic effects of floods in Raeskola Watershed, after preparing some cross sections using HEC-RAS software, shear stress, river power and other needed parameters were determined and it was clear that the size of floods could be more accurately predicted for small steep mountain rivers by ancient water table and stream power indices. Ismaili et al (Esmaili and Hasouni Zadeh, 2009) studied the hydraulic behavior of Konchancham River in Ilam Province against possible floods damage in order to reduce the damage. They used HEC-RAS software and HEC-GeoRAS extension to display the study area and extract the needed data. The results showed that the combination of hydraulic models is not only feasible but also facilitates the hydraulic modeling. Examined the flood zoning in Gorganroud watershed by the combination of HEC-HMS and HEC-RAS models. By determining the area of flood zones in GIS environment, they concluded that the Dogh River watershed had greatest amount of flooding. Finally, the number of damaged villages and towns and the amount of flooding in rural, urban and agricultural lands were predicted (Shaebanlou et al., 2009). Study in part of Zamostea village (Romania) was used as a pilot drainage basin for the flash-flood simulation using the Hec-Ras program and the ArcGIS extension, HecGeo-Ras. The programs are capable to simulate the water flow and to investigate the floodway encroachments in the study area. The damages evaluated in the field
River. They found that for return periods of 5-100 years with the roughness coefficient of 0-100%, by increasing in roughness coefficient the level and depth of water would significantly increase. One-dimensional model HEC-RAS was used to simulate the flood zoning in the Kota Tinggi district in Johor state. Implementation processes of the zoning on catchment for return periods of 2, 25, 50 and 100 years were applied with different roughness coefficients. In order to improve the results of flood zoning from the obtained results, it is better to include the items for changing hydraulic platform as a different scenario's problem. The sensitivity of HEC-RAS model to the roughness coefficient, the coefficient of narrowing and opening, and energy slope were examined and observed. The most sensitive on water surface profile is created by the changes in the roughness coefficient. The volume and upstream surface runoff area and stream or flood conditions and physical characteristics of the area (surface morphology, etc.) can be named as the most significant factors that can affect the severity and recurrence of floods in every region (Mousavi Baygiet al. 2012). In a study in a range of 6.5 km from the bed floor river of Taleghan, determined the flood zones with return periods of 25-200 in HEC-RAS software. The results showed that 88.16% of the 200-year total area was susceptible to flooding by floods with a return period of 25 years and less than that. After reviewing all of zones it was obtained that the high altitude of the area had a direct impact on the zones area (Yamani et al., 2010). Compared the vegetation impact on regimes and physical behavior of flow by comparing regimes of forest and outside Forest Rivers using HEC-RAS model and concluded that the HEC-RAS model could provide appropriate numerical values for studying this regime and other hydraulic characteristics of river’s flow (Andam, 2003). Used the combination of HEC-HMS and HEC-RAS hydraulic models in order to provide a regional flood model for San Antonio watershed, Texas, America and compared the obtained model with flood model of summer 2002. The results demonstrated the effectiveness of the model in flood forecasting in regional scale (knebl et al., 2005). Provided the map of flood hazard zoning for small watersheds near Baya Sea in Astoro valley. To this end, a combination of two Wetspa and HEC-RAS programs was used in ArcViw software. The results showed a high
accuracy of these models in estimating the water surfacein these zones. Considering that the first step in flood management plans is preparation of flood hazard zoning maps; as well as the results of studies conducted by researchers in Iran and other countries show that the combination of HEC-RAS hydraulic model and GIS has an acceptable accuracy for determining flood zones, which is used in the present study (Napradean and Chira, 2006).
Given that the river floodplains of the facilities and different user is located, to manage these areas in case of flooding and keep them, so when it comes zoning is flooding with different return periods.
This research aims the following goals: 1. Determining the flood zones with the return periods of 2, 5, 10, 25, 50, 100 and 200 years; 2. Evaluating the changes in roughness coefficient on flood zones area for the
mentioned return periods;
3. Suggesting appropriate solutions to reduce flood damage in the area.
2. Materials and Methods
2.1. The study area
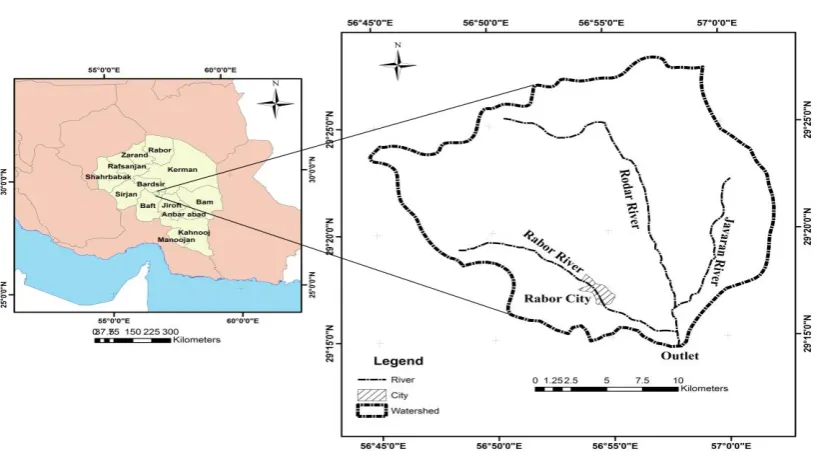
The Safarood Watershed with an area of 366.21 km2 is the main watershed upstream the Safa
Earth dam under construction, which is located in 170 km south west of Kerman and between geographical location of 56° to 57° E longitude and 29° 15´ to 29° 28´ N latitude. The northern part of the study area is mountainous and steep and the slope is reduced to the south. The maximum and minimum heights of the watershed are 4267 m in north west and 2086 m in south at the outlet. The average slope is 20.51%, this watershed is consist of two sub- watersheds and three main rivers including Rabor, Roodar and Javaran with a length of 29.1, 28.5 and 14.53 km,respectively. The main source of rainfall is mountainous and the main precipitation is occurred in the second half of the year Rezaei Moghaddam, M. H., R. Esmaili. 2005. The height of annual rainfall was 258.5 and 261 mm for Hanjan and Cheshmeh Aroes stations, respectively in 2009-2010, Yekom Consulting Eng. 2011. The regional climate is semi-arid with Domartan. About 78.87% (288.8 km2) of the total area is pasture land use type.
Fig. 1. The location of Seafood Watershed in Kerman Province
2.2. Method
After preparing 42-year discharge data (from 1968 to 2010), to avoid prolonging the number of reconstruction years of incomplete stations, the statistical year of 37 (1973 to 2010) was selected for both stations of Henjan and Meidan. Then the data had been controlled, corrected and revised. Next, the discharge was calculated by distribution of log Pearson Type III for eight return periods (2 to 200 years). Then, by closing the border areas in ArcGIS 10 and using HEC-GeoRAS extension, the layers of the central line (Rabor, Roodar and Javaran rivers), banks, boundaries determining the maximum flood zone, flow path, cross sections with TIN maps (Figure 1) were determined, and were entered into HEC-RAS software after combining together. At this stage, the hydraulic characteristics of river flow such as energy loss coefficients, river discharge with different return periods and roughness coefficients were entered into hydraulic model of HEC-RAS, and output results were returned to GIS by a file after running this model. At the end, the zoning was made in GIS environment using HEC-GeoRAS extension and the maps were produced, which the results are given below.
2.3. Determining Manning roughness
coefficient
In hydraulics of rivers, many factors affect the velocity, depth and water stress during the flood, which Manning roughness coefficient can be pointed out Ahmadi, H, 2007. To model shear stress, the slope and velocity of the water we have to rely on empirical relationships. One of the empirical relationships to calculate the velocity of water and predict the hydraulic behavior of rivers is Manning's relationship.
2 1 3 2
1
V
R S
n
(1)Where, n is Manning roughness coefficient; V is the flow velocity; R is hydraulic radius and S is the slope of the canal, Hekmati Far, H., et al. 2009.
3. Results and Discussion
After correction and preparation of the maximum instant annual rates of discharges at the considered station, to determine the discharge rate with different return periods, the distribution of Log Pearson Type III was chosen as the most appropriate distribution and the discharge rate with eight return periods was determined (Table 1).
Table 1. The peak discharge rate (cubic meters per second) with different return periods at studied stations 200 years 100 years
50 years 25 years
10 years 5 years
2 years Return period
713 610
504 397
259 162
53 Henjan
444 376
313 254
183 133
3.1. Determining the roughness coefficient
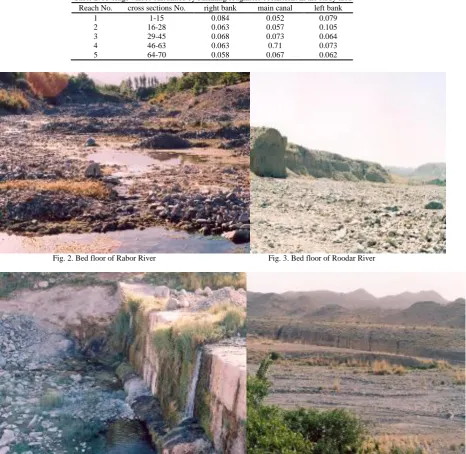
The roughness coefficient of bed floor and margins of the different studied reaches were determined using the geometric characteristics of the river, bed floor vegetation, and margins and size of the bed floor in Safarood watershed.
N coefficients for the main canal and the left and right banks of Rabor, Roodar and Javaran rivers were estimated for five reaches and 75 cross sections, which the results are presented in Table 2. Views of sediments carried by the flow in rivers’ bed are shownin figures (2) to (5).
Table 2. Average values calculated by Manning roughness coefficient in the study area Reach No. cross sections No. right bank main canal left bank
1 1-15 0.084 0.052 0.079
2 16-28 0.063 0.057 0.105
3 29-45 0.068 0.073 0.064
4 46-63 0.063 0.71 0.073
5 64-70 0.058 0.067 0.062
Fig. 3. Bed floor of RoodarRiver Fig. 2. Bed floor of Rabor River
Fig. 4. Alluvial vertical wall of the left bank of the river in downstream of Marjan village
Fig. 5. Rabor Diversion Dam, upstream Diversion Dam was filled with coarse sediments
3.2. River simulation
In flood zoning studies, usually the determining of rivers’ margins1 and bed floor is considered
with a 25-year return period (4), hence the flood
1 Buffer
zone values for this period was examined with other seven periods.
3.3. Level, depth and velocity of flow
the drawn profile of water surface in HEC-RAS software at junctures was properly simulated. For example, a view of cross section of bed
floor and water surface height for two return periods of 2 and 200 ye ars at two selected section is shown in figures (6) and (7).
0 100 200 300 400 500 600 700 2460
2470 2480 2490 2500 2510 2520 2530
Station (m)
E
le
va
ti
o
n
(
m
)
Legend
WS 200 yr
WS 100 yr
WS 2 yr
Ground
Bank Sta
.105 .057 .063
Fig. 6. Cross section and water surface height for Rabor River at a critical section
0 100 200 300 400 500 600 700 2424
2426 2428 2430 2432 2434 2436 2438 2440
Station (m)
E
le
va
ti
o
n
(
m
)
Legend
WS 200 yr
WS 100 yr
WS 2 yr
Ground
Bank Sta
.079 .052 .084
Fig. 7. Cross section and water surface height for Javaran River at a critical section
The results of the water surface calculation at different return periods in HEC-RAS software was transferred to GIS through HEC-GeoRAS extension and flood zones were determined for each period. It is obvious that by larger flood discharge, more areas go under water, but
Fig. 9. Flood zones of Roodar River for return periods of 2 and 200 years
Fig. 10. Flood zones of Rabor River for return periods of 2 and 200 years
By determining the flood zones for each returnperiod, the calculation of flood zone area would be possible. The land area affected by the flood at each returnperiod is presented in table
(3). The other results achieved by this zoning method are information layers of depth and velocity for each cell of an area, which the values are presented in Table 3.
Table 3. Area, mean depth and average velocity of flood at different return periods
200 years 100 years
50 years 25 years
10 years 5 years
2 years return period
608.3 599.6
574.3 549.1
532.2 517.1
498.3 Area (ha)
4.04 3.93
3.72 3.46
3.13 3.02
2.11 average velocity (m/s)
1.67 1.5
1.3 1.14
0.89 0.86
0.48 mean depth (m)
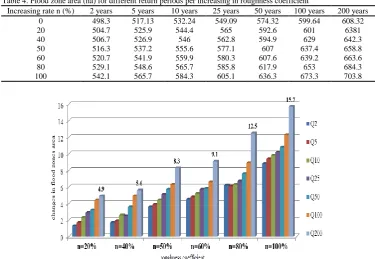
3.4. Changes in roughness coefficient
The changes in flood zones area per changes in roughness coefficient values as well as the diagram of flood zone changes based on the increase in roughness coefficient are presented in Table (4) and Figure (11), respectively. Manning roughness coefficient change has a great impact on the results of expecting rivers hydraulic conditions and velocity, height and expanse of water during the flood. The results indicated that the flood depth would increase by
increasing in this coefficient, which are more obvious for upper return periods.
Table 4. Flood zone area (ha) for different return periods per increasing in roughness coefficient 200 years 100 years 50 years 25 years 10 years 5 years 2 years Increasing rate n (%)
608.32 599.64 574.32 549.09 532.24 517.13 498.3 0 6381 601 592.6 565 544.4 525.9 504.7 20 642.3 629 594.9 562.8 546 526.9 506.7 40 658.8 637.4 607 577.1 555.6 537.2 516.3 50 663.6 639.2 607.6 580.3 559.9 541.9 520.7 60 684.3 653 617.9 585.8 565.7 548.6 529.1 80 703.8 673.3 636.3 605.1 584.3 565.7 542.1 100
Fig. 11. Diagram of flood zone changes based on the increase in Manning roughness coefficient in different return periods
According to the tables of surface and depth of flooding, it can be seen that for return periods more than 25 years, the increasing in flood area had a slower trend. The focus of most investments including rural buildings, agricultural land and orchards are in floodplain under the 25 years, which is a legal part of the river. This issue represents a non-normative use of land in this area, so that farmers have been invaded near the typical riverbed because of the extent and fertility of the flood plain. This would increase the damage from flooding. By identifying the areas susceptible to flooding, the use of management practices to control land use through legal mechanisms would be facilitated, as knebl et al., 2005; Rodriguez et al., 2008; Timbadiya, P. V; et al, 2011; also emphasized on the positive role of these researches in providing management practices to reduce flood damage. The results of this study about inappropriate land use associated with increased flood level and depth are consistent with Andam, 2003; Napradean, Chira, 2006 and Ghaffari, et al; 2004, Haliuc and Frantiuc, 2013; Masood and. Takeuchi, 2011. The results of this study about the relationship between increasing in roughness coefficient with expanding of
flood zone, particularly for longer return periods are in accordance with Mousavi et al 2012. Additionally, the obtained results of increasing in accuracy and velocity of search by using hydraulic model of HEC-RAS (in combination with GIS) are consistent with Esmaili, and Hasouni Zadeh, 2009; Ghaffari, and Amini. 2010; Yamani et al., 2010; Yerramilli, S, 2012.
4. Conclusion
With respect to the floodplain zoning map, it was identified that the increasing trend of flood zone had a more rising trend for return periods of 2 to 25 years than 25 to 200 years. In general, from the area affected by the 200 year flood, 90.26% was susceptible to floods under 25 years and the major loss would be in floodplain zones under 25 years. The values of the flood zone area are presented in Table (5). Additionally, according to the flood depth map of the floodplain, the depth increasing trend for return periods of 2 to 200 years was relatively evenly, so that from the total flood depth for return period of 200 years, 68.26% was belonged to return periods under 25 years. Table 6 shows the average values of the flood depth.
Table 5. Percent of the flood zone area for different return periods to the 200-year flood
200 100 50 25 10 5 2 return period (year)
1.43 4.16 4.15 2.77 2.48 3.1 81.91 percent of area
100 98.57 94.41 90.26 87.49 85.01 81.91 cumulative Percent of area
200 100 50 25 10 5 2 return period (year)
10.18 11.98 9.58 14.97 1.8 22.75 28.74 Percent of average depth
100 89.82 77.84 68.26 53.29 51.49 2874 Cumulative Percent of average depth
The results obtained from the flood velocity table also showed that 52.22% and 22.53% of the total average velocity of 200-year flood was related to the return period of 2 years and 5 years, respectively. After the return period of 5 years, the percent of flood velocity for each return period to return period of 200 years as
well as flooding area was greatly reduced, which was more obvious after the return period of 25 years. The main reasons could be the removal of sand from the mentioned zones around rivers and mountains region. The average flood velocity is shown in Table 7.
Table 7. Percent of average velocity to the average velocity of 200 -year flood
200 100 50 25 10 5 2
return period (year)
2.73 5.2 6.43 8.17 2.72 22.53 52.22 Percent of velocity
100 97.27 92.07 85.64 77.47 74.75 52.22
cumulative Percent of velocity
As it is shown in Table (3) and figures (8) to (10), for longer return period the discharge amount would be more and flood zone area would be wider. However, the difference in spreading flood zone area is primarily due to topographical features of the valley. Where ever the slope around the river is low, then the flood zone area increases and the water spread in wider area. Conversely, where the valley narrows, the width of the flood zone also reduced as well as the flood depth increased. Accordingly, with respect to the three rivers in the mountainous areas, and slopes across the river especially in the northern and
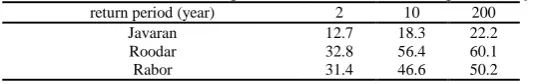
north-western areas with greater slope, the land area at risk of flooding in different return periods had no significant difference, however in floodplains (in the middle part of the watershed) due to gradual changes in slope across rivers with little change in elevation of the flood level, significant changes in the land area at risk of flooding is evident. The results of this study is consistent with Yamani et al (17). By examining the flood zone maps for return periods of 10 and 200 years, the area of horticultural and agricultural lands at risk of flooding is 121.3 and 132.6 ha, respectively (Table 8).
Table 8. Area of horticultural and agricultural lands at risk of flooding in the study area (ha) 200
10 2
return period (year)
22.2 18.3 12.7 Javaran 60.1 56.4 32.8 Roodar 50.2 46.6 31.4 Rabor
Considering the capabilities of GIS in providing and integration of data layers and conducting required changes, it is recommended to define basic information of the country’s watersheds based on a single standard in this system. On the other hand, preparing flood hazard zonation maps, identifying rivers’ margin and development of management standards required in all flood plains is essential. It is suggested that the development of residential areas in the vicinity of the mentioned rivers should be done with respect to margin and the proper distance. In addition, unethical harvesting of river materials for the construction of earth dams of Safarood downstream of this watershed should be organized and implemented in appropriate places.
Acknowledgments
The researchers would like to thank Kerman Regional Water Authority to cooperate in providing required data.
References
Ahmadi, H, 2007. Applied Geomorphology (Water Erosion), 1th ed., University of Tehran Press, Tehran. Alizadeh, A, 2012. Principles of applied Hydrology, 35th ed. University Of Ferdowsi press. Mashhad. Andam, K, 2003. Comparing Physical Habitat Conditions in Forested and Non-Forested Streams. MSc thesis in Civil and Environmental Engineering, college of Engineering and Mathematical Science. University of Vermont, Burlington, USA. 136 pp. Emami, K., M. Barkhordar, A. Behnia, S. A. Chavoshian, A. Heidari, A. A. Montazer Kalateh and M. H. Sadat. 2001. Manual on Non- Structural Approaches to Flood management, No 40. Iranian National Committee on Irrigation abd Drainage (IRNCID). 324 pp
study: River Kanchancham (Gavi) Ilam province). 2th
Conference of hydroelectric power plants, Iran water and power resources development Co. 43-53. Ghaffari, G., K. Soleimani and A. Mosaedi. 2004. Flood Hazard and Damage Assessment using HEC- GeoRAS (Case study: Babolrood River). Journal of Iranian Natural Resources, 60(2): 439-451.
Ghaffari, G., A. Amini. 2010. The management of floodplains using geographic information system (GIS) (Case study: Qezel Ozan River). Journal of geographical space. 10(32): 117-134.
Ghodsian, M. 1998. Flood control and drainage engineering. Tarbiat Modares University press. 404 pp.
Haliuc, A., A. Frantiuc, 2013. A study case of Baranca drainage basin flash-floods using the hydrological model of Hec-Ras. Georeview, 21, 118-133.
Hasani, H, 2013. Determination of Flood Plain Zoning in Zarigol River Using the Hydraulic Model of HEC- RAS., International Research Journal of Applied and Basic Sciences, 5(3); 399-403.
Hekmati Far, H., M. Nazariha and S. Givehchi. 2009. Assessment agricultural losses caused by flood using HEC-RAS and ArcView modeling. Journal of Environmental Science and Technology, 11(4): 95- 108.
Hoseini, S. M and J. Abrishami. 2002. Hydraulics of open channels, University of Ferdowsi press. Mashhad.
Joodaki, H, R. Mohammadi, M, 2015. Use of GIS for Flood Zoning In Urban Watershed Area Case Study: Iran, North of Tehran. Journal of Applied Environmental and Biological Sciences, 5(8); 158- 165.
Knebl, M. R., Z. L., yang, K. Hutchison and D. R. Maidment. 2005. Regional scale flood modeling using NEXRAD Rainfall, GIS, and HEC-HMS/RAS: a case study for the San Antonio River Basin Summer 2002 storm Event. J. Environ manage; 45; 325-336. Masood, M., K. Takeuchi, 2011. Assessment of flood hazard, vulnerability and risk of mid-eastern Dhaka using DEM and 1D hydrodynamic model. Nat Hazards, 61; 757-770.
Montazami, V, R. Nayyeri, M. Barani, 2014. G-A. Floodplain Modeling Using HEC-RAS and MIKE11 Models. Journal of River Engineering, 5 (2);
Mousavi Baygi, S. M., A. Faridhoseini, A. Alizadeh and M. Inanlou. 2012. The Assessment of Fluctuations on Roughness Manning Coefficient for Prediction of Flood Flow Hydraulic (Case study: Atrak River). Journal of Water and Soil. 26(1); 183-192.
Napradean, I., R. Chira. 2006. The hydrological modeling of the Usturoi Valley-using two modeling programs-Wetspa and HEC-RAS. Carpthian J. Earth and Environ Sci. 1(1): 53-62.
Qomi Oili, F., M. S. Sadeghi, A. H. Javid and Mir Bagheri, S. A. 2010. Zoning of flood simulation model using HEC-RAS (Case study: Karun river in between Ahvaz Band ghir). Quarterly of Science and Technologies in Natural Resources. 5(1); 105-113. Rezaei Moghaddam, M. H., R. Esmaili. 2005. Geomorphological effects of flooding in Rayis Kola basin: Northern Alborz. Journal of Modares Human Sciences. 4(9); 1-18.
Rezaee, M., A, Rezvani Mahmuee., S, Khaksefidi, 2014. Zoning of Flood Caused by Farrokhi Dam Breaking of Qaen South Khorasan, Iran. Journal of Civil Engineering and Urbanism. 4(5); 550-553.
Rodriguez, L, B., P, A, Cello, A, Vionnet. D, Goodrich, 2008. Fully conservative coupling of HEC-RAS with MODFLOW to simulate stream–aquifer interactions in a drainage basin. Journal of Hydrology, 353, 129- 142.
Shabanlou, S., H. Sedghi, B. Saghafian and H. Mousavi Jahromi. 2009. Flood zoning in Golestan river networks using GIS. Iranian Water Research Journal, 2(3); 11-22.
ShahiriParsa, A., M, Heydari., M, Sadeghian., S, Moharrampour, 2013. Flood Zoning Simulation byHEC-RAS Model (Case Study: Johor River-Kota Tinggi Region), Journal of River Engineering, volume1, Issue1.
Timbadiya, P V., P. Prem., P. Prakash, 2011. Calibration of HEC-RAS Model on Prediction of Flood for Lower Tapi River, India. Journal of Water Resource and Protection, 3, 805-811.
Yamani, M., M. Tourani and S. Chezgheh. 2010. Flood zone determination using HEC-RAS model (Case study: Taleghan dam upstream from Galinak to Vashte bridge). Journal of Geography and Natural Hazards. 1: 1-16. (In Persian).
Yekom Consulting Eng. 2011. Reports of Hydrology, Meteorology and damages of Jazmourian west basin with systemic and comprehensive approach. Kerman province Regional Water Company .86 p. (In Persian).