JIEM, 2011 – 4(1): 31-80 – Online ISSN: 2013-0953
Print ISSN: 2013-8423
Active learning in Operations Management: interactive
multimedia software for teaching JIT/Lean Production
Carmen Medina-López, Rafaela Alfalla-Luque, Francisco Arenas-Márquez
Universidad de Sevilla (SPAIN)
Received December 2010
Accepted March 2011
Abstract:
Purpose: Information & Communication Technologies (ICT) can be a
fundamental aid for the design of new teaching methods that better adapt to the
framework of the European Higher Education Area. In this context, this study
aims to develop and assess a complex and truly interactive ICT-based teaching tool
for instruction in OM.
Design/methodology/approach: A multimedia application for Just-in-Time
(JIT) / Lean Production has been conceived, designed and assessed. A
constructivist focus was followed in its conception and design to encourage active
and flexible learning adapted to each individual’s own requirements. Using
empirical research the tool has been assessed by students and compared to the
traditional teaching methods.
JIEM, 2011 – 4(1): 31-80 – Online ISSN: 2013-0953
Print ISSN: 2013-8423
Research limitations/implications: The study was carried out in a controlled
environment and not in the normal on-site university teaching process.
Conclusions could be extended to OM and other related subjects, especially if they
make use of similar tools to the one described in this paper.
Practical implications: This study provides a contribution that allows reflections
to be made on the design of specific software for OM and students’ perceptions
when using it.
Originality/value: Through this paper we contribute to an improvement in
learning methods in general and to higher education in OM in particular.
Keywords: teaching, operations management, multimedia educational software,
just-in-time, lean production
1 Introduction
JIEM, 2011 – 4(1): 31-80 – Online ISSN: 2013-0953
Print ISSN: 2013-8423
patent need to respond to a growing demand for lifelong learning and distance learning. Going hand-in-hand with this is the need to cater for new student profiles, with a wide range of motivations, ages, interests and spaces.
JIEM, 2011 – 4(1): 31-80 – Online ISSN: 2013-0953
Print ISSN: 2013-8423
universities, and in the workplace (Challenge 8 - ICT for Learning and Access to Cultural Resources). One of the aspects included is the promotion of projects linked to developing tools that enable creative, non-linear learning, and the use of ICT for continuous training and the creation of new learning models on the basis of these technologies.
The ICT are therefore a recognised lynchpin for aiding the design of new teaching methods that better adapt to the European Higher Education Area (EHEA) framework and that facilitate quality on-site and distance training. In the area that concerns us here, Operations Management (OM), the use of ICT is both highly applicable and also has a huge potential for motivating the student (Krajewski, 1998) and improving the teaching-learning process (Barron & Orwig, 1995). And OM is one of the business areas that best adapts to computer-assisted teaching (Coye & Stonebraker, 1994). Despite this, Business Administration (BA) Higher Education has responded slowly and timidly to these new requirements. In the second half of the nineteen-nineties, the Association to Advance Collegiate Schools of Business signalled the slowness with which business schools in the United States were adapting their teaching methodologies to rapid ICT development (AACSB, 1997). In later studies, Pfeffer and Fong (2002) and Richardson (2003) stated that the programmes for the subjects and the teaching methods used for teaching them had not changed substantially to adapt to new demands. Likewise, they are a very useful tool in engineering. Shannon (1994) concluded that in the engineering disciplines much is to be gained through the ability to animate when presenting explanations of how and why something works. Meanwhile Rothberg, Lamb and Wallace (2001) determined that engineering academics have a strong belief that computer aided learning helps engineering education.
JIEM, 2011 – 4(1): 31-80 – Online ISSN: 2013-0953
Print ISSN: 2013-8423
appeared in the nineteen-eighties (Gunasekaran & Love, 1999; New, 2003). It is for this reason that this paper focuses on the conception, design and assessment of an interactive multimedia application that makes use of the ICT to improve training in OM.
The paper is organised as follows. Section 2 reviews previous studies and sets out the research objectives. Section 3 describes the methodology employed. This is followed by the results of the study. Finally, the main conclusions are presented.
2 Literature review and research objectives
As pointed out above, OM does not seem to be a pioneering area in the generalised use of the most innovative teaching methods (Alfalla-Luque & Machuca, 2003; Alfalla-Luque, Arenas-Márquez & Medina-López, 2001; Arbaugh, Desai, Rau, & Sridhar, 2010; Carraway & Freeland, 1989; Goffin, 1998; Hammond, Hartman, & Brown, 1996; Raiszadeh & Ettkin, 1989). This is why the need to incorporate the use of the ICT into teaching the subject has been highlighted so often (Alfalla-Luque & Machuca, 2001; Alfalla-(Alfalla-Luque & Machuca, 2003; Arbaugh et al., 2010; Hayes, 2000; Krajewski, 1998).
JIEM, 2011 – 4(1): 31-80 – Online ISSN: 2013-0953
Print ISSN: 2013-8423
Satzler & Sheu, 2002; Yazici, 2004), manual games (e.g. Cox & Walter, 2005; Gattiker, 2003; Griffin, 1997; Polito, Kros, & Watson, 2004), virtual learning environments (e.g. Greasley, Bennett, & Greasley, 2004; Naslund, 2005; Walker, Gough, Bakker, Knight, & McBain, 2009), multimedia applications (e.g. Alfalla-Luque, Medina-López, & Arenas-Márquez, 2011; Balazinski & Przybylo, 2005; Ball & Thornbury, 2004); problem-based learning (e.g. Kanet & Barut, 2003; Mukherjee, 2002), case studies (e.g. Julien, Doutriaux, & Couillard, 1998; Morris, 1997) and immediate response systems (e.g. Yourstone, Kraye, & Albaum, 2008; Ruiz, Ceballos, García, & Chávez, 2010).
As can be seen, among the teaching-learning strategies analysed, the use of multimedia for educational ends in OM has received little attention in studies as, when the computer is put to use, the tendency is to experiment with games and simulations (New, 2003). It must be stressed that multimedia applications should not be limited to the mere transfer of the content of a classic book to a digital medium. Using this approach to deliver large volumes of text is inappropriate, as it will not stimulate the interest of the learner (Ball & Thornbury, 2004). Despite this, there are few experiences that go beyond digitising a text book and the ones that do exist tend to be somewhat underdeveloped. Balazinski and Przybylo (2005), for example, focus only on the development of multimedia animation (with and without interactivity).
JIEM, 2011 – 4(1): 31-80 – Online ISSN: 2013-0953
Print ISSN: 2013-8423
In other respects, the literature review reveals that the numerous teaching experiments that were analysed were not formally assessed from the student point-of-view. In other words, the experiment is described, simply, and, on occasion, commentaries that have been made informally by students are added as a complement (e.g. Ahire, 2001; Ammar & Wright, 2002; Balazinski & Przybylo, 2005; Griffin, 1997; Holweg & Bicheno, 2002; Yazici, 2006). The result is that calls have been made for empirical studies such as that presented here, that conduct a formal study of the proposed teaching methods.
It should be highlighted that several studies (Kadiyala & Crynes 2000; Smith & Ragan, 1992) find multimedia instruction both more effective and more efficient than conventional educational approaches. Van Dijk and Jochems (2002) state that changing a traditional teaching approach in lectures into an interactive lecturing experience is not only feasible but is also beneficial to the students. One of the questions to be evaluated in this study will therefore focus on a comparison of the teaching tool with the traditional teaching method.
Finally, Belton et al. (1997) conclude that a multimedia application, in conjunction with more traditional modes of teaching, has significant potential for improving the effectiveness of teaching and learning. In this same line, Ball and Thornbury (2004) show how learning can be enhanced with an appropriate combination of computer aided learning, lectures and tutorials. Given how important the implementation of these new teaching strategies is, it is interesting to have the student’s opinion in this regard, which is why this will be done in this research.
JIEM, 2011 – 4(1): 31-80 – Online ISSN: 2013-0953
Print ISSN: 2013-8423
mark on their academic records. The aim of this is to determine whether there are any differences on the basis of these variables.
The average overall mark on students’ academic records is a variable that might impact on their perceptions of the teaching method, although this has not been detected in other studies that have addressed this. With regard to gender differentiation, evidence exists that suggests that men and women conceptualise and use the medium differently (Arbaugh, 2000). Previous studies of differences in communication patterns between men and women have found that men tend to communicate on the basic of social hierarchy and competition, whereas women tend to be more network-oriented and collaborative (Tannen, 1995). Some studies have found that while gender differences toward computer usage may exist among school age children, they tend to disappear once people are old enough to enter the workplace (Kraut, Sherlis, Mukhopadhyay, Manning, & Kiesler, 1996; Whitely, 1997). In other studies, such as Arbaugh (2000), no significant differences are detected between men and women in learning or exam performance. There therefore does not seem to be a clear pattern with respect to this variable.
3 Methodology
The interactive multimedia application was developed in our research group (GIDEAO) following the three characteristic phases of educational software development processes: conception, development and assessment (Benyon, Stone & Woodroffe, 1997; Cabero, 2001; Chapman, 1995; Koper, 1998; Shabajee, 1999). During the whole process, consideration was given to pedagogical aspects, aspects of the subject matter to be studied, and technical aspects relating to computer science. The group’s prior experience of developing other ICT-based training tools, basically business simulators (González et al., 2000; Machuca & Barajas, 1997; Machuca, González, & Ruiz, 2003) was of great use in this respect.
JIEM, 2011 – 4(1): 31-80 – Online ISSN: 2013-0953
Print ISSN: 2013-8423
1999; Cabero, 2001; Rogers & Newton, 2001; Hosie, Schibeci, & Backhaus, 2005). These views are complementary and this allows a full assessment to be made by all the actors involved and by the people who have some contribution to make to the teaching-learning process. The assessments made on the production and expert levels are formative assessments consisting of a systematic improvement process during the application’s development. This has to be done considering both the technical and pedagogical features apart from the content. In other respects, assessment on the user level is framed within a summative type of assessment. This is done once the application has been finished and might imply actions for its improvement.
Consequently, two stages were required to achieve the goal that was set. The first of these allowed an interactive multimedia application for training in OM with a constructivist focus and that makes use of the ICT to be conceived, designed and assessed on the production and expert levels. The second consisted of assessing the application that was developed at the user level. This assessment focused on an analysis of the application’s features (design and operation) and on a comparison with traditional on-site teaching (OST).
During this first conception, development and formative assessment stage, the conception phase began with the determination of the topic to be implemented as content of the application. A classic topic in the discipline was chosen, the Just in Time (JIT) / Lean Production philosophy, which is highly relevant both to business practice (Avella, Fernández, & Vázquez, 1999; Marvel & Standridge, 2009; Miller, Pawloski, & Standridge, 2010; Puvanasvaran, Megat, Hong, & Razali, 2009; Schonberger, 2007) and in OM subject programmes (Bradley & Willett, 2004; Goffin, 1998; Machuca & Alfalla-Luque, 2002 and 2003; Ozelkan & Galambosi, 2009; Slack, Lewis, & Bates, 2004).
JIEM, 2011 – 4(1): 31-80 – Online ISSN: 2013-0953
Print ISSN: 2013-8423
that the user did not need to have any prior experience of the computer to use it properly.
The design of a good educational interactive multimedia application requires appropriate knowledge of the users who are going to operate the application, setting out a teaching strategy that follows a student-centred learning focus, and the design of a suitable graphic interface that makes use of a suitable combination of media, with a greater degree of interactivity than other multimedia applications whose purpose is merely to provide information.
The training strategy or, in other words, the learning process that the user follows, has been based on the constructivist approach in an endeavour to achieve student self-learning. The constructivist approach places a very active role upon the student in the teaching-learning process (Lewis, 1999; Shuell, 1996). It assumes that the person is not only a processor of information, but also a constructor of this depending on his/her experience, previous knowledge, and attitudes towards the content, media, materials and messages with which s/he interacts (Cabero, 2001). For this focus to be achieved the system has to be provided with a navigation system that gives users freedom of movement, a tracking system that guides their study, and a self-assessment system that tells them what level of knowledge of the subject matter they have achieved. Alongside these elements visual and interactive teaching software is required to encourage active learning. An attractive visual interface is important for generating interest and initial motivation, whilst the need for interaction ensures the cognitive engagement necessary for learning (Belton et al., 1997). In this regard, interactivity plays a crucial role in knowledge acquisition and the development of new skills (Domagk, Schwartz, & Plass, 2010; Evans & Gibbons, 2007; Sims, 1997; Wang, Vaughn, & Liu, 2011). Learners take on more active roles and assume greater responsibility within their own learning process and are able to follow their own learning style.
JIEM, 2011 – 4(1): 31-80 – Online ISSN: 2013-0953
Print ISSN: 2013-8423
consistent methodological basis in the development of this type of tool might result in a low-quality product, whatever the resources used to produce it. We have followed generally-acceptable recommendations, style-guides and usage norms within the field of Educational Technology and Human Computer Interaction for the design of the interface (e.g. Crowther, Keller, & Waddoups, 2004;Dumas & Redish, 1999; Kemp & Buckner, 1999; Kim, Douglas, Orkand, & Astion, 2001; Lockyer, Bennett, Agostinho, & Harper, 2008; Mayes & Fowler, 1999; Nielsen, 2000; Parlangeli, Marchigiani, & Bagnara, 1999; Rubin & Chisnell, 2008; Schneiderman & Plaisant, 2005; Tullis & Albert, 2008; Van den Akker, Gustafson, Branch, Nieveen, & Plomp, 1999).
With a view to giving the application added-value, it was designed not only to be used by the instructor in the classroom, but so that it also adapted to independent self-learning by the user. The characteristics of distance education teaching materials therefore also had to be taken into account. This would lend itself to an integrated and flexible learning environment that enables greater adaptation to students’ varying timetables and rhythm of learning (Cornélis, Cochinaux, Garady, Ferrant, & Webb, 1997). This is why it was also appropriate to give the application other complementary elements apart from interactivity, a suitable selection of activities, a user-friendly and intuitive interface, and the above-mentioned navigation, tracking and self-assessment systems. An interactive glossary of concepts, with users being able to access key study content terminology, would help with the training and would make the learning process easier. A help module would provide basic information about the way that the application operated and tell the user which actions had to be carried out on any screen at any time. In other respects, a suitable entry module linked to the tracking system would allow users to organise their study and pick up working where they had previously left off in earlier sessions. In short, the aim was to develop a tool that would facilitate student training in the subject matter within a constructivist approach without attending normal on-site classes being essential. The implementation and detailed analysis of these elements in the application is presented in the following section, as it is one of the results of this research.
JIEM, 2011 – 4(1): 31-80 – Online ISSN: 2013-0953
Print ISSN: 2013-8423
media and user-friendly e-learning applications. An idea of the effort that went into its programming can be provided by the 6,800 plus objects that can be found in the current version of the application.
In-process versions of the application were assessed at the production and expert levels concurrently with the development phase. Assessment at the production level was done as the application was being developed. The objectives that had been set in the blueprint were periodically compared with the results that had been achieved thus far. This enabled continuous improvement. The expert assessment, meanwhile, was done by instructors (industrial engineers and BA graduates) with wide experience in the teaching of Operations Management and by experts in Educational Technology. The application that was developed was submitted to critical judgement. Their comments and suggestions were analyzed and the necessary changes were introduced to improve the application. Once this process was finalised, the application was obtained that would be assessed by the students and so begins the second phase of this study.
JIEM, 2011 – 4(1): 31-80 – Online ISSN: 2013-0953
Print ISSN: 2013-8423
the median (1.24). Group 1 was made up of the 34 students with an average mark that was under the median and group 2 of the remaining 34 students.
The students spent a number of sessions with the multimedia applications in the computer room and 25 hours of on-site classes in morning and afternoon groups to facilitate participation and to enable the available computers to be properly managed. The teacher figure was omitted so that students could carry out self— learning although the teacher was present simply as an organiser and to deal with any technical problems. For this reason, in general terms the method used is referred to as computer-assisted distance learning (CADL).
A questionnaire was drawn up to assess the teaching tool that provided for any significant issues highlighted by the designers and experts in assessment processes within the field of Educational Technology (Amorós & Rodríguez, 1999; Arias, González, Navaridas, & Santiago, 2003; Bou, 1997; Cabero & Duarte, 1999; Cabero, 2001; Catenazzi & Sommaruga, 1999; Collaud, Gurtner, & Coen, 2000; Draper et al., 1994; Hosie et al., 2005; Le Roy, 2001; Leacock & Nesbit, 2007; Marquès, 2000; Martínez et al., 2002; SEDISI, 2000; Squires & McDougall, 1997). The final questionnaire was divided into two parts. The first part included application design and operation and these questions were scored by the students on a scale from 1 (strongly disagree) to 5 (strongly agree).
In the second part of the questionnaire the students had to compare the teaching tool that they used (CADL) with traditional on-site teaching (OST). For this a scale was used from 1 (CADL much less than OST) to 5 (CADL more than OST) with 3 equalling parity between the two teaching methods. A last question asked students’ their opinions on whether they considered it to be appropriate to change from the traditional on-site teaching system to a mixed system where off-site credits were covered by teaching materials based on information and communication technologies (ICT). Learners rated this statement on a scale of 1 (strongly disagree) to 5 (strongly agree). The question was put to the students in pre- and post-tests. It could thus be seen whether their taking part in the teaching experiment had led to a change in opinion.
JIEM, 2011 – 4(1): 31-80 – Online ISSN: 2013-0953
Print ISSN: 2013-8423
Tables 1 to 7 and Table 10. In our opinion, the bibliographical review, the above-mentioned critical judgement of researchers and university lecturers and the pilot test all support the validity of the measurement instruments that were designed (Hoskisson, Hitt, Johnson, & Moesel, 1993; O'Leary-Kelly & Vokurka, 1998).
A descriptive analysis was done using the data from the first part of the questionnaire (Tables 1 to 7) and the independent-samples t-Student test was used to determine whether any significant differences between the two groups were established by the control variables (gender and an average overall academic record mark) (Tables 8 and 9). The Levene statistic was used to determine whether there was any homoscedasticity. The one sample t-Student test (Table 10) and the paired-samples t-Student test were applied to the data obtained from the second part of the questionnaire, the latter to compare the results of the question asked in the pre- and post-tests (Table 11). All the analyses have been done at the 95% confidence level.
4 Results
Given the objective of the study, this section has been duly divided into three subsections. In the first, the interactive application is explained. The second and the third present the assessment done at user level providing the results of both the analysis of the application design and operation and those related to the use of the software as a teaching instrument compared to traditional on-site teaching (lectures).
4.1 The multimedia application
JIEM, 2011 – 4(1): 31-80 – Online ISSN: 2013-0953
Print ISSN: 2013-8423
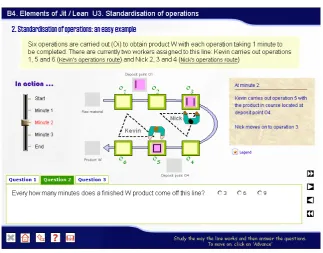
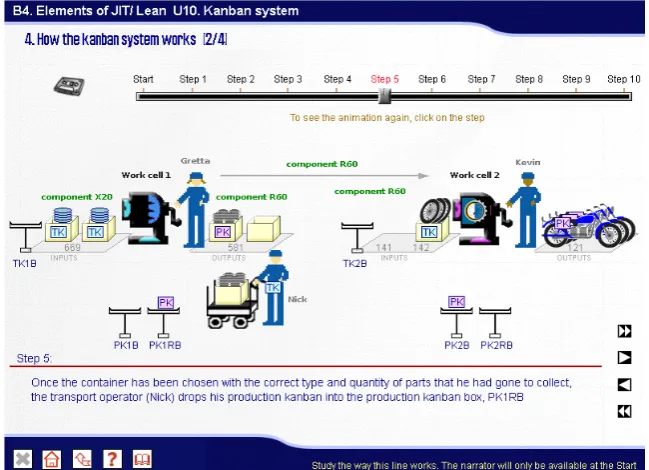
Figure 1. “Example of interaction”.
The design of any application with the features of the one described herein is decidedly influenced by the teaching content which in our case is related to JIT/Lean Production. Given the marked theoretical character of this, it has been essential to undertake considerable synthesising and structuring in order to achieve a training process in keeping with the previously specified strategy. The best media and formats for each concept being taught or example given (texts, photographs, graphics, animations, videos and narrations) (Figure 1) were carefully selected in each case. A range of different kinds of exercises and types of interaction were also designed to allow users to be an active part in the construction of their own knowledge: multiple choice self-assessment tests, interactive exercises with help messages when mistakes were made, links to a glossary of concepts and other sections of the application, etc.
JIEM, 2011 – 4(1): 31-80 – Online ISSN: 2013-0953
Print ISSN: 2013-8423
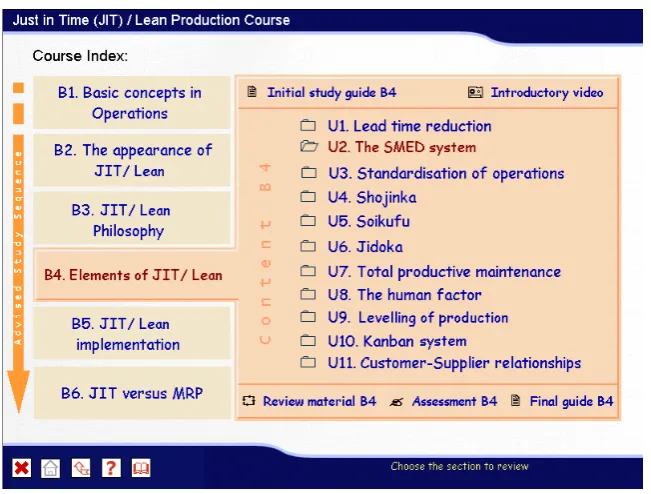
divided into subject units, each with its own entity. These subject units represent the basic unit of learning, and are organised in such a way as to present the fundamental content that the student must learn. From our point-of-view, this facilitates a progressive study of the contents when the student follows the logical, recommended order.
Figure 2. “Main or Blocks Screen”.
To complete the educational organisation of the course, each of the blocks and units includes five elements to help with learning (Figure 2, Figure 3):
• Initial study guide. This presents the learning objectives for the subject as
well as indicating the units or blocks that should have been learnt before attempting the study of a unit or block.
• Introductory Video or Reading. In some blocks and units an element called
Introductory Video or Reading is included that gives advice on pre-reading or for watching a video of a real case.
• Review Material. Material that the user can use to review the content of the
JIEM, 2011 – 4(1): 31-80 – Online ISSN: 2013-0953
Print ISSN: 2013-8423
• Self-Assessment Module. A test with a time-limit to assess the user on the
material that has been studied. Users can evaluate the degree of knowledge that they have gained and learn from their mistakes (at the end of the test a review of same with explanatory remarks can be accessed). As the test is being done, the application randomly chooses and orders the multiple-choice questions and exercises included from a database with a large number of questions. The answers to the questions are also placed in a random order each time an assessment test is generated. An attempt is thus made to prevent the trial and error that occurs when the user repeats self-assessment tests again and again. This is all to the benefit of the user who can do the test a greater number of times without it becoming repetitive
• Final study guide. This includes a summary of the results achieved in the
self-assessment module. Depending upon the user’s results, an indication is given of whether it is suitable for him/her to move on or to review the current element.
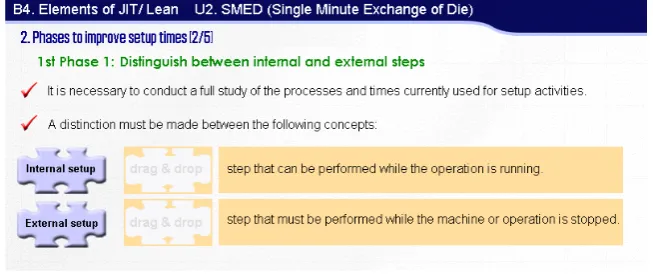
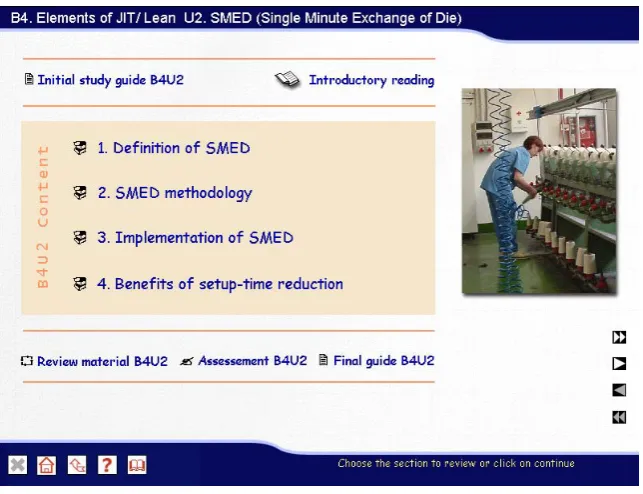
Figure 3. “Index screen for Block 4 Unit 2: SMED (Single Minute Exchange of Die)”.
JIEM, 2011 – 4(1): 31-80 – Online ISSN: 2013-0953
Print ISSN: 2013-8423
application’s features. Specifically, we focus on the design and implementation of the interface, interactivity, the tracking system, the navigation system, the glossary and the help module. Finally these elements are set within the framework of the application structure.
We have tried to achieve a user-friendly, easily operated and intuitive interface which does not require the student to have previous experience with computers and which enables all the effort to be focused on the purely cognitive tasks. There is an all-too-frequent temptation to transfer material from print copy to the digital format without giving thought to the possibilities ICT provide for better transferring knowledge and fostering and developing the student’s skills; we avoided this temptation. The design has therefore attempted to provide a suitable balance of on-screen media at any given time, in order to avoid saturation and the presence of non-essential information.
Continual interactivity has been sought with the application that enables learning to be more flexible and better adapted to the personal requirements of the student. Interactions are designed to support different levels of learning from the simple stimulus-response to higher level problem solving. Individual students must be able to build their own content structure making their choices on the basis of their work rhythm and requirements. To this end, we have opted for giving the user free-navigational reign, with every block or unit being accessible at all times. The content has also been divided into a number of different concepts which are then presented in the format that is most appropriate for the information to be transmitted (texts, graphics, videos, animation, etc.). To progress in their learning users easily interact with the application through links connecting a range of elements and icons representing the different actions (Figure 4). These icons do not change throughout, which means users soon learn how to operate the application.
JIEM, 2011 – 4(1): 31-80 – Online ISSN: 2013-0953
Print ISSN: 2013-8423
Figure 4. “Example of interaction”.
The study guide has been devised on the basis of the Tracking System. This is a programmed internal structure that allows all a user’s activity to be tracked. Its main objective is to guide users in the study of the course on the basis of the actions that they have carried out. The application therefore identifies what users have done up to any given point in time. The users then receive information about what they should do, what concepts they should study, what they have made mistakes in and why, etc. All the information and suggestions that the application makes to the user are given interactively thanks to the data that the tracking system collects. The guide function described exists across the whole application. It is therefore found in a variety of elements, such as content screens, the Initial and Final Study Guides, the Instructions Area in the Help Module, the Entry Module and the Navigation System.
JIEM, 2011 – 4(1): 31-80 – Online ISSN: 2013-0953
Print ISSN: 2013-8423
application easily. This is facilitated by the inclusion in the software of a number of different navigational tools:
• Navigation Map, with two types of screen: the main, or blocks screen
(Figure 2), which is a first level navigation map, and index screens for the subject units, which are second level navigation maps (Figure 3). As a recommendation, the application indicates at all times the path that should be followed. As they move around these screens users know where they are, where they have been, which units or blocks they have passed successfully, and where it is recommended that they should go next. This is all done by programmed colour coding using information provided by the Tracking Module. Blue indicates that the element has not been visited and green that the corresponding self-assessment test has been done successfully.
• Permanent Buttons. These facilitate transfer between the different levels of
the course structure and afford access to other available tools. They are always visible in the bottom left hand area of the screen, though not always available.
JIEM, 2011 – 4(1): 31-80 – Online ISSN: 2013-0953
Print ISSN: 2013-8423
• Navigation Buttons. These are found on content screens and allow the user
to move through a concept (it may be explained over a number of different screens), or from one concept to another. They can be found in the bottom right hand area of the screen (Figure 5).
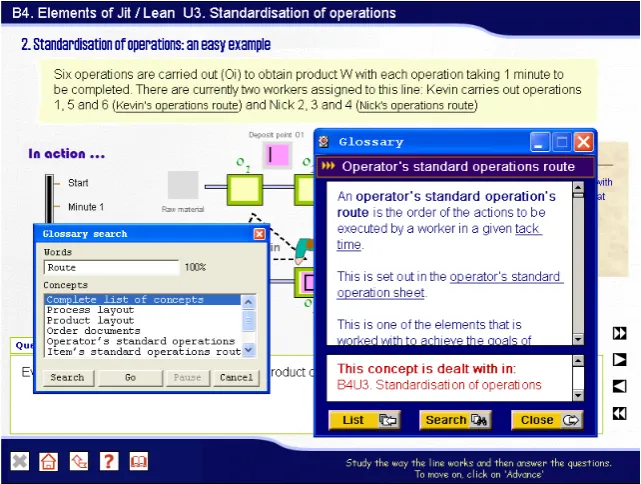
An interactive Glossary of Concepts has also been created to supplement the course content by providing definitions for all JIT/Lean Production-related OM concepts (Figure 6). These are explained using the resources that are considered most suitable in each case (text, images, graphics, etc.). It can be accessed by clicking on the permanent glossary button and it includes a search facility to find the desired concept. There is a second more dynamic system that uses hyperlinks to take you straight to the glossary when clicked on. The user can navigate around the glossary or jump back to the application to discover more about the different concepts. This encourages active and independent learning and facilitates a kind of study that caters for different learning styles.
Figure 6. “Glossary of Concepts with search tool activated”.
JIEM, 2011 – 4(1): 31-80 – Online ISSN: 2013-0953
Print ISSN: 2013-8423
indicates actions that can be taken at any given time (Figure 2). The instructions area uses the information fed to it by the Tracking System.
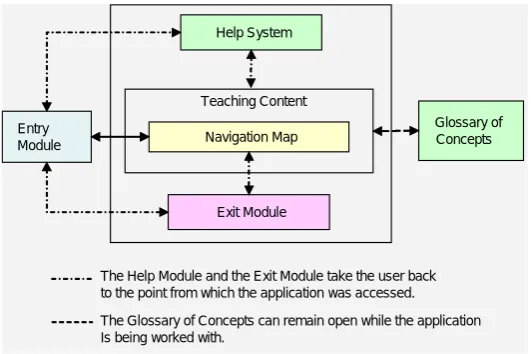
Finally, Figure 7 shows the global structure devised for the application. It shows how the Entry Module provides access to both the Help Module (which can only be exited by returning to the point of entry) and the Exit Module, where the application can be closed down or the user can return to the Entry Module. The Entry Module allows access to the teaching content via the Navigation map; this allows users to return to a previously-recorded study session and to pick up where they left off thanks to the information recorded by the Tracking System. The Help Module, the Glossary of Concepts and the Navigation System are accessible at all times (implicit in the diagram in Figure 7), which allows the user to move from one element to another. Also accessible from the Navigation Map is the Exit Module, which allows the user to either close the application down or return to the Navigation Map. The only element that does not appear in the diagram as described is the Tracking System. This is because it is an internal programming component which helps the rest of the elements that the application is made up of to operate correctly, and which is visible through these.
Entry Module
Help System
Navigation Map
Exit Module
Glossary of Concepts Teaching Content
The Help Module and the Exit Module take the user back to the point from which the application was accessed. The Glossary of Concepts can remain open while the application Is being worked with.
Figure 7. “Diagram of the structure of the application”.
4.2 Multimedia application assessment
JIEM, 2011 – 4(1): 31-80 – Online ISSN: 2013-0953
Print ISSN: 2013-8423
self-assessment module, glossary of concepts, and help module), are analysed and the effect of the application’s design on the concepts explained being understood. Finally, two control variables were considered with a view to finding out whether there were differences in the assessment depending on gender and average overall academic record mark.
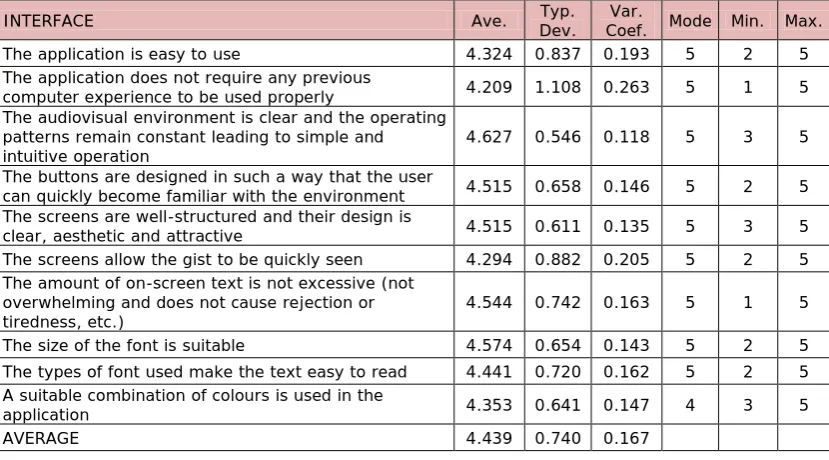
Beginning with the interface-related items (Table 1) the degree of general satisfaction was very high. Students scored the visual environment (4.6), the screen structures (4.5), the way the buttons and content were laid out on-screen (4.5), the amount of on-screen text (4.5) and the size (4.6) and type of font (4.4) all very positively. Users therefore clearly confirm that the application is user-friendly, easily operated, has an intuitive interface and does not require previous experience with computers. This has a direct effect on the learning process. Students therefore do not encounter any problems with the operation of the application and can focus all their effort on learning the content that the application conveys to them
INTERFACE Ave. Dev. Typ. Coef. Mode Min. Max. Var.
The application is easy to use 4.324 0.837 0.193 5 2 5
The application does not require any previous
computer experience to be used properly 4.209 1.108 0.263 5 1 5 The audiovisual environment is clear and the operating
patterns remain constant leading to simple and
intuitive operation 4.627 0.546 0.118 5 3 5
The buttons are designed in such a way that the user
can quickly become familiar with the environment 4.515 0.658 0.146 5 2 5 The screens are well-structured and their design is
clear, aesthetic and attractive 4.515 0.611 0.135 5 3 5
The screens allow the gist to be quickly seen 4.294 0.882 0.205 5 2 5 The amount of on-screen text is not excessive (not
overwhelming and does not cause rejection or
tiredness, etc.) 4.544 0.742 0.163 5 1 5
The size of the font is suitable 4.574 0.654 0.143 5 2 5 The types of font used make the text easy to read 4.441 0.720 0.162 5 2 5 A suitable combination of colours is used in the
application 4.353 0.641 0.147 4 3 5
AVERAGE 4.439 0.740 0.167
Table 1. “Assessment of interface”.
JIEM, 2011 – 4(1): 31-80 – Online ISSN: 2013-0953
Print ISSN: 2013-8423
interactivity and the tracking system. The level of satisfaction can be seen to be quite high on average for the information that the application provides about mistakes that are made and the help for solving them satisfactorily (4.3). Users similarly state that they know what options they have for interacting with the application at all times (4.3), being able to pick up their study where they had left off (4.3) and knowing how their learning is progressing (4.0). This is all achieved thanks to the way information is dealt with by the Tracking System and conveyed to the user via the application screens. Students are engaging in an active rather than a passive learning process as they are continually channelled towards interacting with the application.
Although the scores received by the usefulness of the initial and final study guides are not low (over 3.2), they are rated lower than other elements. This might be due to the fact that their role in this module is to summarise students’ progress and suggest concepts that they should study. If students are studying continually over a short period of time, as was the case in the experiment, users remember how they are advancing and do not need any help. The usefulness of these guides therefore decreases as users remember how they are getting on and do not need any aid. We believe that as study slows down over time the usefulness of these guides will increase as they summarise information about students’ progress.
INTERACTIVITY and TRACKING SYSTEM Ave. Typ. Dev. Coef. Mode Min. Max. Var. Users know what options they have for interacting with
the application at all times 4.284 0.813 0.190 5 2 5
The application provides information about mistakes
made and helps to solve them 4.343 0.863 0.199 5 1 5
The application lets me pick up studying where I had
left off earlier 4.284 0.934 0.218 5 1 5
The application shows the user’s study progress
adequately 4.000 0.921 0.230 4 1 5
The initial study guide is useful for learning 3.235 1.024 0.316 4 1 5 The final study guide is useful for learning 3.294 1.052 0.319 4 1 5
AVERAGE 3.907 0.934 0.239
Table 2. “Assessment of interactivity and Tracking System”.
JIEM, 2011 – 4(1): 31-80 – Online ISSN: 2013-0953
Print ISSN: 2013-8423
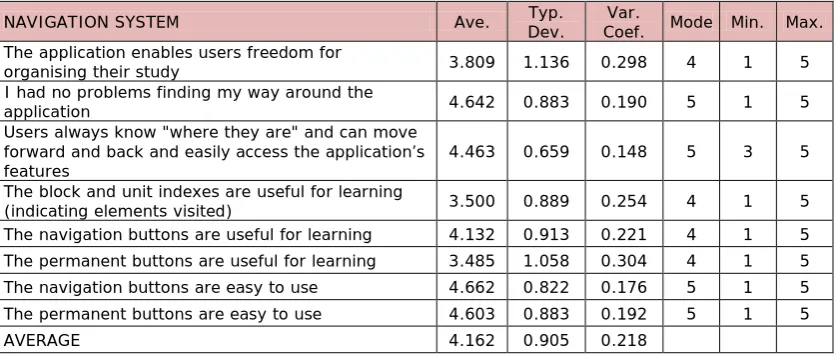
affords them (3.8), the lack of issues with finding their way around the application (4.6) and the ease with which they can situate themselves in the application and access the available features (4.5). Secondly, the remaining items score the usefulness for learning the navigation system’s three basic elements and the ease of use of two of them. The feature that the students find most useful is the navigation buttons (4.1), which may be due to the fact that they are the quickest means of accessing the application content following the recommended order of study. What stands out in other respects is the ease of use of both the navigation (4.7) and the permanent buttons (4.6).
The Navigation System has therefore enabled users to work simply and easily, making their way through the application without getting lost. It has also enabled them to do the learning activities by helping them access the information that they needed easily and quickly. These results corroborate the effectiveness of the efforts made to ensure that students can easily find their way around the application and centre their efforts on the content (rather than on operating the tool). This data also supports the initial goal of favouring a constructivist approach to content learning providing a learning model that is flexible and adapts to each student’s individual study rhythm.
NAVIGATION SYSTEM Ave. Dev. Typ. Coef. Mode Min. Max. Var. The application enables users freedom for
organising their study 3.809 1.136 0.298 4 1 5
I had no problems finding my way around the
application 4.642 0.883 0.190 5 1 5
Users always know "where they are" and can move forward and back and easily access the application’s
features 4.463 0.659 0.148 5 3 5
The block and unit indexes are useful for learning
(indicating elements visited) 3.500 0.889 0.254 4 1 5
The navigation buttons are useful for learning 4.132 0.913 0.221 4 1 5 The permanent buttons are useful for learning 3.485 1.058 0.304 4 1 5 The navigation buttons are easy to use 4.662 0.822 0.176 5 1 5 The permanent buttons are easy to use 4.603 0.883 0.192 5 1 5
AVERAGE 4.162 0.905 0.218
Table 3. “Assessment of Navigation System”.
JIEM, 2011 – 4(1): 31-80 – Online ISSN: 2013-0953
Print ISSN: 2013-8423
great usefulness of the self-assessment module (4.5) and consider it easy to use (4.6). In our opinion, the high score given to the usefulness of this element is due to the features included in its design: random selection and ordering of questions drawn from a broad database and random ordering of possible answers. This enables the user to do the self-assessment tests a greater number of times as training tools.
SELF-ASSESSMENT MODULE Ave. Dev. Typ. Coef. Var. Mode Min. Max. The self-assessment module is easy to use 4.632 0.929 0.201 5 1 5 The self-assessment module is useful for
learning 4.544 0.700 0.154 5 1 5
AVERAGE 4.588 0.815 0.178
Table 4. “Assessment of Self-Assessment Module”.
Another tool that seeks to complement the course content is the interactive Glossary of Concepts. Users score this element positively. They afford it a high degree of usefulness for learning (3.8) and also agree that it is easy to use (4.6) (Table 5). The Glossary’s design also allows the user to navigate and study the different concepts and analyse how these are interrelated. It therefore encourages active and independent learning and supports different learning styles.
GLOSSARY OF CONCEPTS Ave. Typ. Dev. Coef. Var. Mode Min. Max. The Glossary of Concepts is easy to use 4.574 0.951 0.208 5 1 5 The Glossary of Concepts is useful for learning 3.824 1.269 0.332 5 1 5
AVERAGE 4.199 1.110 0.264
Table 5. “Assessment of Glossary of Concepts”.
JIEM, 2011 – 4(1): 31-80 – Online ISSN: 2013-0953
Print ISSN: 2013-8423
HELP MODULE Ave. Dev. Typ. Coef. Mode Min. Max. Var.
The operating instructions are clear and adequate 4.687 0.499 0.106 5 3 5 The instructions window is useful for learning 3.088 1.290 0.418 4 1 5
MEDIA 3.887 0.894 0.230
Table 6. “Assessment of Help Module”.
One interesting issue was to analyse whether the different resources and media were designed in such a way that they favoured the understanding of the concepts that they were explaining. The items that score this issue (Table 7) could be divided into two groups. The first group would include those linked to application design and the use of the media favouring understanding and learning (first five items in Table 7).These items received high scores, above 4.3 in every case. The high degree of agreement (4.4) with the item “the use of different audiovisual elements does not disrupt learning, but stimulates interest and facilitates learning” stands out. This score is especially important as when different multimedia resources are used there is a risk of using the media to such an extent that they eclipse the content.
JIEM, 2011 – 4(1): 31-80 – Online ISSN: 2013-0953
Print ISSN: 2013-8423
UNDERSTANDING OF THE CONCEPTS Ave. Dev. Typ. Coef. Mode Min. Max. Var. The application does not include any elements that are
too quick and make understanding of the concepts
difficult 4.426 0.654 0.148 5 2 5
The use of a range of audiovisual elements does not disrupt learning but, rather, stimulates interest and
facilitates understanding 4.388 0.834 0.190 5 1 5
The application helps mistakes to be understood 4.358 0.753 0.173 5 2 5 The explanations and comments provided by the
application while exercises are being done and when they have been completed have helped me with my learning
4.328 0.766 0.177 4 1 5
The screens provide a sufficient amount of information
for them to be understood properly 4.324 0.818 0.189 5 1 5 The exercises help the concept that they are explaining
to be understood 4.627 0.546 0.118 5 3 5
The text helps the concept that it is explaining to be
understood 4.567 0.557 0.122 5 3 5
The static graphics help the concept that they are
explaining to be understood 4.209 0.640 0.152 4 2 5
The animations and moving graphics help the concept
that they are explaining to be understood 4.090 0.933 0.228 5 2 5 The narrators help the concept that they are explaining
to be understood 3.672 0.860 0.234 4 2 5
The reading texts help the concept that they are
explaining to be understood 3.552 1.019 0.287 4 1 5
The photographs help the concept that they are
explaining to be understood 3.507 0.943 0.269 4 1 5
The videos help the concept that they are explaining to
be understood 3.388 1.058 0.312 4 1 5
AVERAGE 4.111 0.799 0.194
Table 7. “Assessment of Understanding of Concepts”.
Once the different aspects of application design and operation and their effect on understanding the concepts were analysed we moved on to testing whether there were any differences in the scores given by students according to two variables, gender and average overall academic record mark.
The independent-samples t-Student test procedure was used to test whether there were any differences in the scores given to the application on the basis of students’ gender. Levene’s statistic was used to test for homoscedasticity. Table 8 presents the corresponding t statistic depending on whether equality of variance was assumed or not.
JIEM, 2011 – 4(1): 31-80 – Online ISSN: 2013-0953
Print ISSN: 2013-8423
design, the usefulness of the self-assessment module for learning and the help that narrators provide for understanding the concept. The small number of significant differences found does not allow it to be stated in general terms that there are gender-related differences in perception.
Gender Ave. Dev. Typ. F Levene Sig. T-Student t Sig. INTERFACE
Screens are well-structured with a design
that is clear, aesthetic and attractive M F 4.207 0.675 5.151* 0.027 -3.728* 0.001 4.744 0.442 The buttons are designed in such a way
that they enable the user to quickly become familiar with the environment
M 4.276 0.797
8.043* 0.006 -2.510* 0.016 F 4.692 0.468
SELF-ASSESSSMENT MODULE
The self-assessment module is useful for
learning M F 4.345 0.857 4.692 0.521 3.431 0.068 -2.072* 0.042 UNDERSTANDING OF CONCEPTS
The narrators help the concept that they
are explaining to be understood M F 3.414 0.907 3.868 0.777 2.547 0.115 -2.207* 0.031 * p< 0.05
Table 8. “Independent-Samples t-Student test according to gender”.
AM Ave. Dev. Typ. F Levene Sig. T-Student t Sig. INTERFACE
No previous experience of using computers is required for the correct use of the application
< 1.24 4.485 0.939
1.296 0.259 -2.056* 0.044 ≥1.24 3.941 1.204
INTERACTIVITY
Students know what options they have at their disposal for interacting with the application at all times
< 1.24 4.485 0.712
0.498 0.483 -2.044* 0.045 ≥1.24 4.088 0.865
UNDERSTANDING OF CONCEPTS The reading texts help the concept that
they are explaining to be understood < 1.24 ≥1.24 3.794 0.977 0.606 0.439 -2.017* 0.048 3.303 1.015 * p< 0.05
Table 9. “Independent-samples t-Student test according to AM”.
JIEM, 2011 – 4(1): 31-80 – Online ISSN: 2013-0953
Print ISSN: 2013-8423
significant differences that were found it cannot be stated that different scores have been given to the application on the basis of AM.
4.3 Comparison of teaching methods
This section presents the results of the comparison of the educational application used as a teaching instrument (CADL) and traditional on-site teaching (OST). As has been stated, a scale of 1 (CADL much less than OST) to 5 (CADL much more than OST) was used to score the items with 3 equalling parity between the two teaching methods. A one sample t-Student test with a test value equal to 3 was used for each of the aspects to see whether the methods were considered to be similar or not.
One sample t- Student test (test value = 3)
CADL compared to OST Ave. Typ. Dev. coef. Var. t Sig. Difference Ave.
95% Confidence Interval of the
Difference Lower Upper Time required for study 2.059 0.912 0.443 -8.507 0.000 -0.9412 -1.162 -0.720 Effort required for study 2.353 0.958 0.407 -5.568 0.000 -0.6471 -0.879 -0.415 Improves student study
performance (reduces
failure rate) 3.522 0.927 0.263 4.613 0.000 0.5224 0.296 0.749 Helps students to learn
from their mistakes 3.735 1.087 0.291 5.576 0.000 0.7353 0.472 0.999 Allows students to know
what their level of
acquired learning is 4.029 1.119 0.278 7.584 0.000 1.0294 0.758 1.300 Motivates users to study 3.559 0.887 0.249 5.193 0.000 0.5588 0.344 0.774 Arouses students’
interest in the subject
matter 3.529 0.938 0.266 4.655 0.000 0.5294 0.302 0.756 Maintains students’
interest in the subject
matter 3.471 0.969 0.279 4.004 0.000 0.4706 0.236 0.705 Maintains students’
attention/concentration
in the subject matter 3.588 1.040 0.290 4.664 0.000 0.5882 0.336 0.840 Adapts to your own
rhythm of study 3.750 1.070 0.285 5.778 0.000 0.7500 0.491 1.009 Makes it easy to
combine study with
having a job 4.162 1.217 0.292 7.872 0.000 1.1618 0.867 1.456
Table 10. “CADL compared to OST: One sample t-Student test”.
JIEM, 2011 – 4(1): 31-80 – Online ISSN: 2013-0953
Print ISSN: 2013-8423
whether they are above or below 3 it can be seen that CADL receives better scores than OST in all the aspects under study. Specifically, learners state that less time is required to study with CADL (2.1) and less time is required in order to learn (2.4) than with OST. The students also consider that CADL improves student performance (3.5), helps students to learn better from the mistakes that they make (3.7), allows them to know better what their level of acquired learning is (4.0), motivates them more to study (3.6), arouses and maintains their interest in the subject matter (3.5), maintains their attention/concentration on the subject matter better (3.6) and adapts better to users’ needs both with regard to their rhythm of study (3.8) and when they need to combine their studies with having a job (4.2).
An independent-samples t-Student test was used to analyse whether any gender-based differences existed in the scoring of the items. Significant differences were only found for the "Makes it easy to combine study with having a job" item (t: -2.343; sig. 0.023). To be specific, females score this item significantly higher (4.5) than males (3.8). Both genders are therefore concluded to value CADL more although females consider the method has a greater capacity for enabling study to be combined with work activity than males. This result may be due to the greater awareness of females of the need to reconcile a career with other activities that have to be performed, including training.
In other respects, the two groups established on the basis of the median were considered to analyse the influence of the AM on the comparison of methods. The independent-samples t-Student test was applied without any significant differences being identified in the scoring of each item.
It can therefore once again be stated that in general terms no significant differences have been found in the scoring as far as either of the control variables are concerned.
JIEM, 2011 – 4(1): 31-80 – Online ISSN: 2013-0953
Print ISSN: 2013-8423
statement before studying using the application that was developed (3.5). Once the experiment had been completed their degree of agreement had risen slightly (3.6). However, when the paired-samples t-Student test with 95% confidence (t = -0.731; p-level = 0.467) was applied, no significant differences were found between the two observations. This leads us to believe that the experience responded to students’ initial expectations and reaffirmed the opinion that they had at the beginning.
Pre test Post test Ave. Typ. Dev. Ave. Typ. Dev. I believe it would be suitable to change the current on-site teaching
system for my university studies to a mixed system in which off-site credits are covered by information and communication (ICT)-based teaching material
3.515 1.1928 3.621 1.1867
Table 11. “Pre- and post-test”
A dual analysis was carried out to discover whether the two control variables, gender and AM, have any influence on this issue. Firstly, using the independent-samples t-Student test it was confirmed that there are no significant gender-based differences in the responses given at the beginning and end of the experiment. The same was true when the users were divided on the basis of their AM. When the paired-samples t-Student test was applied to compare initial and final responses, it was also confirmed that there are no significant differences according to either gender or AM. The control variables therefore had no significant influence on users’ opinions on this question.
5 Conclusions
JIEM, 2011 – 4(1): 31-80 – Online ISSN: 2013-0953
Print ISSN: 2013-8423
Using a constructivist approach that encourages active learning adapted to the needs of each individual student, a very practical and interactive explanation of the concepts being taught was sought underpinned by the use of a range of media and copious exercises that both enabled the most common questions to be answered and assisted the learning process. The use of a consistent methodological base for conceiving and producing the software and the analysis of the scores awarded by students who worked with it confirm its technical, operational and pedagogical effectiveness in general terms.
The results obtained from the analysis of the application show some very positive scores were given to its design and operation. With regard to the interface, students showed a very high degree of satisfaction with its various structure-related aspects and the format in which information is presented, and also with the layout of on-screen content. These results would seem to confirm that the interface design is homogeneous, attractive and suitable for preventing user eye fatigue and loss of concentration when studying. The student scores also show that the software is very easy to use and does not require any prior computer training. Students also considered that the application’s work environment was very clear with consistent operational patterns and that it was simple and intuitive to use. If to the ease of use of the application we add the high degree of positional awareness shown when navigating through the various modules and content it can be concluded that users’ control over the software was very high, which enabled them to focus all their efforts on the learning tasks.
Student perceptions also indicate that the design of the application and the different media used favour understanding and the learning of the concepts that are being explained and stimulate interest in the subject matter. These scores are especially relevant when it is borne in mind that one problem that is traditionally attributed to OM subjects is, precisely, a lack of understanding of the concepts (Johnson & Drougas, 2002; Yazici, 2006, Fish, 2008). It can therefore be concluded that both the application that was designed and the teaching methodology that underlies it contribute to avoiding one of the main difficulties attributed to the discipline.
JIEM, 2011 – 4(1): 31-80 – Online ISSN: 2013-0953
Print ISSN: 2013-8423
research both show a range of elements that corroborate that it was effectively applied. Firstly, the software has a marked interactive character and also possesses a tracking system that enables users to situate themselves in the study of the content on the basis of their actions. Consequently, alternative paths of study are suggested which allow users to progress through the content depending on each individual’s training needs. The students stated that they knew the options that they had for interacting with the application at all times and, broadly-speaking, expressed a high degree of satisfaction with aspects of the tracking system (help and information provided on mistakes they made, the possibility of picking up their session where they had previously left off, the opportunity to know how their learning was progressing, etc.). To this must be added the wide range of ways to access the information and knowledge building offered by the navigation system, which was scored very positively. Finally, students perceived that the software allowed them a very high degree of freedom for organising their study, which supports our goal of providing a flexible learning model that moulds itself to the demands and requirements of individual users. All the above leads us to conclude that the application enables the effectiveness of the learning process to be improved by promoting active learning that can be adapted to different learning rhythms and styles. This is in keeping with Belton et al. (1997) and Cairncross and Manion (2001) who stated that the learning process improves when active learning is encouraged through interactivity, when there are navigation systems that allow the user to control the information and develop different learning styles, or when users are given the opportunity to learn in their own time and at their own pace.
JIEM, 2011 – 4(1): 31-80 – Online ISSN: 2013-0953
Print ISSN: 2013-8423
When we focus on the comparison of the teaching method followed by the users of the software (CADL) and traditional on-site teaching (OST), student scores show a clear preference towards studying using the interactive multimedia application. These scores were significantly in favour of CADL in all the aspects provided for: help for learning from mistakes made, information about the acquired level of learning, the perceived study efficiency (time, effort and performance), psycho-pedagogical aspects (motivation, interest in the subject matter and attention / concentration), adaptation to rhythm of study and the suitability of the method when studies are combined with some work activity. This last aspect leads us to also consider the usefulness and suitability of the software for permanent education environments, which are, precisely, one of the European Union’s main lines of interest in the field of training.
The results for the scores given for the implementation of a mixed teaching system with off-site credits covered by the ICT demonstrate that students are well predisposed towards it initially and that continues to be the case after their learning experience with the multimedia software. Studying using the application can be concluded to correspond to students’ expectations regarding this mixed teaching system’s potential. In other respects, the fact that the average degree of acceptance did not improve significantly after the experience might reflect the importance that students still afford the traditional on-site teaching that they know and with which they are familiar. In effect, despite the fact that students state a preference for the CADL that they experienced over OST, it is understandable that they might still be reticent about a more intensive use of the methodology in their university studies as a whole and, especially, that they still value a teacher being present in the classroom however satisfactory their study has been using the interactive multimedia software.
JIEM, 2011 – 4(1): 31-80 – Online ISSN: 2013-0953
Print ISSN: 2013-8423
detected gender differences associated with the use of computers in school age children, but not in people in older age-groups. It is also in line with Arbaugh (2000), who did not find any significant differences between males and females in the variables that were analysed. However, wider-ranging research in this field seems to be required to examine any influence that this variable might have and to detect any behaviour patterns, should there be any.
The characteristics of this study lead us to some considerations. It should be borne in mind that the study was carried out in a controlled environment and not in the normal on-site university teaching process of an OM subject. Although this could be seen as a limitation, it in fact reinforces the assessment results by introducing a greater degree of experimental rigour, as the avoidance of disrupting variables that might affect the conducting of the experiment was being sought (students who do not attend all the classes, number of hours devoted to study, monitoring of teaching materials used in the research, etc.). The results obtained direct us to ways in which the research can be developed in the future. These could focus on its use and analysis when incorporated into on-site teaching through suitable learning strategies to include it in the regular teaching of the subject. In this new context, the figure of the teacher as a coordinator of the teaching-learning process will mean the tool can be used in new ways.
The methodology used for the design of the software and the main conclusions drawn from the analysis of the results of this study show the clear potential of multimedia application use in OM training. In our opinion, these advantages could be extended to other related subjects, especially those linked to Industrial Organisation and Business Management if they make use of similar tools to the one described in this paper.
JIEM, 2011 – 4(1): 31-80 – Online ISSN: 2013-0953
Print ISSN: 2013-8423
References
AACSB (1997). AACSB report on teachers and problems related to teaching in Higher Business Administration Schools (1995-96). AEDEM News, 6.
Ahire, S.L. (2001). Linking Operations Management students directly to the real world. Interfaces, 31(5), 104-120.
Alfalla-Luque, R. & Machuca, J.A.D. (2001). Estudio empírico sobre los métodos docentes y de evaluación en la enseñanza de la Dirección y Gestión de la Producción/Operaciones en la Universidad española. Revista Europea de Dirección
y Economía de la Empresa, 10 (3), 75-96.
Alfalla-Luque, R. & Machuca, J.A.D. (2003). An empirical study of POM teaching in Spanish universities (II): Faculty profile, teaching and assessment methods.
International Journal of Operations and Productions Management, 23 (4),
375-400.
Alfalla-Luque, R., Arenas-Márquez, F.J. & Medina-López, C. (2001). La aplicación de las TIC a la enseñanza universitaria y su empleo en la formación en Dirección de la Producción/Operaciones. PixelBIT. Revista de Medios y Educación, 16 (enero), 61-75.
Alfalla-Luque, R., Medina-López, C. & Arenas-Márquez, F.J. (2011). Mejorando la formación en Dirección de Operaciones: la visión del estudiante y su respuesta ante diferentes metodologías docentes. Cuadernos de Economía y Dirección de la
Empresa, 46 (in press).
Altherr, S., Wagner, A., Eckert, B. & Jodl, HJ. (2004). Multimedia material for teaching physics. European Journal of Physics, 73 (1), 7-14.
Ammar, S. & Wright, R. (2002). A demostration of push/pull assembly line. Informs
JIEM, 2011 – 4(1): 31-80 – Online ISSN: 2013-0953
Print ISSN: 2013-8423
Amorós, L. & Rodríguez, M.T. (1999). Descripción de un instrumento de evaluación para multimedia didáctico. In Cabero, J. (Coord). EDUTEC. Nuevas Tecnologías en
la formación flexible y a distancia. Seville, Spain: Secretariado de Recursos
Audiovisuales y Nuevas Tecnologías de la Universidad de Sevilla.
Andresen, B.B. & van den Brink, K. (2002). Multimedia in Education: Specialised
Training Course. UNESCO Institute for Information Technologies in Education.
Retrieved November 10th, 2010, from
Arbaugh, J.B. (2000) Participation in an Internet-Based MBA Course. An Exploratory Study of the Effects of Gender on Student Learning and Class. Management
Learning, 31 (4), 503-519.
Arbaugh, J.B., Desai, A., Rau, B. & Sridhar, B.S. (2010). A review of research on online and blended learning in the management disciplines: 1994–2009.
Organization Management Journal, 7, 39–55.
Arias Oliva, M., González Menorca, L., Navaridas Nalda, F. & Santiago Campión, R. (2003). Quality in elearning management education: a methodology to measure
content quality. Paper presented at the XVII Congreso Nacional y XIII Congreso
Hispano-Francés AEDEM, Bordeaux, France.
Avella Camarero, L., Fernández Sánchez, E. & Vázquez Ordás, C.J. (1999). Análisis de las estrategias de fabricación como factor explicativo de la competitividad de la gran empresa industrial española. Cuadernos de Economía y Dirección de la
Empresa, 4, 235-258.
Balazinski, M. & Przybylo, A. (2005). Teaching Manufacturing Processes Using Computer Animation. Journal of Manufacturing Systems, 24 (3), 237-243.
Ball, P. & Thornbury, H. (2004). A student Learning environment without the Overhead? Reviewing Cost and Benefits of CAL within a Manufacturing Course.
JIEM, 2011 – 4(1): 31-80 – Online ISSN: 2013-0953
Print ISSN: 2013-8423
Barron, A.E. & Orwig, G.W. (1995). Multimedia Technologies for Training. Englewood Cliffs, NJ: Prentice-Hall.
Belton, V., Elder, M. & Thornbury, H. (1997). Early Experiences of Mentoring: Design and use of Multimedia Materials for Teaching OR/MS. Omega, Int. J. Mgmt
Sci, 25 (6), 659-676.
Benyon, D., Stone, D. & Woodroffe, M. (1997). Experience with developing multimedia courseware for the World Wide Web: the need for betters tools and clear pedagogy. International Journal of Human-Computer Studies, 47, 197-218.
Bou Bouzá, G. (1997): El guión multimedia. Madrid, Spain: Ed. Anaya Multimedia.
Boykin, R. F. & Martz Jr., B. (2004). The integration of ERP into a logistics curriculum: applying a systems approach. Journal of enterprise information
management, 17 (1), 45-55.
Bradley, J.R. & Willett, J. (2004). Cornell students participate in Lord Corporation's kaizen projects. Interfaces, 34 (6), 451-459.
Cabero Almenara, J. & Duarte Hueros, A. (1999). Evaluación de medios y materiales de enseñanza en soporte multimedia. Píxel-Bit, Revista de Medios y
Educación, 13, 23-45.
Cabero Almenara, J. (2001). Tecnología Educativa. Diseño y utilización de medios
en la enseñanza (262-264). Barcelona, Spain: Ed. Paidós.
Cairncross, S. & Mannion, M. (2001). Interactive Multimedia and Learning: Relizing the Benefits. Innovations in Education and Teaching International, 38 (2), 156-164.
Carraway, R.L. & Freeland, J.R. (1989). MBA training in Operations Management and Quantitative Methods. Interfaces, 19 (4), 75-88.
JIEM, 2011 – 4(1): 31-80 – Online ISSN: 2013-0953
Print ISSN: 2013-8423
Catenazzi, N. & Sommaruga, L. (1999). The evaluation of the Hyper Apuntes interactive learning environment. Computers and Education, 32 (1), 35-49.
Chapman, B.L. (1995). Accelerating the design process: a tool for instructional designers. Journal of Interactive Instruction Development, 8 (2), 8-15.
Collaud, G., Gurtner, J.L. & Coen, P.F. (2000). Design and use of a hypermedia system at the University level. Journal of Computer Assisted Learning, 16 (2), 137-147.
Cornélis, F, Cochinaux, P., Garady, D., Ferrant, C. & Webb, M. (1997). Investing in
knowledge: the integration of technology in European education. Brussels,
Belgium: European Round Table of Industrialists.
Cox, J.F., & Walker, E.D. (2005). Increasing Student Interest and Comprehension of Production Planning and Control and Operations Performance Measurement Concepts Using a Production Line Game. Journal of Management Education, 29 (3), 489-511.
Coye, R.W. & Stonebraker, P.W. (1994). The effectiveness of personal computers in Operations Management Education. International Journal of Production
Management, 14 (2), 35-46.
Crowther, M.S., Keller, C.C., & Waddoups, G.L. (2004). Improving the quality and effectiveness of computer-mediated instruction through usability evaluations.
British Journal of Educational Technology, 35 (3), 289-303.
Domagk, S., Schwartz, R.N. & Plass, J.L. (2010). Interactivity in multimedia learning: An integrated model. Computers in Human Behavior. 26 (5), 1024-1033.