JIEM, 2017 – 10(1): 98-110 – Online ISSN: 2013-0953 – Print ISSN: 2013-8423 https://doi.org/10.3926/jiem.800
A Concurrent Optimization Model for Supplier Selection
with Fuzzy Quality Loss
Cucuk Nur Rosyidi , Rina Murtisari , Wakhid Ahmad Jauhari
Industrial Engineering Department, Universitas Sebelas Maret Surakarta (Indonesia)
[email protected], [email protected], [email protected]
Received: March 2013 Accepted: February 2017
Abstract:
Purpose: The purpose of this research is to develop a concurrent supplier selection model to minimize the purchasing cost and fuzzy quality loss considering process capability and assembled product specification.
Design/methodology/approach: This research integrates fuzzy quality loss in the model to concurrently solve the decision making in detailed design stage and manufacturing stage.
Findings: The resulted model can be used to concurrently select the optimal supplier and determine the tolerance of the components. The model balances the purchasing cost and fuzzy quality loss.
Originality/value: An assembled product consists of many components which must be purchased from the suppliers. Fuzzy quality loss is integrated in the supplier selection model to allow the vagueness in final assembly by grouping the assembly into several grades according to the resulted assembly tolerance.
1. Introduction
An assembled product may consist of several components. Recently, more and more manufacturing companies start to purchase components manufactured by suppliers instead of producing all components by themselves (Xi & Qin, 2013). The concept of outsourcing is based on the idea that companies should focus their effort to their core competence (Teeravaraprug, 2008). This concept provides many benefits to a company such as reducing production cost, doubling before tax income, improving company’s performance, and helping companies for being more focus on their core business (Barthelemy, 2003). The main problem related to outsourcing is how to select suppliers and then determine the component types and quantities that must be allocated to the selected suppliers. Hence supplier selection is complex, difficult, and time consuming since it is strategic and usually involves multi criteria decision making. Weber, Current and Desai (2000) pointed that the difficulties in supplier selection have three reasons: a large number of supplier to select, no single best supplier that offers the best performance in all criteria, and suplliers might change their offers/performance on important criteria.
2. Literature Review
Product quality is a critical concern for most manufacturers and the need for high-quality suppliers has always been an important issue for many manufacturing organizations (Pi & Low, 2006). Beside quality, purchasing price of components from suppliers is a widely used factor in supplier selection. Linn, Tsung and Ellis (2006) conducted a research in supplier selection using process capability and price analysis. They proposed a methodology using a chart which partitioned the suppliers into several zones according to their quality performances and price levels. Ghorbeni, Bahrami and Arabzad (2012) proposed an integrated model for supplier selection using Shannon Enthropy and SWOT and the order allocation was done using linear programming. Their research included quality and price as the criteria in supplier selection which are assessed qualitatively by the decision maker.
There are two kinds of quality costs that must be considered by a company, i.e. internal and external. Internal quality cost consists of appraisal cost and the cost of rework and scrap. External quality cost measures the loss to society in using a product. Taguchi quality loss is the most widely used function to measure the external quality cost. In Taguchi quality loss, the loss is measured by deviation of mean performance from its target value and the variance of performance level. Using the quality loss, a product still contains losses even its performance is inside the specification limits. Pi and Low (2006) used Taguchi loss function and analytical hierarchy process (AHP) in supplier selection. Taguchi loss function was used to measure the loss in the criteria (quality, on-time delivery, price, and service), while AHP was used to determine the weight of each criteria. Nukala and Gupta (2007) developed a multi-objective optimization model for suppliers selection. The research used Taguchi loss function to measure the quality as one of the criteria in selecting the suppliers. Teeravaraprug (2008) developed an optimization model for outsourcing and supplier selection based on Taguchi loss function. The research used the Taguchi loss function to measure the losses due to poor quality, speed, dependability, and flexibility.
the best supplier. Guneri and Kuzu (2009) gave a case study in supplier selection using fuzzy approach in just in time environment.
Several research proposed the application of fuzzy in quality design and analysis. Monfared and Dadashian (2005) proposed a fuzzy method in the assessment of quality and applied the results to a textile company. Hsieh (2007) proposed the application of fuzzy to determine the quality loss in parameter design optimization using Taguchi method to improve the quality of qualitative response. Stella and Alena (2012) developed an application of fuzzy principles in evaluating quality of manufacturing process using Matlab. The fuzzy is used to represent the uncertainty in process capability and simulation is conducted to determine the quality of the final product. Xi and Qin (2013) proposed a product quality evaluation system based on AHP fuzzy comprehensive evaluation.
Cao, Mao, Yang, Wu and Wu (2006) and Cao et al. (2009) proposed a robust optimization model to determine the optimal tolerance of an assembly to minimize manufacturing cost and fuzzy quality loss. Using fuzzy quality loss, the products are grouped into several grades in which each grade is determined qualitatively. Hence the assembled product not only contains good or poor quality (classical set theory) but also contains several quality levels that can be determined by fuzzy theory. Chen, Tzeng, Hsu and Chen (2010) proposed the combination of Taguchi method, principal component analysis, and fuzzy logic in the tolerance design of a dual purpose six-bar mechanism. The fuzzy logic in that research is used to derive the multiple performance index from the result of experiment.
3. Fuzzy Quality Loss
Fuzzy theory is an expansion of the traditional set theory (Hsieh, 2007). In traditional set theory, an object is classified into crisp set. The membership function of a crisp set function only has two values, i.e. 0 or 1. According to Zadeh (1965), fuzzy theory is applied to the classes of objects which do not have precisely defined criteria of membership. Further, it is explained that a fuzzy set A in X is characterized by a membership function which associates with each point in X a real number in the interval [0,1]. Each real number represents the grade of membership of x in A. Hence, the nearer the real number to unity, the higher the grade of the membership of x in A.
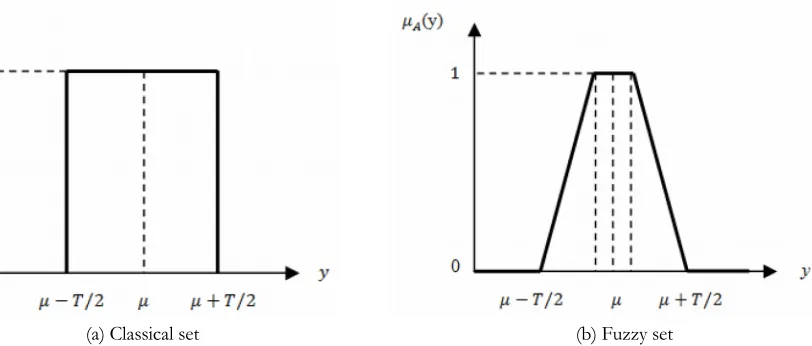
The operation of fuzzy sets is defined using a subject function (μ). It is the crucial component of a fuzzy set (Zimmermann, 1991). For more detailed concept about fuzzy set, please refer to Zadeh (1965) which is also briefly explained in Seyed-Hosseini and Damghani (2009). In product quality sense, the subject function can be determined using engineering knowledge and experience (Hsieh, 2007). Figure 1 shows the difference between the classical set and fuzzy set in quality concept. In that figure, T refers to tolerance of a component or assembly. A fuzzy set à in Y is a set of ordered pairs, i.e.
(1)
where μÃ( y) is called the membership function of y in à and Y is a collection of objects denoted by y. à is
a nonfuzzy set if μÃ( y) contains only the values of 0 or 1, in which 0 indicates poor quality and 1 for good quality. However, if μÃ( y) contains several values between 0 and 1, à is a fuzzy set. The membership function can be transformed into the linguistic values. Linguistic variables are variables whose values are not numbers but words or sentences in a natural or artificial language, such as very good, good, average, and poor. Linguistic values are used since linguistic characterizations are less spesific than the numerical values.
(a) Classical set (b) Fuzzy set
4. Model Development
4.1. Assumptions
1. We assume that each component can be supplied by exactly one supplier.
2. The component key characteristic is normally distributed with mean μ and standard deviation σ.
3. The manufacturing company faces uncertainty in the quality of assembly due to the limited information about the quality of the components.
4.2. Variables and Notations
The following variables and notations are used in model development:
Ãg: quality grade in fuzzy quality loss
cij: price of component i from supplier j
cpk: process capability index
f(y): probability density function of normal distribution
Lg: respected quality loss of quality grade g in fuzzy quality loss
Q: expected fuzzy quality loss
Rg: normalized expected probability of quality grade g in fuzzy quality loss
ti: tolerance of component i
xij: binary decision variable of component i from supplier j
μAg(y): fuzzy membership function of quality characteristic y for quality grade g
σAsm: assembly standard deviation
4.3. Model Statement and Description
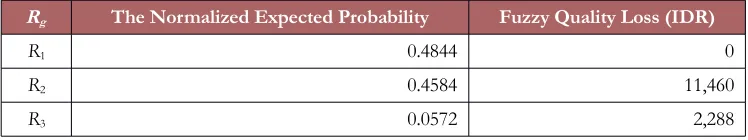
In this research, we consider a manufacturing company that meet the demand by outsource all of the components to suppliers. Each supplier can supply more than one type of component and each type of component can only be supplied by one supplier. Each supplier offers a price according to the corresponding component tolerance. The objective of the proposed model is to minimize the purchasing cost and fuzzy quality loss. In this research, the objective function of the model can be expressed as in Equation (2). We substitute the Taguchi quality loss in the research of Feng, Wang and Wang (2001) by fuzzy quality loss. In that equation, the value of the binary decision variable is 1 if component i is supplied by supplier j and 0 otherwise. The fuzzy quality loss can be expressed as in Equation (3) which is resulted from the multiplication of the normalized expected probability of the quality grade g and the respected quality loss at each grade (Lg). The quality loss at each grade is determined using the engineering knowledge and experience. The fuzzy quality loss equation is taken from Cao et al. (2009).
(2)
(3)
The normalized expected probability can be expressed as in Equation (4) (Cao et al., 2009). It represents the proportion of resulted assembly at each quality grade.
(4)
The formulae of rg can be shown in Equation (5) (Cao et al., 2009).
(5)
In Equation (5), the density function of the normal probability distribution of quality characteristic y is expressed in Equation (6).
(6)
Note that the standard deviation of the assembly in Equation (6) (σAsm) equals to the cumulative tolerances of its components. Since we use statistical tolerance, the expression for the assembly standard deviation can be shown in Equation (7).
In this research, we consider the tolerance of the assembled product, the number of selected supplier which is only one for each component, and binary variable which is used to represent the decision variables. The tolerance specification of the assembled product must be considered since it is necessary to ensure the quality of the product. Hence the accumulation of component’s tolerance must not exceed the assembly tolerance. The constraint is shown in Equation (8). In the equation, Tk denotes the k-th
assembled tolerance and is the partial derivative of the functional dimension to component i. The
number of selected supplier can be expressed in Equation (9) which is only one supplier will be selected for each component.
(8)
(9)
Binary variable is used to represent the decision variable as in Equation (10). The value of xij is 1 if supplier j is selected to provide component i and 0 otherwise.
(10)
5. Numerical Example and Analysis
Figure 2. The assembly drawing
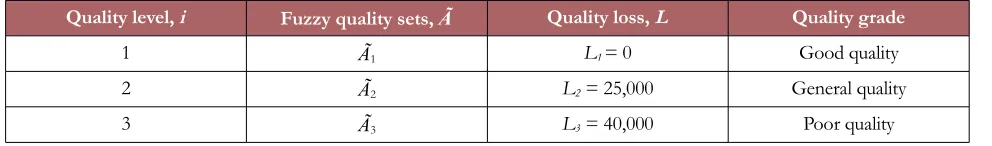
Fuzzy quality sets and quality loss for each quality level must be defined first. In the numerical example, we assume there are three quality grades (good, general, and poor). Each quality grade has different quality loss, as shown in Table 1 (Cao et al., 2009). For good quality grade, the corresponding quality loss is zero since there is no loss for a product with good quality. For general and poor quality grades, the corresponding quality losses are IDR 25,000 and IDR 40,000 respectively.
Quality level, i Fuzzy quality sets, Ã Quality loss, L Quality grade
1 Ã1 L1 = 0 Good quality
2 Ã2 L2= 25,000 General quality
3 Ã3 L3= 40,000 Poor quality
Table 1. Fuzzy quality sets and quality loss
The trapezoidal-type fuzzy membership functions are used for good and poor quality grade, while triangular-type is used for general quality. The fuzzy membership functions for each quality grade are listed in Equations (11), (12), and (13) for good, general, and poor respectively (Cao et al., 2009). With trapezoidal-type membership function, an assembly is considered to be in good grade if the resulted assembly key characteristic is 0.12 ≤ y ≤ 0.28 mm. The key characteristic is considered in the best good quality when 0.18 ≤ y ≤ 0.22 mm. The lowest good grade is considered when the key characteristic is either less than 0.12 or more than 0.28 mm. The expected fuzzy membership functions can be determined by substituting Equations (11), (12), and (13) into Equation (5).
(12)
(13)
Different suppliers offer different prices with the coresponding variability of their products. Purchase price and tolerance data of each component from different suppliers are shown in Table 2.
Supplier
Component 1 Component 2 Component 3
Tolerance
(mm) Price (IDR) Tolerance(mm) Price (IDR) Tolerance(mm) Price (IDR)
P1 0.08 17,800 0.1 17,000 0.15 15,000
P2 0.1 15,575 0.12 16,200 0.05 20,000
P3 0.12 13,350 0.06 18,500 0.08 17,000
Table 2. Price and tolerance data for each component for each supplier
6. Conclusions
A concurrent optimization model for supplier selection with fuzzy quality loss is proposed to achieve the balance between purchasing cost and quality loss. The main contribution of this research was to integrate fuzzy quality loss into supplier selection model. This model can be used to effectively minimize the purchasing cost and fuzzy quality loss and it can be used to aid a decision maker in making decisions concerning supplier selection and tolerance allocation. This research applied a fuzzy quality loss to measure the quality loss for the assembly product with limited quality information. Hence the quality must be defined semantically and the membership function for each grade must be defined using engineering knowledge and experience. Future research is directed to include the component’s allocation decision to the selected supplier based on fuzzy quality loss.
References
Barthelemy, J. (2003). The Seven Deadly Sins of Outsourcing. Academy Of Management Executive, 17(2), 87-98. https://doi.org/10.5465/AME.2003.10025203
Bayrak, M.Y., Celebi, N., & Taskin, H. (2007). A Fuzzy Approach for Supplier Selection. Production Planning and Control, 18(1), 54-63. https://doi.org/10.1080/09537280600940713
Cao, Y., Mao, J., Yang, J., Wu, Z., & Wu, L. (2006). A Robust Tolerance Design Method Based on Fuzzy Quality Loss. Frontier of Machanical Engineering China, 1, 101-105. https://doi.org/10.1007/s11465-005-0010-y
Cao, Y., Mao, J., Ching, H., & Yang, J. (2009). A Robust Tolerance Optimization Method Based on Fuzzy Quality Loss. Proceedings of the Institution of Mechanical Engineers, Part C: Journal of Mechanical Engineering Science, 223, 2647-2653. https://doi.org/10.1243/09544062jmes1451
Chen, F., Tzeng, Y., Hsu, M., & Chen, W. (2010). Combining Taguchi Method, Principal Component Analysis and Fuzzy Logic to The Tolerance Design of a Dual-Purpose Six Bar Mechanism. Transactions of the Canadian Society for Mechanical Engineering, 34(2).
Feng, C.X., Wang, J., & Wang, J.S. (2001). An Optimization Model for Concurrent Selection of Tolerances and Supplier. Computers and Industrial Engineering, 40, 15-33. https://doi.org/10.1016/S0360-8352(00)00047-4
Guneri, A.F., & Kuzu, A. (2009). Supplier Selection by Using A Fuzzy Approach in Just-In-Time: A Case Study. International Journal of Computer Integrated Manufacturing, 22(8), 774-783.
https://doi.org/10.1080/09511920902741075
Hsieh, K.L. (2007). Applying Fuzzy Set Approach into Achieving Quality Improvement for Qualitative Quality Response. Proceedings of the 2007 WSEAS International Conference on Computer Engineering and Applications, Gold Coast, Australia.
Kahraman, C., Ertay, T., & Büyüközkan, G. (2004). A Fuzzy Optimization Model for QFD Planning Process Using Analytic Network Approach. European Journal of Operational Research.
Linn, R.J., Tsung, F., & Ellis, L.W.C. (2006). Supplier Selection Based on Process Capability and Price Analysis. Quality Engineering, 18, 123-129. https://doi.org/10.1080/08982110600567475
Monfared, M.A.S., & Dadashian, F. (2005). Design of A New Quality Assessment System Using Fuzzy Taguchi Functions. Proceedings of the 17th IMACS Worldd Congress, Paris.
Nukala, S., & Gupta, S.M. (2007). A Fuzzy Mathematical Programming Approach for Supplier Selection in a Closed-Loop Supply Chain Network. Proceedings of the 2007 POM Dallas Meeting.
Pi, W., & Low, C. (2006). Supplier Evaluation and Selection via Taguchi Loss Functions and an AHP. International Journal of Advanced Manufacturing Technology, 27, 625-630. https://doi.org/10.1007/s00170-004-2227-z
Rosyidi, C.N., Irianto, D., & Toha, I.S. (2009). Prioritizing Key Characteristics. Journal of Advanced Manufacturing Systems, 8(1), 57-70. https://doi.org/10.1142/S0219686709001675
Seyed-Hosseini, S-M., & Damghani, K.K. (2009). Fuzzy Containers Allocation Problem in Maritime Terminal. Journal of Industrial Engineering and Management, 2(2), 323-336.
https://doi.org/10.3926/jiem.2009.v2n2.p323-336
Stella, H., & Alena, V. (2012). Application of Fuzzy Principles in Evaluating Quality of Manufacturing Process. WSEAS Transactions on Power Systems, 2(7).
Xi, X. & Qin, Q. (2013). Product Quality Evaluation System Based on AHP Fuzzy Comprehensive Evaluation. Journal of Industrial Engineering and Management, 6(1), 356-366. https://doi.org/10.3926/jiem.685
Youn, B.D. (2005). Integrated Framework for Design Optimization Under Aleatory And/Or Epistemic Uuncertainties Using Adaptive-Loop Method. Proceedings of DETC ’05, California.
Zadeh, L.A. (1965). Fuzzy Sets. Information and Control, 8, 338-353. https://doi.org/10.1016/S0019-9958(65)90241-X
Zimmermann, H.J. (1991). Fuzzy Set Theory and Its Applications (2nd ed.). Kluwer Academic Publishers. https://doi.org/10.1007/978-94-015-7949-0
Journal of Industrial Engineering and Management, 2017 (www.jiem.org)
Article’s contents are provided on an Attribution-Non Commercial 3.0 Creative commons license. Readers are allowed to copy, distribute and communicate article’s contents, provided the author’s and Journal of Industrial Engineering and Management’s