Issues
ISSN: 2146-4138
available at http: www.econjournals.com
International Journal of Economics and Financial Issues, 2016, 6(4), 1534-1541.
State Economic Policy and Reform in the Oil-exporting Countries
on the Example of Saudi Arabia, the UAE and Iraq
Gurgen Levonovich Gukasyan
1*
,2, Abdel Kademovich Aifary
3, Valeriy Stepanovich Semenovich
4,
Vladimir Valerievich Mantsev
51Department of State and Municipal Management, Faculty of Humanitarian and Social Sciences, Peoples Friendship University of Russia, 6 Miklukho-Maklaya Street, Moscow 117198, Russia, 2Center for Arabic and Islamic Studies, The Institute of Oriental
Studies of the Russian Academy of Sciences, 12 Rojdestvenka Street, Moscow 107031, Russia, 3Department of National Economics, Faculty of Economics, Peoples Friendship University of Russia, 6 Miklukho-Maklaya Street, Moscow 117198, Russia, 4Department of National Economics, Faculty of Economics, Peoples Friendship University of Russia, Miklukho-Maklaya Street 6, Moscow 117198, Russia, 5Department of State and Municipal Management, Faculty of Humanitarian and Social Sciences, Peoples Friendship University of Russia, Miklukho-Maklaya Street 6, Moscow 117198, Russia. *Email: [email protected]
ABSTRACT
The study describes the role of state economic policy in the economic transformation of developing oil-exporting countries on the example of Saudi Arabia, the UAE and Iraq. The objective of the article is to show how state economic policy may be used for modernization of national economy. The study of state economic policy in Saudi Arabia, the UAE and Iraq used various methods of economic science. The method of systemic and economic analysis was used to analyze the economic situation and guidelines of state economic policy in Arab oil-exporting countries under review, illustrated
in the scientific publications and official documents. The method of statistical analysis helps to systematize data and to comprehend the influence of
state economic regulation and participation on the modernization of national economies. Many recommendations on the modernization of developing economies are concentrated on maximal limitation of state regulation of economy to release the market forces. Some publications recommend using state regulation of economy and state participation in the developing countries more widely, than in the developed economies. The authors of the study
identified specific experience and characteristics of state regulation of economy and state participation in the developing economies on the example
of oil-exporting countries such as Saudi Arabia, the UAE and Iraq. The authors of the study believe that some characteristics of state regulation of
economy in Saudi Arabia, the UAE and Iraq may ensure a real progress in economic modernization and must be used in future as efficient. The study
can contribute to understanding the paradigm of relationship between state regulation of economy and market environment in developing countries and to promotion of investigations in economic policy for transitional economies.
Keywords: State Economic Policy, Global Oil Market, State Regulation of Economy, Economic Infrastructure, Financial Crisis
JEL Classifications: G18, O10, O13
1. INTRODUCTION
The trend for growing state role in the development and modernization of economies of the countries of Asia, Africa,
and Latin America which became independent in 1950-1970s
is generally well known. In Arab oil-exporting countries it is
manifested, first, in the revision of contractual relationships
with foreign monopolies, following which governments were able to take control over the distribution of oil export revenues and invest them in national economies. Foreign oil companies
in Arab countries began to be controlled by governments via nationalization and purchase of controlling stocks. In 1973, the Saudi Arabian government had a 25% stake in the Arabian American Oil Company. In 1974, this share was increased to
69% and in 1980, it was amicably agreed that ARAMCO should become 100% Saudi-owned (Al-Farsy, 1990).
In 1971, Abu Dhabi National Oil Company was established in Abu
Dhabi. In 1974, Abu Dhabi government bought 60% of capital
sector, the main part was played by Iraq National Oil Company
(INOC) established in 1964. In 1975, INOC got full control over
oil production in the country after the squeeze-out of British Petroleumand other foreign companies. In 1987, INOC became fully controlled by the Ministry of Oil of Iraq.
The strategy to build the whole structure of oil and gas and oil chemistry sector of Arab countries and other core economic sectors around companies with dominating state capital enabled to create Arab production facilities. The development of oil and non-oil sectors was mutually consistent.
In 1960-1980s, state regulation of economic development via financing development plans and state participation in economy
became a pillar of economic modernization of Arab oil exporting countries. New plans include Saudi Arabia economic development
plan for 2015-2019, National Development Plan 2013-2017 (Iraq), strategic development plans like Saudi Arabia Vision 2030; Abu Dhabi Vision 2030 (Abu Dhabi, the UAE). Their implementation
is related to annual budgeting and economic projects.
In 1980s, the global wave of economic liberalization related to
the IMF’s programs and the WTO rules for developing countries
had ambiguous impact (growing external liabilities, sharpening unemployment, capital outflow, declining living standards).
As distinct from Egypt, implementing the IMF stabilization programs, Arab oil-exporting countries like Saudi Arabia, the
UAE, other Gulf Cooperation Council (GCC) countries and Iraq were in a more beneficial position: Enjoying foreign currency
revenues from oil export they had little external liabilities which in
2005 did not exceed US $10 billion and grew much only in 2009.
Although state grants have always been determining the economic strategy of Arabic monarchies, they have always been declaring
overall promotion of the national private sectors. Since 1990s,
partial privatization of a number of companies occurred, in some sectors foreign capital access was widened. In recent years, within the programs to create competitive economies, Arabic monarchies achieved maximal transparency and comfort in doing business for national and foreign investors.
After the global crisis of 2008-2009, discussion arose on the benefits of rapid denationalization of economies in developing
countries. Among successful Arab economies, Dubai was an
example of that problem, creating non-oil economy, first of all, services, and increasing its non-oil gross domestic product (GDP) to 95%. But in 2008-2009, blowing of speculative turnover caused Dubai’s debts to rise, estimated by the IMF at around 140% of GDP. This compares with an estimated 30% of GDP for Abu Dhabi (Samba Financial Group, 2016).
2. METHODS
The study of state economic policy in Saudi Arabia, UAE and Iraq used various methods of economic science. The method of systemic and economic analysis was used to analyze the economic situation and guidelines of state economic policy in
Arab oil-exporting countries under review, illustrated in the
scientific publications and official documents. The method of
statistical analysis helps to systematize data and to comprehend
the influence of state economic regulation and participation on the
modernization of national economies.
3. RESULTS
Under the conditions of the global oil market fluctuations and new slump of oil prices in 2014-2015, developing and Arab
oil-exporting countries faced the problem of new contemplation of the role of regulation of economies by states. Under instability conditions, all the opportunities related to state regulation of economies should be used, as without that, these countries will not be able to persistently implement development strategy compliant with the local conditions, deliberately integrating their economies with the global market. Local resources and factors of production need to be most fully included in development.
Arab oil-exporting countries are an example of development
strategy based on capital (gained on natural resources). Some
Arab countries have other mineral wealth different from oil
(e.g., phosphates in Morocco). Some Arab countries are not rich in mineral wealth but have good labor resources (e.g., Egypt). In
Saudi Arabia, the UAE and Iraq, since the moment of oil discovery the problem was to timely transform the oil rent into economic infrastructure and new development factors.
Rolf Van der Hoeven, a Professor of the Institute of Social Studies in Hague, wrote that “in the absence of adequate
institutions, liberalization of capital flow is not much linked with
economic growth”. Also, he puts: “Even under due management,
liberalization of capital flow brings to developing countries great
costs, in particular, alternative costs from non-investing in national economies due to establishment of reserve funds in foreign
currency most frequently invested in low-profit securities of other countries” (Van der Hoeven, 2010). The author noted especially the great increase of capital outflow from developing countries in 1990-2000s, migration of hot capitals under the conditions of liberalized financial markets, growing shadow economy while
inequality was rising and labor productivity was falling. Also, it
was noted that during the financial crisis wave of 1990s in Latin
America, Chile managed best restraining its consequences due to introduction of interest-free reserve requirements on the capital
invested in the country. That limited the flow of speculative capital to Chile (the share of short-term external liabilities in the total liabilities dropped from 19.4% in 1990 to just 4.8% in
1997. It enables to conclude that in developing countries the state
should actively act as the final instance creditor, via credit and
bank system, both as the organizer of production process and the
employer (Nadal De Simone and Sorsa, 1999).
We agree with the above points and may state, as exemplified
by Arab oil-exporting countries, that state control over the oil rent by state participation in oil and oil chemical sectors allows accumulating incomes in such a way that they are invested in development of the national economy and economic
economic modernization would be impossible without large-scale
state participation in economy and financial system of income
redistribution at least due to long payback period of investments in most projects.
Therefore, the economic policy on Arab oil-exporting countries of the gulf cannot help but be based on state regulation of economy via state participation in economy. In other words, economic strategy may not be ensured by the private sector regulation steps alone. In the 21st century, the state sector in most countries of the of Middle East and North Africa did not shorten much,
state-owned enterprises (SOE) still play an important part in ensuring
employment, incomes of state budgets, and industrial development.
In the region, such enterprises make up from 20% to 50% of that
value added in the average. In Arab oil-exporting countries of the gulf new enterprises with state stake-holding were established,
about 45% of the total market value (capitalization) of the top companies are controlled by state (Baldwin-Edwards, 2011).
The wave of articles on the need for soonest exit of state from the economy became to be balanced by the ideas on the positive role of state in economies of developing countries. So, the experts of London School of Economics and Political Science stress that successful operation of many state enterprises in Arab
monarchies-oil-exporters (Saudi Arabia, UAE, Oman, Qatar, and Bahrain) is ensured by state capital and state representatives in
managing bodies. It protects from the interference in everyday operation of other structures as the participation of state as such in managing bodies of such enterprises is “technocratically passive.” Such kinds of enterprises are established in form of corporations to comply with the local standards being transparent in their statements compliant with the international standards. The organizational structure of companies does not differ from large private companies of developed countries.
For instance, such state-controlled enterprises as air company Emiratesare owned by the state via Investment Corporation of Dubai holding being one of the three largest holding structures of that emirate managing companies based on non-intervention principle. Investment Corporation of Dubai is a sort of enclave reporting directly to the Court of Dubai Emir. As it is known, Emirates is one of the top companies as per global ratings. Dubai authorities did not establish any board of managers and it is managed by the executive body-board of directors. The general director has recently been the uncle of Dubai Emir employing foreigners as deputies.
There are some other examples of successful state controlled enterprises in Arab monarchies of the gulf, namely Saudi
Arabia Basic Industries Corporation (SABIC) (Saudi Arabia); Etisalat (Emirates Telecommunications Corporation) (UAE), Dubai Aluminum (DUBAL) (Dubai), Qatar Diar Real Estate Company (Qatar). The latter was established in 2005 to develop
infrastructure and construction by Investments department
of Qatar. These enterprises have great market values, Etisalat alone being $22 billion worth. 20 from GCC countries were in the top 100 rating of the Middle East and North Africa (Baldwin-Edwards, 2011).
The quasi-state structure of economy protects national private business from strong competition of the foreign capital. But the
population has some benefits from that: For instance, in Saudi Arabia, where most of 115 profit-making companies in some or other way are controlled by state, over 30% of stock are sold with
guaranteed access of small investors to stock buying, stock brings high dividends. The state sector keeps playing an important part in solving employment issues as well. In Saudi Arabia in late
2000s, over 70% of citizens were occupied in the state sector, in
UAE - over ¾ of working citizens. In other GCC countries, the situation is similar-the state sector employs 84% of citizens in
Kuwait and 86% in Qatar, about 50% in Oman and 35% in Bahrain. Between 2006 and 2012, about 5.1 million jobs were created in the GCC (excluding the United Arab Emirates, for which data are unavailable). About 4.3 million of these jobs were in the private sector, while only 0.8 million jobs were in the state sector. Of the 4.3 million private-sector jobs created, nearly 88% were filled by foreign workers. In the state sector, nearly 85% of the 0.8 million new jobs were filled by nationals (International Monetary Fund, 2014). In Iraq, formal employment-where employees receive a
wage and are entitled to workers’ rights-is largely represented
by the state sector openings (approximately 62% of waged employees). The private sector opportunities are fewer and primarily limited to the oil and security industries (IRFAD, n.d.).
It is impossible to re-orient employment to the private sector due to known reasons. In connection with the role of state, the opinion expressed in the OECD research is important, stating that in those Arab countries the business communities are not interested in overall enhancement of free market and approve the existing system of state participation in the economy which may be called “ruling of minority for majority” with partial limitation of market
economy growth and control over it (OECD, 2012).
The level of wages in the private sector of the countries studied was rather lower than in the state sector. So, in Saudi Arabia
average monthly wage in the private sector was $1400-1500 and in the state sector $2300, in the UAE - $1250-1300 in the private sector and nearly $4500 in the state sector (International Monetary Fund, 2014).
4. DISCUSSION
The global financial and economic crisis of 2008-2009 sharpened the social stability issues, unemployment rose to 8-10% in the USA
and the UK, over 21% in Greece, 25% in Spain only as per the
official data. For Arab countries, this problem is even more acute
taking into account the danger of spreading of Islamic extremism which uses the social discontent of the population. In Saudi Arabia, about 18% of the youth at the age of 18-24 do not work or study
anywhere while the population of the country in 1975-2013 grew more than 4 times, from 7.3 to 30 million people (including 9.7 million of immigrants).
In the coming years the issues of creating millions of new jobs in Saudi Arabia can hardly be solved via the private sector: For 9 of immigrant workers occupied in it, there is only 1 Saudi Arabian
As to Iraq, the war continues in the country but it is imperative to restore the economy. In Iraq, the level of unemployment among
the youth in 2015 was 25% (Cordesman, and Sakayan, 2015). Within the three last decades of the 20th century as a result of nationalization of foreign property and limitation of national private capital the state sector became playing a key part in modernization of the core sectors of Iraq’s economy. Terrorism and the occupation of part of its area by Islamic state terrorist organization undermine the restoration of the economy and oil and
gas sector of Iraq. Only in 2003-2006, the cost of war amounts to a cut of at least 40% in Iraq’s national income (Bernasek, 2006).
As per the assessment of the Iraq government, Iran-Iraq war, the
Kuwait military conflict, sanctions and blockade brought some $230 billion of losses.
Saddam Hussein’s regime for a long-term was suppressing the
development of oil and gas sector in Iraq; after his overthrow, the sanctions against Iraq were cancelled in 2010. With the beginning
of market reforms, the role of the state sector in Iraq’s economy did not decrease, but the restrictions in connection with operation of private and foreign capital were gradually removed.
Iraq has a state-dominated economy. Almost all oil revenues from foreign and domestic sales of the Iraqi oil sector accrue to the government. The non-oil economy is only affected by government allocation of the oil revenues. Through its control over the oil
sector, the government influences all economic activity in the
country. The role of the private sector is secondary and minor.
In Iraq, SOEs are represented by a large variety of public entities. SOEs are structured in various holdings, regional branches and factories. There are 177 SOEs, distributed among ministries, with the Ministry of Industry and Minerals holding the largest
share (67), followed by oil (16), finance (13), and construction and housing (11) ministries. Employment by SOEs, according to federal budget act of 2010, stands at around 633,000, twice as much as recorded in 2005. Employees in Iraq SOEs make up about 20% of total public employment.
Among the purposes of economic development specified in
National Development Plan 2013-2017 of Iraq are the following:
To raise the GDP growth rate over the duration of the plan by an
annual average of 13.31% at fixed 2012 prices; to develop non-oil economic activities at an annual growth rate of 7.5%; to develop crude oil activity at an average growth rate of 18.7%; to keep inflation rates in single digits; to give a strong investment impetus to selected sectoral growth poles (industry, energy, agriculture, tourism) to raise their share of GDP generation to more than 60%
of GDP in constant prices. Oil production in Iraq is planned to
be increased from 3705 thousand barrels/day in 2013 to 9485 in 2017 and export from 2,900,000 barrels/day to 6000 (Republic of Iraq. National Development Plan 2013-2017, 2013).
In Iraq, 97% of government revenues are based on oil sales and tax. It is more than in GCC states due to damages to Iraqi economy
(Cordesman, and Sakayan, 2015). In IEA’s review of the Iraq
energy sector, some parameters of large oil projects in Iraq and
other oil-exporting countries are given (Table 1). As we opine,
the economy of scale in that sphere is successfully combined with the opportunity for large state companies to operate and
to accumulate the basic incomes from oil in national financial
funds. In general, different portfolio holding companies can be
established, separating, for example, industrial and financial SOEs,
or SOEs in the sphere of utilities or construction.
The problems undermining the restoration of oil and gas sector of Iraq are planned to be solved by the government via the development of national oil companies along with attracting foreign investors.
Finally, for balanced economic development of transition developing economies of special significance is gross fixed capital formation, including capital investments in economic infrastructure. But in all GCC countries and Iraq, prior to the introduction of state development programs and plans in
1960-1970s there were no targeted financial investments in
infrastructure and non-oil sectors. The reason was Dutch disease causing a decline of all the spheres of economic activity except for oil production, as well known from the history of the gulf’s monarchies.
Therefore, state participation in economies of the countries considered became the basis for comprehensive development of various sectors of national economies. In the GCC countries, the state remains “the engine of economic development. So, during
the latest oil boom when oil price grew from about $30 per barrel in 2003 to a sustained peak of about $110 per barrel in 2011-2013 before dropping back in 2014, the GDP of Saudi Arabia doubled, reserve assets reached $732 billion, the equivalent of almost 100% of GDP in 2014. The Saudi economy moved up from being the
27th largest in the world in 2003 to become the 19th largest in 2014.
In 2004-2013, as per the Central Department of Statistics and
Information, Saudi Ministry of Economy and Planning, there was a growth of Saudi household income by 75%, but it was ensured as follows: By 12% due to the state sector, almost by 82% due to social transfers, the private sector accounting for <1%. The
diversification of economic sectors actively continued, and oil chemistry became one of the most important processing (non-oil) sectors which in 2003-2013 showed average growth rate of 10%. The export of oil chemical products of Saudi Arabia grew during that period from $11 to $38 billion. SABIC, which is 70% state-owned, in 2014 earned the revenue of almost $50 billion and was the fifth largest chemicals company in the world, although it dropped from the third place in previous year. In 2013, about
one-third of the total value of the national stock market accounted
for publicly listed state-owned companies” (Al-Kibsi et al., 2015).
Although, there are different views of mutual relations of state expenditures and economic growth rates, many papers proved that there is an interconnection of capital investments and growth.
Alexiou (2009) notes that Ghura (1995), using pooled time-series
and cross-section data for 33 countries in Sub-Saharan Africa for
1970-1990 produced evidence that points towards the existence
ratios, higher export volume growth, higher life expectancy at
birth, lower inflation rates.
Kelly (1997) by exploring the effects of public expenditures on growth among 73 countries over the period 1970-1989 found that
according to the evidence obtained the contributions of public
investment and social expenditures to growth is rather significant (Alexiou, 2009).
The researcher of oil-exporting countries of the Gulf M. Hvidt notes: “SOE and organizations are capable of providing productive investments over a broad range of economic activities. If they invest in and operate tourism facilities, manufacturing industries, harbors, etc., they can no doubt provide a push towards creating a non-oil economy, non-oil exports and non-oil revenue sources”
(Hvidt, 2013).
In Arab oil-exporting monarchies the role in investments is still important. This is acknowledged at least by the data of the said
research by McKinsey Global Institute (Figure 1 and Table 2).
Full potential scenario means that total government investment
over 2016-2030 set in order to maintain government share of
total investment over the period at 42%, the same as during
the 2003-2013 period. 50% of the stimulus is allocated to 2016-2020 period, 30% to 2021-2025, and 20% to 2026-2030 (Saudi Arabia - Manufacturing. Manufacturing, Value Added, n.d.).
As it is seen, the contribution in 2000-2010 of the non-oil state sector was 37%, of the oil sector (being actually state) - 49%,
the private being only 14%. As prognosticated by the Central Department of Statistics and Information, Saudi Ministry of Economy and Planning, and McKinsey Global Institute, the current
determining role of the state investments in Saudi Arabia (51% in 2011-2015) may grow more (up to 81% in 2016-2020) within the
governmental strategy seeking to prepare the conditions to move the center of gravity to investments in the private sector after
2020. The Saudi economy needs massive investment if it is to
thrive and grow to its full potential. Much of this investment has historically come from the government, and in the short-term it will likely continue to do so. In a full potential scenario, it would
be beneficial for the government to overinvest in the early years
of the transformation, with the aim of kick-starting the changes and attracting other investors, as well as delivering new sources of revenue.
In oil-producing monarchies of the gulf, slower government spending growth is likely to be associated with slower non-oil sector real GDP growth. So, it was estimated that in Saudi Arabia, the correlation between real government spending and non-oil
real GDP growth is 0.42 in 1992-2013 (Institute of International Finance, 2014).
However, we opine that activating the role of the private sector
in closing the investments gap after 2020 will depend both on the
Kingdom’s success in creating advanced economic infrastructure and foreign economic conditions.
National Development Plan 2013-2017 of the Republic of Iraq
noted in the analysis of economy in previous years, that the state
sector played the role of the biggest investor during 2009-2010. It had the distinct role in fixed capital formation which increased its contribution from 93.2% in 2009 to 96.3% in 2010. The oil
sector’s continuation to hold its position as a developmental
pole and main source of hard currency and investment financing
explains the central and distinct role of the state sector. The private
sector contribution to fixed capital formation decreased from
Figure 1: Contributions to nominal gross domestic product growth
of main economy sectors in Saudi Arabia in 2000-2010 (%) (Al-Kibsi et al., 2015)
Table 1: Indicative oil development and production costs in selected countries
Country Type of project Scale of
project (mb/d) of capacity ($2011/bbl)*Capital cost per barrel Operating cost ($2011/bbl)**
Iraq Expansion super giant (South) 1.00 7000-12,000 2
New super-giant (south) 1.00 10,000-15,000 2
Mid-size (north) 0.25 15,000-20,000 2-3 Saudi Arabia Generic expansion 0.50 15,000 2-3 Brazil Deep water pre-salt 0.25 70,000-80,000 15-20
Kazakhstan North Caspian offshore 0.25 70,000-80,000 15-20
Canada Canadian oil sands with upgrading 0.25 100,000-120,000 15-20
*Capital cost per barrel of plateau rate production capacity (International Energy Agency, 2012), **Operating cost (International Energy Agency, 2012)
Table 2: Real total investment needs in Saudi Arabia, 2015-2030, full potential scenario $ billion; %, constant 2013 prices
Indicators 2006-2010 2001-2015 2016-2020 2021-2025 2026-2030
$ billion 768 934 900 1300 2000
6.8% in 2009 to 3.7% in 2010. Planned and actual fixed capital formation for 2010 at current prices in Iraq were 23.4 and 23.2 IQD trillions for the state sector and 20.1 and 1.6 IQD trillion for the private sector (Republic of Iraq. National Development Plan 2013-2017, 2013).
It should be noted that during the crisis period state investments in monarchies of the Gulf play invaluable role to prevent sharp stagnation of the non-oil, including private, economic sector, due to the following financial tools: Government contracts and purchasing agreements for many private-sector companies depending on it, investments in capital of projects, state deposits to support banks, etc. Banks were supported during the global
financial crisis. Large capital outflows from the GCC countries began in March 2008 when investors, who bet on an appreciation
of the currencies of the GCC, revised their stance. Central banks reacted swiftly by injecting funds and providing credit facilities to maintain the liquidity of the banking sector, and also cut interest rates and reduced reserve requirements in an attempt to
ease funding pressure. The United Arab Emirates was the first
GCC country to provide guarantees for bank deposits and offer a
credit facility of UAE dirham 50 billion in October 2008, which was supplemented by a government deposit of UAE dirham 70
billion in banks. The Saudi Arabian Monetary Authority reduced reserve requirements on current account from 13% to 7%, lowered
the repurchase rate by 150 basis points, and made US $36 billion available to local banks (Economic and Social Commission for Western Asia, 2009).
In total, state investments in all the GCC countries in 2004-2011 grew from US $22 to 118 trillion; in 2012 they were assessed at US $112 trillion (Qatar National Bank, 2013). Besides, the
governments of those countries widely apply the schemes of
public-private partnership (build operate transfer and other),
which we do not cover on here. It is important that great capital investments are sent by the Gulf monarchies into non-oil production sectors. Despite the relative decline of the processing sector in average in the global GDP, for developing countries it is still crucial. UNCTAD documents noted that in
all new industrial countries of the first generation except for Hong Kong (China) within the two latest decade the growth
of value added in the processing sector was not falling behind and sometimes was ahead of the growth of import and export
of industrial products (United Nations Conference on Trade and Development, 2002).
As exemplified by Saudi Arabia and the UAE, positive was great
growth of the processing sector’s absolute output, although its share
failed to exceed 10% of GDP benchmark in a sustainable way.
The growth rates of the processing sector in those countries were rather high, in Saudi Arabia in market prices they reached over
10% which relates to the scale of industrialization. The instability of manufacturing growth rate is linked with the fluctuations of state
funding of economies due to oil prices and getting oil chemistry as a most important manufacturing sector connected to the global market, etc. For the UAE having smaller economy compared to Saudi Arabia - The largest Arab economy by GDP - the connection
of manufacturing with the global market could have more effect
(Tables 3 and 4).
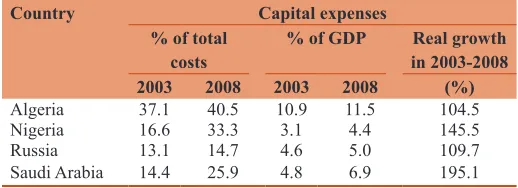
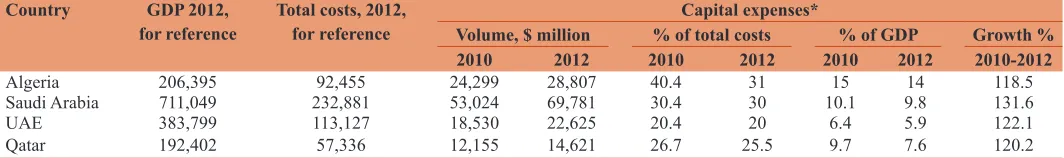
If we see the data on capital expenses in Saudi Arabia in 2003-2008 and in Saudi Arabia and the UAE in 2010-2012, compared to other oil-exporters (Tables 5 and 6), correlating them with the
previous Table 4, it may be concluded in certain correlation of capital expenses with high growth rates of manufacturing, surely,
accounting for other factors (first, oil prices). In 2003-2012, the
growth rates of the processing sector in Saudi Arabia varied from
4.07% to 13.56%, in the UAE from - 14.05% to 10.27%, but negative growth was only in 2009 during the global crisis which
much affected Dubai and the UAE.
During the latest slumping of oil prices in 2014-2016, Arab oil-exporting countries had to review the financial policy maintaining
the economic role of the state. So, in Saudi Arabia the draft budget
for 2016 did not provide for any turning point in the ratio of current
and capital expenses. However, the budget item “infrastructure and transport” alone suffered the most serious sequester - by
63% to US $6.4 billion. At the background of Kingdom’s plans to rationalize finance and stimulate non-oil sources for growth,
Table 4: Saudi Arabia; the UAE manufacturing value added (annual % growth)
Saudi Arabia, 2002-2014 UAE, 2002-2014
2002 3.47 2002 2.90
2003 7.12 2003 4.29
2004 13.56 2004 7.92
2005 7.63 2005 6.57
2006 10.13 2006 7.26
2007 10.55 2007 1.87
2008 10.48 2008 10.27
2009 2.61 2009 −14.05
2010 10.13 2010 2.63
2011 8.90 2011 9.70
2012 4.07 2012 5.59
2013 3.37 2013 1.19
2014 7.83 2014 3.16
For annual % growth aggregates are based on constant 2005 U.S. dollars. Source: Index Mundi (Saudi Arabia - Manufacturing. Manufacturing, Value Added, n.d.)
Table 3: Saudi Arabia; the UAE manufacturing value added (current US$ million)
Country 1970 1980 1990 2000 2010 2014
Saudi Arabia 443 6737 10,049 18,210 58,178 81,019
The UAE n.a. 1625 3799 9465 25,744 36,030
Table 5: Capital expenses in some other oil-exporting countries
Country Capital expenses
% of total
costs % of GDP in 2003-2008Real growth
2003 2008 2003 2008 (%)
Algeria 37.1 40.5 10.9 11.5 104.5
Nigeria 16.6 33.3 3.1 4.4 145.5 Russia 13.1 14.7 4.6 5.0 109.7
Saudi Arabia 14.4 25.9 4.8 6.9 195.1
For 2008, the data as assessed by the IMF. Source: (European Central Bank, 2009).
in the relative portion, expenses on items like “healthcare and
social development” did not lose significance (35%). The planned expenses for education and professional training in 2016 are 23%,
for infrastructure and transport-just 3%, defense - 25%, economic
resources - 9%, public administration - 3% (Al-Nakib, 2016).
These problems were manifested in the growth rates of Saudi economy, and GDP in the 1st quarter of 2016 grew only by 1.5%
(the lowest level within the recent 5 years), oil sector grew by 5.1%, non-oil by 0.7% (Holodny, 2016).
In the UAE, as oil prices dropped to below $30, Abu Dhabi has
taken measures to reduce expenditure by deregulating fuel prices and increasing utility prices. Abu Dhabi Investment Authority’s assets may probably shrink by billions of dollars from an estimated
$502 billion at the end of 2014 as the emirate’s government taps its sovereign-wealth fund to bridge a deficit. Experts expected the emirate to issue 40 billion dirhams (US $11 billion) of bonds in the local market in 2016 and 60 billion dirhams in 2017 to finance deficit, which was prognosticated in 2016 with the deficiency over 7.2% of GDP (Habboush, 2016). Also, estimate was that overall
consolidated UAE spending will fall by another 6.5% this year
(having dropped by near 5% in 2015). Overall projected non-oil
sector real growth for UAE remained positive at 2.2%, albeit
down on the estimated 3.5% in 2015. And overall GDP growth was similarly projected to slow to just fewer than 2% (Samba Financial Group, 2016).
5. CONCLUSION
The issues considered evidence that state regulation of economy
in Arab oil-exporting countries is, first of all, required forming
and developing the core economic sectors. Such regulation here may not be done without redistribution under the governmental
influence of the revenues of various economic sectors as well as without state participation in projects and enterprises (production,
infrastructure, including transport, energy, water supply,
telecommunications, etc.).
In principle, such model of economic development was used in
other developing countries (South Korea, China). But in Arab
oil-exporting countries this model of development almost fully depends on the rent nature of economy. Under the oil price
slumping conditions the fact is revealed that diversification of
economy with state participation in those countries was not fully successful as excess employment in the state sector of the local population and dependency of its incomes on the state sector,
insufficient specific share of manufacturing in GDP, insufficient demand on services (as exemplified by Dubai), falling growth
rates of non-oil sectors under the conditions of slumping foreign
trade (oil prices).
The above does not mean that the state strategy to maintain great share of capital investments in the economy in those countries should be weakened. But its centers of gravity should be changed in such a way to earn the national income mostly in stably
operating sectors regardless from the oil rent (manufacturing and all innovative sectors, and partly services).
Whether these Arab countries are able to make such a maneuver
(moreover, located in hard climatic and natural conditions) will
depend, on the one hand, on exogenous factors of foreign trade
(prices and demand on oil and oil chemicals), on the other hand,
on the commitment of those Arab countries in speeding-up the implementation of the strategy for changing the sectoral structure of their economies.
It tells about the beginning of a new, more comprehensive stage of state participation in economies of the analyzed countries. That concerns Iraq as well, although Iraq needs to ensure political stability, maximally increase oil production and spend oil export revenues on restoration of the economy.
REFERENCES
Alexiou, C. (2009), Government spending and economic growth: Econometric evidence from the South Eastern Europe (SEE). Journal of Economic and Social Research, 11(1), 2-4.
Al-Farsy, F. (1990), The Saudi equation. Modernity and Tradition. London, New York: Kegan Paul International. p101.
Al-Kibsi, G., Woetzel, J., Isherwood, T., Khan, J., Mischke, J., Noura, H.
(2015), Saudi Arabia Beyond. The Investment and Productivity Transformation. Available from: http://www.mckinsey.com/global-
themes/employment-and-grow/moving-saudi-arabias-econmy-beyond-oil. McKinsey Global Institute. p21.
Al-Nakib, O. (2016), Public Finance Saudi Arabia: 2016 Budget Targets.
Spending Cuts, Subsidy Reforms and Non-Oil Sector Investment. National Bank of Kuwait.
Baldwin-Edwards, M. (2011), Labor management and labor markets in the
GCC countries: National patterns and trends. In: Kuwait Programme on Development, Governance and Globalization in the Gulf States. Vol. 15. London: LSE Global Governance. p83-84.
Bernasek, A. (2006), Economic View: War Cut Iraq’s National Income 40%. The New York Times. Available from: http://www.nytimes. com/2006/10/24/business/worldbusiness/24iht-iraqcon.3267268. html?_r=0. [Last retrieved on 2016 Aug 28].
Cordesman, A.H., Sakayan, M. (2015), War and the Iraqi Economy: An
Experimental Case Study. Washington: Center for Strategic and International Studies. p98.
Table 6: Capital expenses in Saudi Arabia and the UAE in 2010-2012 (compared to some other oil-exporting countries)
Country GDP 2012,
for reference Total costs, 2012, for reference Volume, $ million % of total costsCapital expenses* % of GDP Growth %
2010 2012 2010 2012 2010 2012 2010-2012
Algeria 206,395 92,455 24,299 28,807 40.4 31 15 14 118.5 Saudi Arabia 711,049 232,881 53,024 69,781 30.4 30 10.1 9.8 131.6 UAE 383,799 113,127 18,530 22,625 20.4 20 6.4 5.9 122.1
Qatar 192,402 57,336 12,155 14,621 26.7 25.5 9.7 7.6 120.2
Economic and Social Commission for Western Asia. (2009), The Impact
of the Financial Crisis on ESCWA Member Countries: Challenges and Opportunities. Beirut: ESCWA.
Employment and Unemployment in GCC. (2012), GIS Monthly Economic
Review. GISMER.
European Central Bank. (2009), Occasional Paper Series, 104. p26. Ghura, D. (1995), Macro policies, external forces, and economic growth
in Sub-Saharan Africa. Economic Development and Cultural Change,
43(4), 759-78.
Habboush, M. (2016), Abu Dhabi to Take Billions From ADIA for Debt, Fitch Says. Available from: http://www.bloomberg.com/news/ articles/2016-02-02/abu-dhabi-to-siphon-billions-from-adia-for-debt-fitch-predicts. [Last retrieved on 2016 Aug 28].
Holodny, E. (2016), A Bunch of Ugly Warning Signs are Bubbling up in Saudi Arabia. Business Insider. Available from: http:// www.businessinsider.com/saudi-arabia-non-oil-private-sector-growth-2016-7. [Last retrieved on 2016 Aug 28].
Hvidt, M. (2013), Economic diversification in GCC countries: Past
record and future trends. In: Kuwait Programme on Development, Governance and Globalization in the Gulf States. Vol. 27. London, UK: The London School of Economics and Political Science. p7.
IRFAD. (n.d.), Iraq Labor Force. Irfad. Available from: http://www.irfad. org/iraq-labor-force/. [Last retrieved on 2016 Aug 28].
Institute of International Finance. (2014), GCC: Strong Diversified
Growth, Limited Risks. Washington: ILO.
International Monetary Fund. (2014), Labor Market Reforms to
Boost Employment and Productivity in the GCC – An Update.
Kuwait City. Available from: https://www.imf.org/external/np/pp/ eng/2014/102514a.pdf. [Last retrieved on 2016 Aug 28].
International Energy Agency. (2012), Iraq Energy Outlook. World Energy
Outlook Special Report. Paris: IEA Publications.
Joint Arab Economic Report. (2013), Arab Fund Economic & Social
development. Available from: http://www.arabfund.org/default. aspx?pageId=212. [Last retrieved on 2016 Aug 28].
Kelly, T. (1997), Public expenditures and growth. Journal of Development Studies, 34, 60-84.
Nadal De Simone, F., Sorsa, P. (1999), A Review of Capital Account Restrictions in Chile in the 1990s. IMF Working Paper WP/99/52. Available from: https://www.imf.org/external/pubs/ft/wp/1999/ wp9952.pdf. [Last retrieved on 2016 Aug 28].
OECD. (2012), Towards New Arrangements for State Ownership in the
Middle East and North Africa. Paris: OECD Publishing.
Qatar National Bank. (2013), GCC Capital Expenditure Expected to Rise in 2014. Available from: http://www.qnb.com.qa/cs/Satellite?c=QN BNews_C&cid=1355401719462&locale=1344242931463&p=134 4242934610&pagename=QNBSwitzerland%2FQNBLayout. [Last retrieved on 2016 Aug 28].
Republic of Iraq. National Development Plan 2013-2017. (2013).
Baghdad: Ministry of Planning.
Saudi Arabia – Manufacturing. Manufacturing, Value Added. (n.d.), Available from: http://www.indexmundi.com/facts/saudi-arabia/ manufacturing. [Last retrieved on 2016 Aug 28].
Samba Financial Group. (2016), UAE: Update 2016. Riyadh, Saudi
Arabia: Samba Financial Group.
United Arab Emirates – Manufacturing. Manufacturing, Value Added.
(n.d.), Available from: http://www.indexmundi.com/facts/united-arab-emirates/manufacturing. [Last retrieved on 2016 Aug 28]. United Nations Conference on Trade and Development. (2002), Report
on Trade and Development. New York, Geneva. Available from:
http://www.unctad.org/ru/docs/tdr2002_ru.pdf. [Last retrieved on 2016 Aug 28].
Van der Hoeven, R. (2010), Labour Market Trends, Financial
Globalization and the Current Crisis in Developing Countries. DESA