Issues
ISSN: 2146-4138
available at http: www.econjournals.com
International Journal of Economics and Financial Issues, 2017, 7(2), 706-713.
Data Envelopment Analysis and Tobit Analysis for Firm
Efficiency in Perspective of Working Capital Management in
Manufacturing Sector of Pakistan
Muhammad Fawad Ahmad
1, Muhammad Ishtiaq
2, Kashif Hamid
3*, Muhammad Usman Khurram
4,
Ali Nawaz
51Department of Business Administration, G.C University, Faisalabad, Pakistan, 2Department of Business Administration,
G.C University, Faisalabad, Pakistan, 3Institute of Business Management Sciences, University of Agriculture, Faisalabad, Pakistan, 4LSCS, University of Agriculture, Faisalabad, Pakistan, 5Department of Business Administration, G.C University, Faisalabad, Pakistan. *Email: [email protected]
ABSTRACT
This research is performed for dealing with some of the important working capital management policies and efficiency regarding to manufacturing sector of Pakistan. For this purpose data from 37 firms have been taken for the period 2009-2014. Data envelopment analysis (DEA) and Tobit regression analysis has been performed to achieve the objective of this study. DEA results indicate that only fifteen companies require increase in inputs to attain better output whereas six companies require decrease in the input. However sixteen companies have to consistent with their existing proportionate of inputs to sustain the output maximization. Tobit regression analysis concludes that average collection period has significant negative impact on efficiency and current ratio, gross working capital turnover ratio and financial leverage ratio have positive significant impact on efficiency.
Keywords: Working Capital Management, Efficiency, Data Envelope Analysis, Tobit Analysis, Manufacturing Sector
JEL Classifications: C8, G3
1. INTRODUCTION
Inefficient and ineffective financial management harm business profitability and value of the firm. In order to raise shareholder value, corporate strategy should include efficient management of working capital management (Nazir and Afza, 2009) as well. Moreover, efficient management of working capital contributes
to improve operational performance of the business and helps the
business to meet its short term liabilities effectively (Paramasivan and Subramanian, 2009). Therefore, business tries to attain an optimum
level of working capital that increases business value. Effective management of working capital is the most important for the business
because it directly affects the profitability and liquidity of a business (Deloof, 2003). In current scenario, competition between firms is
forcing them to utilize their diverse methods in order to enhance their productivity and to reduce their expenses in order to make them competitive and to maintain their sustainability in competition.
In recent years, performance has been optimized by many of the
manufacturing firms and that’s why cost pressure has increased. In enhancing the performance of firms, the most important issue to be
considered is to determine the reasons of precedence and debility.
Analysis and comparison of firms and to determine precedence and debility is the biggest challenge for the firm managers (Tseng, 2009). Imply, working capital management doesn’t mean only financial performance improvement in today’s broke and changeable economy, but also means to ask for day to day operations of the firm. So it is
important to understand the impact of working capital management
on firm efficiency. Also; many researchers have done a lot of work on finding the connection and impact of working capital management on performance of firm using different techniques and methods, but no work is done for the impact of working capital management on firm efficiency for listed manufacturing companies in emerging economy of Pakistan using the technique of data envelopment analysis (DEA)
evidence along with working capital management invite for research
on impact of working capital management on firm performance in
Pakistani context.
This study focused on working capital management and
non-financial enterprises in Pakistan profitability kind of impact.
Existing literature and references on working capital management of different sectors lacks the empirical evidence and DEA and Tobit analysis is used for a sample of Pakistani listed companies. The objective of managing working capital is just to assure the
relationship that is carried out, is because of the consequence of firm’s efficiency on working capital management.
The results of this study may implicate other companies who are attempting to take some positive decision concerning working capital management. A simple conceptual framework will render some guidelines for managers, directors, investors, accountants and
professionals of manufacturing firms. Study findings will further
help examine the effectiveness of management of working capital
in the considered manufacturing firms for program valuation.
2. LITERATURE REVIEW
Relative efficiency of the companies is the primary focus to be calculated and for which the technique of DEA is used and the benchmarked base is the manufacturing companies (Yue, 1992; Ayadi et al., 1998; Casu and Molyneux, 2003). The scores of benchmarked base always stays in between 1 and 0 (Das and Ghosh, 2006; Banker et al., 2010). If the score is 1, it shows that the company is fully efficient and if the score is 0, it shows that the company is working on its worst efficiency (Miller and Noulas, 1996). DEA uses two types of preferences; input and output of the company (Yue, 1992; Grigorian and Manole, 2002; Coelli et al., 2005; Kao et al., 2011; Fernando and Nimal, 2014). The DEA model which is input
oriented focuses on decrease in input with the use of given output. Whereas DEA model which is output oriented, focuses only on
increase in output with the use of given input (Coelli et al., 2005). In order to carry out the DEA, two kinds of assumption are made; constant return to scale (CRS) and variable return to scale (VRS) (Avkiran, 1999; Coelli et al., 2005). Charnes et al. (1978) firstly used this input oriented DEA model and evaluated the efficiency of decision making units (DMUs) using constant return to sales
assumption. Production function has a feature, names as CRS and is demonstrated when a positive variation in input causes the same positive variation in output. Nevertheless, DMUs have increasing or decreasing value of return to scale in VRS. Afterwards, Banker
et al. (1984) presented BCC model and calculated efficiency with the use of VRS. This BCC model gives greater efficiency or equal efficiency values as compared to the CRS both CRS and VRS
models are given bellow with detail.
Abokaresh and Kamaruddin (2011) evaluated efficiency effect of Libyan manufacturing firms before and after their privatization from the year 2000 to 2008. In their study, technical efficiency calculated from the data. Average value of efficiency before privatization was 49.5% of all the firms, where, it becomes 62.3% after their privatization, which showed only 15.3% change after their privatization. It showed no any significant change.
Zhou et al. (2011) considered the same technology on large sized and medium sized firms, taken from thirty provinces, using CRS and VRS both, for the period from 2006 to 2008. They found a decreasing trend in three years; they also found that year 2006 was the most efficient with 23.3% efficient companies. Actually it was
observed that the data had decreasing return to scale throughout the whole years.
Whereas (Hsiao et al., 2010; Kao et al., 2011; Barth et al., 2013; Jha et al., 2013; Lee and Chih, 2013) used TOBIT analysis to analyze the efficiency of the determinants of the working capital
management.
2.1. Research Hypothesis
H1: Inputs are major determinants of firm efficiency.
H2: Efficiency of outputs is based upon efficiency of the inputs.
H3: ACP has negative impact on firm efficiency.
H4: Current ratio (CR) has negative impact on the firm efficiency.
H5: Gross working capital turnover ratio (GWCTR) has positive impact on the firm efficiency.
H6: Sales growth (SG) has positive impact on firm efficiency.
H7: Financial leverage ratio (FLR) has positive impact on firm efficiency.
3. DATA AND METHOD
3.1. Sample DataOur sample contains 37 manufacturing companies working in Pakistan. Panel data is taken for the period 2009-2014.
3.2. Variable Proxies
As stated above, dependent variable (efficiency) and independent variables (proxies of working capital management) are calculated by the available financial statement’s data published by the State Bank of
Pakistan. For this purpose, following ratios and particulars are used:
(1) Total sales of firms, (2) total profit after taxes, (3) total assets, (4) cost of sales and (5) total selling and administration expenses and cost, (6) average collection period (ACP), (7) GWCTR, (8) SG, (9) credit ratio and (10) financial debt ratio.
Now all the ratios and particulars of balance sheets mentioned above are given in detail along with the calculation methods and formulas.
Variables Computation Assets turnover ratio (Net sales/total assets)
Average collection period (Net sales/account receivables)×360
Gross working to capital
turnover ratio (Sales/average working capital) Sales growth (Current month’s sales−Previous
year’s sales)/previous year’s sales
Current ratio Current assets/current liabilities
3.3. DEA 3.3.1. CRS model
Considering the investigation of Coelli et al. (2005), an assumption
is made with reference to the input oriented DEA model that there are B companies, from which each has P inputs which are producing Q outputs. Input matrix is denoted by X for all companies selected and it is calculated by Q x C in the same way,
output matrix is denoted by Y and it can be calculated by Q x C.
For nth company, X
n shows the input column vector of nth company.
Similarly, Yn shows the output column vector of nth company. In
accordance with Charnes et al. (1978), nth company efficiency is
calculated with maximizing the proportion of weighted output
and weighted input like U′Yn/V′Xn. Where U shows Q*1 output
weighted vector and V shows P*1 input weighted vector and
U′ shows the output weighted transpose and V′ shows input
weighted transpose considering the situation that the companies
have ratios equals to 1 or less than 1. Optimum weights can be
calculated by the following formula for nth companies:
Maxu,v (U′Yn/V′Xn) (1)
Where,
(U′Ys/V′Xs) ≤ 1 s = 1, 2, 3,…, C U, V ≥ 0
Objective of the mentioned linear programming technique is to
evaluate the efficiency of nth companies by calculating U and
V values with an assumption that the companies have equal or <1 value of efficiency. The issue with the ratio formation is that
U and V has been provided nth vales. In order to solve this problem,
the V′Xn = 1 is applied, which gives:
Maxu,v (U′Yn) (2)
Where,
V′Xn = 1 s = 1, 2, 3., C
U′Ys−V′Xs ≤ 0 U, V ≥ 0
The mentioned problem is DEA multiplier. Same variables are
considered for this multiplier which is used in earlier model (1).
The problem, which is input oriented, is evaluated with the application of duality theorem in the context of linear programming.
Minλ,θ (θ) (3)
Where,
Yλ ≥ Yn
θXn−Xλ ≥ 0
λ ≥ 0
In the above mentioned equation, λ is the column matrix which
has an order B*1 and it has only the constant vector. This type is more recommended because it has less constraints as compared to the original model. For the purpose of evaluating the value
of efficiency of each company, the above mentioned problem is figured out B times.
DEA which is output oriented can be derived as:
Maxλ,ф(ф) (4)
Where,
Yλ ≥ фYn
Xn−Xλ ≥ 0
λ ≥ 0
The sign of ф denotes scalar and shows efficiency vale of nth
companies. Remaining variables will remain same as those were
explained in previous problem (3).
3.4. Tobit Regression Analysis
In this study, Tobit regression analysis is also being used to measure
the relationship between the working capital management and firm efficiency of the listed manufacturing companies of Pakistan,
since we have mentioned in earlier chapter that we are using
Tobit Regression Analysis instead of OLS Regression because of censored dependent variable of Efficiency of firms (Hsiao et al., 2010; Kao et al., 2011; Barth et al., 2013; Jha et al., 2013; Lee and Chih, 2013a; 2013b). Tobit Regression model, which is used
to measure the relationship of working capital management and
firm efficiency, is mentioned below.
Firm EFFnt = β0+β1 ACPnt+β2 GWCTRnt+β3 SGnt
+β4 CRnt+β5 FDRnt+ent (5)
Where,
Firm_EFFnt = Efficiency of nth firm at time t
β0 = Constant
ACPnt = Average collection period of nth firm at time t
GWCTRnt = Gross working capital turnover ratio of nth firm at time t
SGnt = Sale growth of nth firm at time t
CRnt = Current ratio of nth firm at time t
FDRnt = Financial debt ratio of nth firm at time t
ent = Error term of nth firm at time t
β1, β2, β3, β4 and β5 are the coefficients which are measured by the use of Tobit regression Analysis. Firstly, the efficiency of the
companies is calculated which is the dependent variable. This
efficiency is basically having a range of values and the range is 1 and 0. The value of efficiency always lies in between 1 and 0 (Das
and Ghosh, 2006; Banker et al., 2010). For nth companies, Tobit
analysis can be explained with following mathematical expressions:
Yn* = βXn+μn (6)
Where,
Yn = Yn* and
Yn* ≥ 0 otherwise Yn* ≤ 1
β is the set of parameters which is being measured and Xn shows
the variable which is to be explained. Error is shown by μn
latent variable is shown by Yn*. Yn shows the efficiency of nth
company. Firstly, this study has taken DEA program to measure
the efficiency of companies. Than we used Statistical Package
independent variable (which is working capital management) and the dependent variable (which is efficiency). Complete detail of
analysis of secondary data is given in next chapter.
4. RESULTS AND DISCUSSION
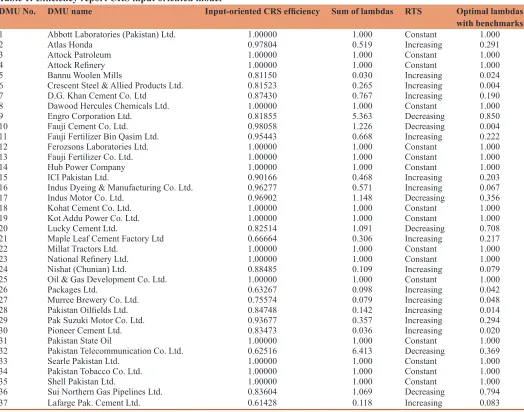
Table 1 indicates that 15 companies require increase in inputs to attain better output whereas 6 companies require decrease in the input. However 16 companies have to consistent with their existing
proportionate of inputs to sustain the output maximization.
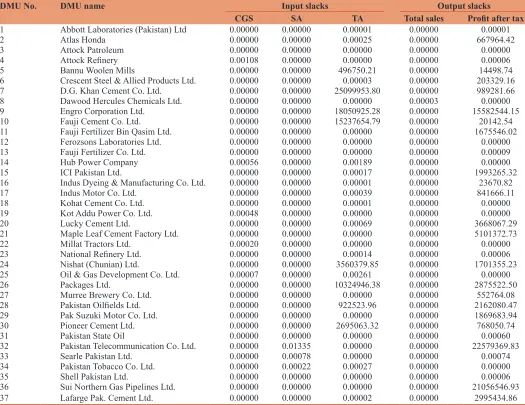
The Table 2 indicates the inputs slack that such element need to rectify either it exists in input elements or in output elements.
However inputs have greater importance for the slack values. It is because we have to redesign the policies for such firms regarding to the said input parameters. Output slack indicates
that the results are not due to only these inputs it may be due to other elements as well.
Table 3 shows the descriptive analysis mean value, maximum and minimum values and standard deviation of the whole data.
Table 3 indicates that total 222 observations were selected for analysis of each variable, which were ACP, GWCTR, SG, CR,
financial debt ratio and efficiency. The results of efficiency
indicate that it has maximum value 6.4837 and minimum
value is 0.0922. The mean value is 1.3847 and the standard deviation is 1.2207 and has positive skewness. The ACP is 39.538 days and the CR is 1.7116 and the average SG is 15.97% of these manufacturing industries. However the average FLR is 49.92%.
Table 4 indicates efficiency is negative related to ACP and CR significantly. It means as ACP and CR will increase efficiency curve fall down. However efficiency has positive correlation with GWCTR and FLR significantly. It indicates that increase in GWCTR and FL will also increase the efficiency in positive
dimension.
The Tobit regression analysis is given in the following Table 5
shows that ACP has significant negative impact on efficiency and CR, GWCTR and FLR have positive significant impact on efficiency.
Table 1: Efficiency report CRS input oriented model
DMU No. DMU name Input‑oriented CRS efficiency Sum of lambdas RTS Optimal lambdas with benchmarks 1 Abbott Laboratories (Pakistan) Ltd. 1.00000 1.000 Constant 1.000
2 Atlas Honda 0.97804 0.519 Increasing 0.291
3 Attock Patroleum 1.00000 1.000 Constant 1.000
4 Attock Refinery 1.00000 1.000 Constant 1.000
5 Bannu Woolen Mills 0.81150 0.030 Increasing 0.024
6 Crescent Steel & Allied Products Ltd. 0.81523 0.265 Increasing 0.004
7 D.G. Khan Cement Co. Ltd 0.87430 0.767 Increasing 0.190
8 Dawood Hercules Chemicals Ltd. 1.00000 1.000 Constant 1.000
9 Engro Corporation Ltd. 0.81855 5.363 Decreasing 0.850
10 Fauji Cement Co. Ltd. 0.98058 1.226 Decreasing 0.004
11 Fauji Fertilizer Bin Qasim Ltd. 0.95443 0.668 Increasing 0.222
12 Ferozsons Laboratories Ltd. 1.00000 1.000 Constant 1.000
13 Fauji Fertilizer Co. Ltd. 1.00000 1.000 Constant 1.000
14 Hub Power Company 1.00000 1.000 Constant 1.000
15 ICI Pakistan Ltd. 0.90166 0.468 Increasing 0.203
16 Indus Dyeing & Manufacturing Co. Ltd. 0.96277 0.571 Increasing 0.067
17 Indus Motor Co. Ltd. 0.96902 1.148 Decreasing 0.356
18 Kohat Cement Co. Ltd. 1.00000 1.000 Constant 1.000 19 Kot Addu Power Co. Ltd. 1.00000 1.000 Constant 1.000
20 Lucky Cement Ltd. 0.82514 1.091 Decreasing 0.708
21 Maple Leaf Cement Factory Ltd 0.66664 0.306 Increasing 0.217
22 Millat Tractors Ltd. 1.00000 1.000 Constant 1.000
23 National Refinery Ltd. 1.00000 1.000 Constant 1.000
24 Nishat (Chunian) Ltd. 0.88485 0.109 Increasing 0.079
25 Oil & Gas Development Co. Ltd. 1.00000 1.000 Constant 1.000
26 Packages Ltd. 0.63267 0.098 Increasing 0.042
27 Murree Brewery Co. Ltd. 0.75574 0.079 Increasing 0.048
28 Pakistan Oilfields Ltd. 0.84748 0.142 Increasing 0.014
29 Pak Suzuki Motor Co. Ltd. 0.93677 0.357 Increasing 0.294
30 Pioneer Cement Ltd. 0.83473 0.036 Increasing 0.020
31 Pakistan State Oil 1.00000 1.000 Constant 1.000
32 Pakistan Telecommunication Co. Ltd. 0.62516 6.413 Decreasing 0.369
33 Searle Pakistan Ltd. 1.00000 1.000 Constant 1.000
34 Pakistan Tobacco Co. Ltd. 1.00000 1.000 Constant 1.000
35 Shell Pakistan Ltd. 1.00000 1.000 Constant 1.000
36 Sui Northern Gas Pipelines Ltd. 0.83604 1.069 Decreasing 0.794
37 Lafarge Pak. Cement Ltd. 0.61428 0.118 Increasing 0.083
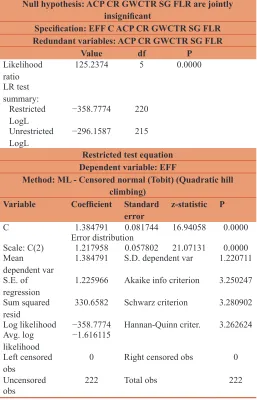
The Table 6 shows null hypothesis is strongly rejected and hence
results indicates that independent variables are jointly significant because P < 0.00001.
Figure 1 indicates the positive skewness in the residuals and
provides the justification for the use of Tobit regression model.
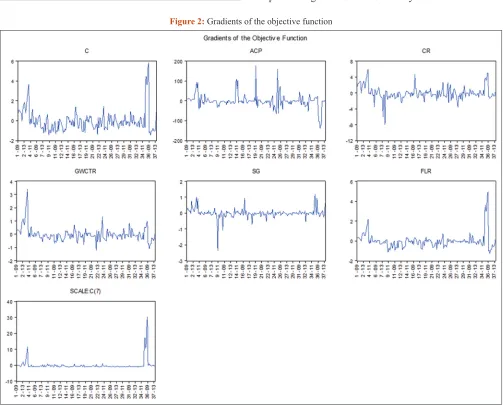
Figure 2 indicates the behavior of whole variables in a given panel
for the year 2009-2014.
Table 7 indicates the null hypothesis is strongly rejected and the Wald test indicates the true value of the parameter as given in our sample of the study.
Table 2: Input and output slacks
DMU No. DMU name Input slacks Output slacks
CGS SA TA Total sales Profit after tax
1 Abbott Laboratories (Pakistan) Ltd 0.00000 0.00000 0.00001 0.00000 0.00001
2 Atlas Honda 0.00000 0.00000 0.00025 0.00000 667964.42
3 Attock Patroleum 0.00000 0.00000 0.00000 0.00000 0.00000
4 Attock Refinery 0.00108 0.00000 0.00000 0.00000 0.00006
5 Bannu Woolen Mills 0.00000 0.00000 496750.21 0.00000 14498.74
6 Crescent Steel & Allied Products Ltd. 0.00000 0.00000 0.00003 0.00000 203329.16
7 D.G. Khan Cement Co. Ltd. 0.00000 0.00000 25099953.80 0.00000 989281.66
8 Dawood Hercules Chemicals Ltd. 0.00000 0.00000 0.00000 0.00003 0.00000 9 Engro Corporation Ltd. 0.00000 0.00000 18050925.28 0.00000 15582544.15
10 Fauji Cement Co. Ltd. 0.00000 0.00000 15237654.79 0.00000 20142.54
11 Fauji Fertilizer Bin Qasim Ltd. 0.00000 0.00000 0.00000 0.00000 1675546.02
12 Ferozsons Laboratories Ltd. 0.00000 0.00000 0.00000 0.00000 0.00000
13 Fauji Fertilizer Co. Ltd. 0.00000 0.00000 0.00000 0.00000 0.00009
14 Hub Power Company 0.00056 0.00000 0.00189 0.00000 0.00000
15 ICI Pakistan Ltd. 0.00000 0.00000 0.00017 0.00000 1993265.32
16 Indus Dyeing & Manufacturing Co. Ltd. 0.00000 0.00000 0.00001 0.00000 23670.82
17 Indus Motor Co. Ltd. 0.00000 0.00000 0.00039 0.00000 841666.11
18 Kohat Cement Co. Ltd. 0.00000 0.00000 0.00001 0.00000 0.00000 19 Kot Addu Power Co. Ltd. 0.00048 0.00000 0.00000 0.00000 0.00000
20 Lucky Cement Ltd. 0.00000 0.00000 0.00069 0.00000 3668067.29
21 Maple Leaf Cement Factory Ltd. 0.00000 0.00000 0.00000 0.00000 5101372.73
22 Millat Tractors Ltd. 0.00020 0.00000 0.00000 0.00000 0.00000
23 National Refinery Ltd. 0.00000 0.00000 0.00014 0.00000 0.00006
24 Nishat (Chunian) Ltd. 0.00000 0.00000 3560379.85 0.00000 1701355.23
25 Oil & Gas Development Co. Ltd. 0.00007 0.00000 0.00261 0.00000 0.00000
26 Packages Ltd. 0.00000 0.00000 10324946.38 0.00000 2875522.50
27 Murree Brewery Co. Ltd. 0.00000 0.00000 0.00000 0.00000 552764.08
28 Pakistan Oilfields Ltd. 0.00000 0.00000 922523.96 0.00000 2162080.47 29 Pak Suzuki Motor Co. Ltd. 0.00000 0.00000 0.00000 0.00000 1869683.94
30 Pioneer Cement Ltd. 0.00000 0.00000 2695063.32 0.00000 768050.74
31 Pakistan State Oil 0.00000 0.00000 0.00000 0.00000 0.00060
32 Pakistan Telecommunication Co. Ltd. 0.00000 0.01335 0.00000 0.00000 22579369.83
33 Searle Pakistan Ltd. 0.00000 0.00078 0.00000 0.00000 0.00074
34 Pakistan Tobacco Co. Ltd. 0.00000 0.00022 0.00027 0.00000 0.00000
35 Shell Pakistan Ltd. 0.00000 0.00000 0.00000 0.00000 0.00006
36 Sui Northern Gas Pipelines Ltd. 0.00000 0.00000 0.00000 0.00000 21056546.93
37 Lafarge Pak. Cement Ltd. 0.00000 0.00000 0.00002 0.00000 2995434.86
DMU: Decision making units, CGS: Cost of goods sold, TA: Total assets, SA: Selling and admin expenses
Table 3: Descriptive analysis
Variables EFF ACP CR GWCTR SG FLR
Mean 1.3847 39.538 1.7116 0.4714 0.1597 0.4992
Median 0.9893 16.0417 1.3777 0.4492 0.1448 0.5029
Maximum 6.4837 329.507 6.9193 0.9699 1.6507 1.0048
Minimum 0.0922 0.0091 0.2642 0.0032 −0.4721 0.0156
Standard deviation 1.2207 59.0739 1.1388 0.2460 0.2574 0.2137
Skewness 1.8295 2.5610 1.8560 0.3132 1.7922 0.0288
Kurtosis 6.4205 9.9209 7.5161 2.0909 10.976 1.9818 Jarque-Bera 232.07 685.754 316.12 11.2746 707.43 9.6192
Probability 0.0000 0.000000 0.000 0.0035 0.0000 0.0081
Sum 307.42 8777.582 379.99 104.67 35.45 110.82 Sum Sq. Dev. 329.31 771229.3 286.64 13.376 14.64 10.100
Observations 222 222 222 222 222 222
5. CONCLUSION
This research has been performed for dealing with some of
the important working capital management policies and firm efficiency regarding to firm specification. For this purpose, a detailed analysis has been performed on manufacturing firms.
DEA and Tobit regression analysis has been performed to achieve the objective of this study. Analysis revealed some important
areas from which the firm efficiency can be improved and an
optimum level can be achieved. Moreover, with the help of above stated tools, analysis has made to measure the impact of
working capital management on firm efficiency. DEA results indicate that only fifteen companies require increase in inputs to attain better output whereas six companies require decrease in the input. However sixteen companies have to consistent
with their existing proportionate of inputs to sustain the output maximization. Further results indicate that the input slack
requires to rectify either it exists in input elements or in output elements. However inputs have greater importance for the
slack values. It is because we have to redesign the policies for
such firms regarding to the said input parameters. Output slack
indicates that the results are not due to only these inputs it may be due to other elements as well.
Further results shows that the efficiency variable is positively
skewed in descriptive statistics. Correlation results conclude that
efficiency is negatively related to ACP and CR significantly. It means as ACP and CR will increase efficiency curve fall down. However efficiency has positive correlation with GWCTR and FLR significantly. It indicates that increase in GWCTR and FL will also increase the efficiency in positive dimension. Tobit regression analysis concludes that ACP has significant negative impact on efficiency and CR, GWCTR and FLR have positive significant impact on efficiency. The primary focus of this study
is to determine the impact of working capital management on
firm efficiency and the results hence indicate that all variables have significant impact on firm efficiency except growth rate. The computations reveal that most of the ratios have a significant relationship with firm efficiency, and by controlling these ratios,
the efficiency can be effectively enhanced. Resultantly, the
determinants for efficiency in working capital management are identified and hence the financial managers and policy makers Table 4: Correlation matrix
EFF ACP CR GWCTR SG FLR
EFF 1
ACP −0.1269 1
CR −0.1019 0.1056 1
GWCTR 0.5012 0.3065 0.0862 1
SG 0.0700 0.0020 0.0062 0.0205 1 FLR 0.3109 0.2129 −0.7027 0.1916 0.0330 1 ACP: Average collection period, SG: Sale growth, EFF: Efficiency, CR: Current ratio,
GWCTR: Gross working capital turnover ratio, FLR: Financial leverage ratio
Table 5: Tobit regression analysis
Dependent variable: EFF Method: ML ‑ Censored normal (Tobit) Variable Coefficient Standard
error z‑statistic P C −1.159747 0.330813 −3.505747 0.0005
ACP −0.008298 0.001171 −7.086941 0.0000*
CR 0.216902 0.084554 2.565260 0.0103*
GWCTR 2.591246 0.274377 9.444102 0.0000*
SG 0.210775 0.240429 0.876660 0.3807
FLR 2.495849 0.462179 5.400183 0.0000*
Error distribution
Scale: C(7) 0.918613 0.043595 21.07134 0.0000
Mean
dependent var 1.384791 S.D. dependent var 1.220711 S.E. of
regression 0.931080 Akaike info criterion 2.731160
Sum squared
resid 186.3855 Schwarz criterion 2.838451 Log likelihood −296.1587 Hannan-Quinn criter. 2.774477 Avg. log
likelihood −1.334048 Left censored
obs 0 Right censored obs 0
Uncensored obs 222 Total obs 222
*P<0.05. ACP: Average collection period, SG: Sale growth, EFF: Efficiency,
CR: Current ratio, GWCTR: Gross working capital turnover ratio, FLR: Financial leverage ratio
Table 6: Redundant variable test
Null hypothesis: ACP CR GWCTR SG FLR are jointly insignificant
Specification: EFF C ACP CR GWCTR SG FLR Redundant variables: ACP CR GWCTR SG FLR
Value df P Likelihood
ratio 125.2374 5 0.0000
LR test summary:
Restricted
LogL −358.7774 220 Unrestricted
LogL −296.1587 215 Restricted test equation Dependent variable: EFF
Method: ML ‑ Censored normal (Tobit) (Quadratic hill climbing)
Variable Coefficient Standard
error z‑statistic P C 1.384791 0.081744 16.94058 0.0000
Error distribution
Scale: C(2) 1.217958 0.057802 21.07131 0.0000
Mean
dependent var 1.384791 S.D. dependent var 1.220711 S.E. of
regression 1.225966 Akaike info criterion 3.250247
Sum squared
resid 330.6582 Schwarz criterion 3.280902 Log likelihood −358.7774 Hannan-Quinn criter. 3.262624 Avg. log
likelihood −1.616115 Left censored
obs 0 Right censored obs 0
Uncensored
obs 222 Total obs 222
ACP: Average collection period, SG: Sale growth, EFF: Efficiency, CR: Current ratio,
must have focus on these elements to increase the performances of the manufacturing sector.
In a very tidy and competitive environment, every firm not only focuses on more profitability but also gives a lot of importance to work efficiently and in order to attain the optimum efficiency,
our study is considered to be useful for policy makers, managers,
planners and scholars in evaluating the efficiency of firms and the impact of working capital management on firm efficiency. This
study is also expected to be more supportive to the management of
manufacturing companies to make their companies more efficient
with the help of variables of working capital management. It also gives the statistical values of variables to estimate how much the
independent variables are affecting dependent variable. Our study
Figure 1: Residuals histogram
Figure 2: Gradients of the objective function
also provides important information to stakeholders to evaluate how much this sector is managing working capital constituents
and how efficiently this manufacturing sector is working in current
scenario. It has been highlighted that in order to make companies
more efficient, they need to focus on ACP, GWCTR, SG and financial debt ratio, because these variables have shown significant impact on firm efficiency. Moreover, the optimum level can also
be attained by controlling these variables effectively.
Previous topic of limitations reveals the opportunities for researchers to consider the unconsidered areas and methods. As we have taken only the manufacturing sector of Pakistan, this research
can be done on all sectors in order to check their efficiency and working capital management’s impact. Moreover, due to lack of
time and resources, we have taken only limited companies for our analysis but it can be extended up to maximum companies of the whole population in order to get more precise results.
Considering the same methodology, this study can be extended within the same country market of any other foreign market, with more companies and more working capital management ratios. Furthermore, this study includes DEA and Tobit regression analysis but other methods like parametric method and ratio analysis can also be used for calculating the impact of working
Lastly, this study can be extended with more companies and more sectors, or may be considered for the comparison of companies belongs to two or more different economies, which can give more reliable, vast and diverse results. It can also be used to estimate the
efficiency of the companies operating in same country.
REFERENCES
Abokaresh, M.S.M., Kamaruddin, B.H. (2011), Performance rating of privatized and non-privatized firms using data envelopment analysis technique. Journal of Information Engineering and Applications, 1(4), 1-12.
Avkiran, N.K. (1999), The evidence on efficiency gains: The role of mergers and the benefits to the public. Journal of Banking and Finance, 23(7), 991-1013.
Ayadi, O.F., Arinola, O.A., Omolehinwa, E. (1998), Bank performance
measurement in a developing economy: An application of data
envelopment analysis. Managerial Finance, 24(7), 5-16.
Banker, R.D., Chang, H., Lee, S.Y. (2010), Differential impact of Korean
banking system reforms on bank productivity. Journal of Banking
and Finance, 34(7), 1450-1460.
Banker, R.D., Charnes, A., Cooper, W.W. (1984), Some models for estimating technical and scale inefficiencies in data envelopment analysis. Management Science, 30(9), 1078-1092.
Barth, J.R., Caprio, G., Levine, R. (2013), Bank regulation and supervision in180 countries from 1999 to 2011. Journal of Financial Economic Policy, 5(2), 111-219.
Casu, B., Molyneux, P. (2003), A comparative study of efficiency in European banking. Applied Economics, 35(17), 1865-1876.
Charnes, A., Cooper, W.W., Rhodes, E. (1978), Measuring the efficiency of decision making units. European Journal of Operational Research, 2(6), 429-444.
Coelli, T.J., Rao, D.S.P., O’Donnell, C.J., Battese, G.E (2005), An
Introduction to Efficiency and Productivity Analysis. 2nd ed.
New York, USA: Springer Science.
Das, A., Ghosh, S. (2006), Financial deregulation and efficiency: An
empirical analysis of Indian banks during the post reform period.
Review of Financial Economics, 15(3), 193-221.
Deloof, M. (2003), Does working capital management affect profitability of Belgian firms? Jounal of Business, Finance and Accounting, 30(3), 573-587.
Fernando, J.M.R., Nimal, P.D. (2014), Does risk management affect on bank efficiency? An analysis of Sri Lankan banking sector. International Journal of Management and Sustainability, 3(2), 97-110. Grigorian, D.A., Manole, V. (2002), Determinants of Commercial Bank
Performance in Transition: An Application of Data Envelopment
Analysis. IMF Working Paper, WP/02/146. Washington, DC. Hsiao, H.C., Chang, H., Cianci, A.M., Huang, L.H. (2010), First financial
restructuring and operating efficiency: Evidence from Taiwanese commercial banks. Journal of Banking and Finance, 34(7),
1461-1471.
Jha, S., Hui, X., Sun, B. (2013), Commercial banking efficiency in Nepal:
Application of DEA and Tobit model. Information Technology
Journal, 12(2), 306-314.
Kao, M., Lin, C., Hsu, P., Chen, Y. (2011), Impact of the financial crisis and risk management on performance of financial holding companies
in Taiwan. World Academy of Science, Engineering and Technology,
50, 413-417.
Lee, T., Chih, S. (2013), Does financial regulation enhance or impede the efficiency of China’s listed commercial banks? A dynamic perspective. Emerging Markets Finance and Trade, 49, 132-149. Lee, T., Chih, S. (2013a), Does financial regulation enhance or impede
the efficiency of China’s listed commercial banks? A dynamic perspective, Emerging Markets Finance & Trade, 49,132-149. Lee, T., Chih, S. (2013b), Does financial regulation affect the profit
efficiency and risk of banks? Evidence from China's commercial
banks. North American Journal of Economics and Finance,
26,705-724.
Miller, S., Noulas, A.G. (1996), The technical efficiency of large bank production. Journal of Banking and Finance, 20(3), 495-509. Nazir, M.S., Afza, T. (2009), Impact of aggressive working capital
management policy on firms’ profitability. The IUP Journal of Applied Finance, 15(8), 20-30.
Paramasivan, C., Subramanian, T. (2009), Financial Management.
New Delhi: New Age.
Tseng, F.C. (2009), Measuring business performance in the high-tech manufacturing industry: A case study of Taiwan’s large-sized TFT-LCD panel companies. Omega, 37(3), 686-697.
Yue, P. (1992), Data Envelopment Analysis and Commercial Bank
Performance with Applications to Missourie Banks. Economic Review. St. Louis: Federal Reserve Bank. p31-45.
Zhou, N., Qiu, J., Zhang, X. (2011), A DEA-Based Study on Science and Technology Input-Output Efficiency of Chinese Large and Medium-Sized Enterprises. Paper Presented at the Third
Pacific-Asia Conference on Circuits, Communications and System,
(PACCS).
Table 7: Wald test
Test
statistic Value Df Probability
F-statistic 33.65178 (5, 215) 0.0000 Chi-square 168.2589 5 0.0000 Null hypothesis: C(2)=C(3)=C(4)=C(5)=C(6)=0
Null hypothesis summary: Normalized
restriction (=0) Value Standard error
C(2) −0.008298 0.001171 C(3) 0.216902 0.084554 C(4) 2.591246 0.274377 C(5) 0.210775 0.240429 C(6) 2.495849 0.462179 Restrictions are linear in coefficients
Sample: 2009 2014
Included observations: 222 Autocorrelation Partial
correlation AC PAC Q‑stat Prob* .|*****| .|*****| 1 0.699 0.699 109.82 0.000
.|***| *|.| 2 0.419 −0.135 149.49 0.000
.|***| .|**| 3 0.375 0.272 181.35 0.000
.|**| .|.| 4 0.336 −0.037 207.17 0.000
.|*| *|.| 5 0.157 −0.193 212.85 0.000
*Probabilities may not be valid for this equation specification. The autocorrelation