Pre-s
1Department o Corresponden University, Ist Received: Oct doi:10.11114/j Abstract Information a needs to take The mechanic education teac can use strong of vocational, to special edu and daily live frequency of (TAM) in ord decisions. To education teac use of techno about regardin
Keywords: sp technology, st 1. Introductio 1.1 Informatio Technology is teaching meth opportunity to Koorland, 199 thinking skills educational en ICT supported attention on Martínez-Segu education by material, etc. ( 1.2 Technolog If special educ properly, they vocational, e qualifications effective and c
ervice Sp
of Computer E nce: Sabiha Y tanbul, Turkey
tober 18, 2016 jets.v4i12.192
and communic their attention cal advantages
chers integrate g tools for com educational a ucation profess es. The aim of technology in der to determin
examine thes chers’ percepti
logy, shape th ng use of techn pecial educati tructural equati
on
on and Commu s one of the pra hods could be p o try simulation 95). Besides, s of individua nvironment can d education he
the task th ura, 2013). So
virtue of their (Yee, 2012). gy supported In
cation professi y can attain str
ducational an in ICT suppo correct use of
pecial Ed
A S
Sa Education and I Yeni, Departm
y.
6 Accep 9 U
ation technolo n to the course of ICT tools m e technologica mmunication w and enjoyable a
sionals’ qualifi f this research n their classes
ne the factors se factors, a S ions of usefuln heir behavioral nology predict ion, pre-servic ion model
unication Tech actical ways to produced by p ns, basic drill one of the be als by providin n be useful for elps special ind hey need to
ome of the m r attributes suc
nstruction with ionals integrate
rong tools for nd enjoyable orted education
technology in
ducation T
Structural
abiha Yeni1, Z Instructional T ment of Compu
pted: Novembe URL: http://dx
ogy (ICT) sup e content and make them att al tools and in with individual activities. The ications in ICT
was to examin and daily liv that affect pre Structural Equ ness (PU) of IC
l intentions (B their perceptio ce teachers, te
hnologies in Sp o improve edu professionals (B
and practice, c enefits of tech ng meaningful r individuals w dividuals to ta perform (Fe mechanical adv ch as storage
h Special Educ e technologica r communicati activities (N n and ICT usa the lessons (F
Teachers A
l Equatio
Zeynep Gecu-P Technology, Yuter Education
er 10, 2016 x.doi.org/10.11
ported educati to concentrate tractive for ind nnovative instr ls with special e effective and T supported ed ne pre-service ves. This resea
e-service spec uation Model CT, as well as BI) towards IC ons of usefuln echnology acc
pecial Educatio cation for peop Bertini & Kim communication hnology usage l learning exp with special edu
ake their attent ernández-Lópe vantages of IC and usage of
cation Teachers al tools and inn ion with speci Nam, Bahn & age frequency lanagan, Bouc I
Acceptan
on Model
Parmaksiz1 ildiz Technica n and InstructiOnline Pu 1114/jets.v4i12
ion helps the e their attentio dividuals with ructional meth educational n correct use of ducation and I e special educa arch analyzed ial education (SEM) was u opinions of pe CT. In addition ess (PU) of the ceptance mode
on
ple. With the h mani, 2003) and n or explorator e in special ed eriences. Integ ucational need tion to the cou ez, Rodríguez CT tools can
large amount
rs
novative instru ial individuals & Lee, 2013) in their lesso ck & Richardso
SSN 2324-805X Published
URL
nce and U
al University, I ional Technol
ublished: Novem 2.1929
individuals wi on on the task special educat hods into their needs and also f technology in ICT usage freq ation teachers’ the Technolo teachers’ ICT used. Accordin eople (SN) the n, opinions of ese technologi el, information
help of technol d individuals w ry activities (E ducation is im grating techno ds (Martin, 200 urse content an
z-Fórtiz, Rod be favorite fo of data, provi
uctional approa s and also pre
. Special edu ns and daily l on, 2013).
X E-ISSN 2 by Redfame P L: http://jets.redf
Use of ICT
Istanbul, Turke logy, Yildiz T
mber 11, 2016
ith special edu they need to tional needs. I classes prope present differe n the lessons i quency in thei acceptance an gy Acceptanc
acceptance an ng to findings ey care about r people (SN) t ies.
n and commu
logy, new learn with special ne Edwards, Black mproving high ology successfu 04).
nd to concentr dríguez-Almen or special ind iding visual an
aches into thei sent different ucation profe lives are relate
324-8068 Publishing fame.com
T:
ey Technical 6 ucational perform. If special erly, they ent types s related r classes nd usage e Model nd usage , special egarding hey care unication ning and eeds find khurst & her order fully intorate their ndros & ividuals’ nd audio
r lessons types of ssionals’ ed to the
Journal of Education and Training Studies Vol. 4, No. 12; December 2016
Teachers stated that they faced some problems such as cost, usability, lack of experience while using assistive technology (AT) (Flanagan et al., 2013). Teacher had limited information about using AT. Special education teacher may have had AT coursework during their undergraduate or graduate education, besides they can attend workshops or seminars for their professional development to enrich their instruction with AT (Derer, Polsgrove & Rieth, 1996; Lee & Vega, 2005; Ludlow, 2001; Michaels & McDermott, 2003 as cited in Flanagan et al., 2013). Moreover, high purchase and upgrade prices are other problems for teachers while using technology. Usability is another problem that teachers faced with, usable tools make easier for them to use technology in special education.
In their studies Nam et al. (2013) tested the relationships among fundamental elements (facilitating condition, perceived ease of use, computer self-efficacy, result demonstrability, perceived usefulness, and behavioral intention) of AT acceptance. The results of the study supported the effects hypothesized in conceptual model of AT acceptance. According to the results the significant element that was affecting AT usage was perceived usefulness.
1.3 Technology Acceptance Model
Research model based on Technology Acceptance Model (TAM) was designed by Davis (1989). The aim of the TAM was to explain theoretically the determinants factors of acceptance of computer and be efficient to make explanation for wide range of users’ behaviors. The researchers can prefer this model both estimate users’ behaviors and make theoretical explanations about technology acceptance. Therefore, TAM guides researchers to identify reasons for a system that was unacceptable and to assist about corrective interventions (Davis, 1989).
1.4 The Elements of Technology Acceptance Model
Behavioral intention (BI) is a measurement of degree of person’s engaging in a specified behavior. BI can be explained as an individual’s presence for acting a behavior. TAM asserted that it determines individual’s acceptance or rejection to use of information technology, in other words it states that behavioral intention of individual is the primary factor that determine an individual's actual use (Hu, Clark & Ma, 2003; Teo, 2011).
Perceived Usefulness (PU) is a positive or negative idea about performance increase in users’ jobs that they got after using technology (Davis, 1989). The idea of not waiting in a line can be given as an example of tax payer who pays taxes by online without going tax office.
Perceived Ease of Use (PEU) is a degree to which an individual’s beliefs about ease of using particular technology and learning without additional effort. If individuals think that new technology is easy to use, their behavioral intention towards using technology becomes positive. The studies showed that PEU had indirect effect on PU (Davis, 1989). For example, two graphic editors are similar in terms of perceived ease of use; if one of them produces higher quality of graphics than other editor, previous one should be accepted as more useful (Davis, 1989).
Subjective Norm (SN) is a “perceived social pressure to perform or not to perform a behavior” (Hu, Clark & Ma, 2003; Ma, Anderson & Streith, 2005). Individuals can perform behaviors with respect to the decisions of people around them (Fishbein ve Azjen, 1975).
1.5 The Purpose of the Study
The purpose of this research was to determine pre-service special education teachers’ acceptance and usage frequency of technology in their daily lives and lessons. This research analyzed the TAM in order to determine the factors that affect pre-service special education teachers’ ICT acceptance and usage decisions. This research examined pre-service teachers’ perceived usefulness (PU), perceived ease of use (PEU), behavioral intention (BI) and subjective norm on using ICT tools.
1.6 Hypothesis
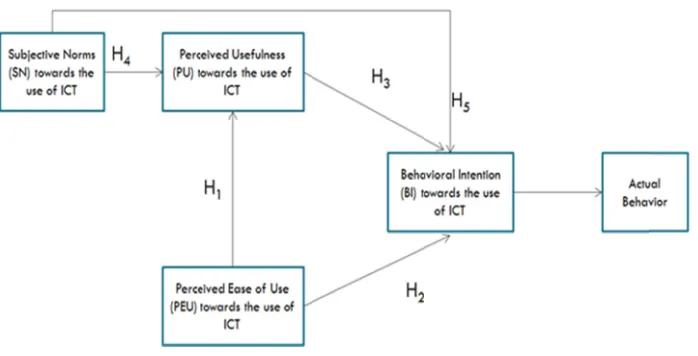
The general structural model, which included behavioral intention, perceived usefulness, perceived ease of use and subjective norm on technology acceptance of pre-service special education teachers, was developed based on the TAM. Research model was shown in Figure 1.
H1:Pre-service special education teachers’ perceived ease of use of ICT tools affects their perceived usefulness of ICT tools.
H2:Pre-service special education teachers’ perceived ease of use of ICT tools affects their behavioral intention to use ICT tools.
H3:Pre-service special education teachers’ perceived usefulness of ICT tools affects their behavioral intention to use ICT tools.
2. Method
TAM formed technology by used. SEM is used to test th facilitates ana data collection 2.1 Sampling P The universe universities. T examine cons conducted. A Babin and An sufficient. Ho University’s D 21. 59% of th students, 30% participants w purpose of the at any stage o in approximat 2.2 Data Colle The data coll professional q duration of us second part co intention (5 ite and from ques Table 1. Sourc
Table 1 presen about perceiv Davis (1989) adapted from
the basic fram y pre-service sp a method used heories because alysis of media n is explained
Procedures of the study The sample co struct validity
rule of thumb nderson, 2005 owever, to dea Department of he participants % were second were day stud e study was ex f the study or r tely 20 minute
ection Tool an lection tool us questions on t se, whether the ontained a tota ems) and subje stion sets with ces of the Item Factors Perceiv Perceiv Behavi Subject nts a list of the ved usefulness and had the questions used
mework of thi pecial educatio d to test the rel e it allows con ation effects ( followed by te
consists of p onsisted of stu of the scale fo regarding sam ). Given that al with poten Special Educa s (n: 123) were year students, dents, and 33% xplained to pre
retract their an s.
d Developmen sed in the stu the gender an ey attended IC al of 20 items
ective norms ( high reliability ms Used in the
s
ved Usefulness ( ved Ease of Use ioral Intention (B
tive Norms (SN e scale’s factor
and perceived high reliabilit d by Hu, Clark
Figure 1
s study condu on teachers. To lationship betw nducting multip (Kline 2005; T esting of the hy
re-service tea udents attendin for technology mple size in EFA
the TAM sca ntial loss of d ation. The age e female and 4
30% were thi % were eveni e-service teach nswers. There w
nt of the Scale udy consisted nd age of the CT courses bef
on perceived u (3 items). Item ty figures. Item
Scale
(PU) (PEU) BI) N)
rs and studies d ease of use ty figure of 0 k and Ma (2003
1. TAM Diagra
ucted to identif o examine thes ween observed ple analyses at Teo, 2009). Fi
ypotheses and
chers attendin ng Marmara U y acceptance m FA is that there ale in this stud data, the scale of participants 41% were ma rd year studen ing students. hers, and they w
was no time li
of two main participants, t fore, and whet usefulness (6 i ms on the scale ms in this part w
Adapted Davis (19 Davis (19 Hu, Clark Hu, Clark that were cons were adapted .93. Items on 3).
am
fy the factors se factors, a St d and latent var
t once, takes m rst, the proces a discussion o
ng the special University’s D model, an Expl
should be at l dy has 20 item e was adminis
s varied betwe le (n: 85). 20% nts, and 20% w
Before admin were informed imit for filling
parts. (a) Th the classes th ther they deve items), perceiv were selected were 5-point L
Studies 989) 989)
k & Ma (2003) k & Ma (2003)
sulted when pr d from a quest behavioral in
that affect acc tructural Equat
riables (Kline, measurement e ss of question of results.
education tea epartment of loratory Facto east 5 subjects ms, a sample stered to 208 een 17 and 28, % of the partic were fourth yea
nistering the m d that they cou
out the forms.
he first part co hey attend, ow
eloped any dig ved ease of use from previous Likert type item
reparing the sc tion set that w ntention and s
ceptance and tion Model (SE , 2005). It is fr
rrors into acco nnaire developm
aching departm Special Educa or Analysis (E
s per item (Hai size of 100 sh
students of M and the mean cipants were f ar students. 67 measurement t uld refuse to pa . Forms were f
ontained perso wnership of IC gital materials. e (6 items), be s studies on the ms.
cale. Items in t was originally
subjective norm usage of EM) was equently ount, and ment for
ments of ation. To FA) was ir, Black, hould be Marmara age was first year % of the tool, the articipate filled out
onal and CT tools, (b) The ehavioral e subject,
Journal of Education and Training Studies Vol. 4, No. 12; December 2016
Cronbach’s alpha internal consistency coefficients were calculated to find out how reliable the data would be. As Table 2 shows, all variables had moderate or high levels of reliability, with reliability coefficients equal to or greater than 0.80.
Table 2. Reliability Coefficients
Factors Number of Factors Cronbach’s Alpha Reliability Coefficients
Perceived Ease of Use (PEU) 6 .874
Perceived Usefulness (PU) 6 .923
Subjective Norms (SN) 3 .800
Behavioral Intention (BI) 5 .933
3. Results
3.1 Participants’ Experience with ICT Tools
Table 3 reports the ICT tools owned by participants of the study. Table 3 shows that almost all (94%) participants own smartphones, 88,5% have internet access, and 75,5% own computers. Only 2 participants (1%) said that they did not use ICT tools. Projectors (3,4%), scanners (9,1%) and printers (12%) are among the least owned ICT tools.
Table 3. ICT tools owned
Devices Frequency %
Smartphone 196 94,2
Internet 184 88,5
Computer 157 75,5
Television 117 56,3
Tablet computer 60 28,8
CD/DVD player 45 21,6
Printer 25 12
Scanner 19 9,1
Projection 7 3,4
None of them 2 1
Participants were asked to indicate for how long they have been using ICT tools, and Table 4 reports data on duration of use. Table 4 shows that 38,9% of the participants have been using computers for 8-11 years, 59,6% do not use tablet computers, and 42,3% have been using smartphones for 1-3 years and 41,8% for 4-7 years. No participants reported having used a tablet computer for longer than 7 years.
Table 4. Duration of use of ICT tools
Computer Tablet Computer Smartphone
Duration F % F % F %
Not use 12 5,8 124 59,6 6 2,9
Less than 1 year 5 2,4 11 5,3 13 6,3
1-3 years 14 6,7 57 27,4 88 42,3
4-7 years 53 25,5 16 7,7 87 41,8
8-11 years 81 38,9 0 0 12 5,8
More than 11 years 43 20,7 0 0 2 1,0
In addition to duration of use, participants were asked to indicate how frequently they use ICT tools in their daily lives (Table 5). Table 5 shows that smartphone is the ICT tool most frequently used by participants in their daily lives, with 78,4 reporting that they use smartphones on a daily basis. 66,3% stated that they do not use tablet computers in their daily lives at all. 25,5% of participants said they used a computer several days a week, and 24% said they used a computer several hours every day.
Table 5. Frequency of use of ICT in daily lives
Computer Tablet Computer Smartphone
Frequency F % F % F %
Every day, continuously 39 18,8 2 1,0 163 78,4
Several hours every day 50 24,0 16 7,7 32 15,4
Several days a week 53 25,5 20 9,6 5 2,4
Several hours a week 36 17,3 13 6,3 0 0
Several hours a month 19 9,1 19 9,1 2 1,0
None 11 5,3 138 66,3 6 2,9
Table 6. Frequency of use of ICT for studying purposes
Computer Tablet Computer Smart Phone Digital Material
Frequency F % F % F % F %
Every day, continuously 12 5,8 2 1,0 41 19,7 13 6,3
Several hours every day 18 8,7 3 1,4 28 13,5 22 10,6
Several days a week 68 32,7 16 7,7 58 27,9 35 16,8
Several hours a week 54 26,0 9 4,3 35 16,8 20 9,6
Several hours a month 49 23,6 13 6,3 27 13,0 49 23,6
None 7 3,4 165 79,3 19 9,1 69 33,2
92% of participants stated that they took a course on ICT tools, whereas 8% reported not having received any training on this subject. 80% of participants never used ICT tools to develop digital materials for special education, whereas 20% developed digital materials for special education using ICT tools.
3.2 Results of the Factor Loading Analysis
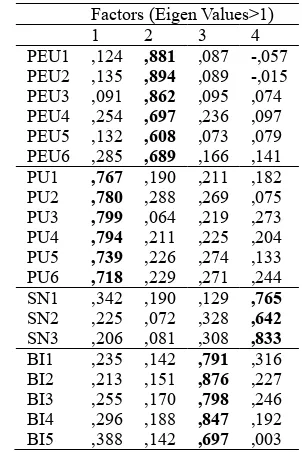
To examine construct validity of the scale, an Exploratory Factor Analysis (EFA) was conducted. Factor loadings for the variables that make up the Technology Acceptance Model were calculated. Results of the exploratory factor analysis of the variables, conducted using Varimax rotation, are reported in Table 7. None of the items on the questionnaire had a factor loading smaller than 0,500.
Table 7. Factor loadings of the variables
Factors (Eigen Values>1)
1 2 3 4
PEU1 ,124 ,881 ,087 -,057 PEU2 ,135 ,894 ,089 -,015 PEU3 ,091 ,862 ,095 ,074 PEU4 ,254 ,697 ,236 ,097 PEU5 ,132 ,608 ,073 ,079 PEU6 ,285 ,689 ,166 ,141 PU1 ,767 ,190 ,211 ,182 PU2 ,780 ,288 ,269 ,075 PU3 ,799 ,064 ,219 ,273 PU4 ,794 ,211 ,225 ,204 PU5 ,739 ,226 ,274 ,133 PU6 ,718 ,229 ,271 ,244 SN1 ,342 ,190 ,129 ,765 SN2 ,225 ,072 ,328 ,642 SN3 ,206 ,081 ,308 ,833 BI1 ,235 ,142 ,791 ,316 BI2 ,213 ,151 ,876 ,227 BI3 ,255 ,170 ,798 ,246 BI4 ,296 ,188 ,847 ,192 BI5 ,388 ,142 ,697 ,003 3.3 Results of the Structural Equation Model Analysis
Journal of Educ
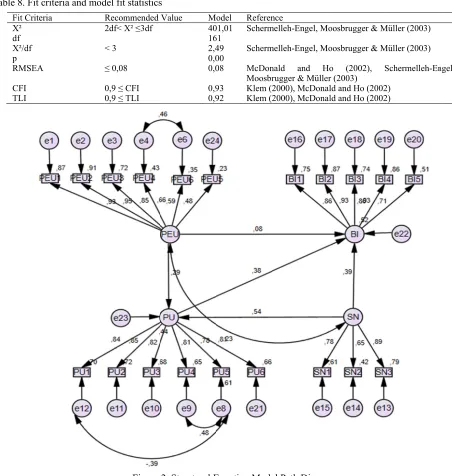
Table 8. Fit cr Fit Criteri X² df X²/df p RMSEA CFI TLI
As the structu measured by with 93%, and also measured items with the tools allows m measured by 5 with 93%, and is measured b has the highes As the structu (SN) around p communicatio behavioral int teachers’ beha
cation and Train
riteria and mod a
ural equation 6 items, but th d “It is easy f d by 6 items, w e highest value me to conduct 5 variables. Of d “I would like by 3 items. The st effect on the ural equation m pre-service spe on technologie tention (BI) to avioral intentio
ning Studies
del fit statistics Recommended 2df< X² ≤3df < 3
≤ 0,08 0,9 ≤ CFI 0,9 ≤ TLI
Figure model path d he two most im for me to use I
with the items es are “Using I t my courses m f those, the mo e ICT tools to b
e item “People e variable with model path diag ecial education es with a signi
use ICT with on (BI) to use
s
Value M
40 16 2,4 0,0 0,0 0,9 0,9
2. Structural E diagram (Figur
mportant item ICT tools” (PE s having simil ICT tools impr more quickly” ost important t be used in my e I care about
89%. gram (Figure 2 n teachers pred ificance level o h a significance ICT with a sig
odel Referen 01,01
61 Scherm
49 Scherm
00
08 McDon
Moosbr 93 Klem (2 92 Klem (2
Equation Mode re 2) shows, t ms are “It is ea EU2) with 95%
ar levels of in roves my cours ” (PU2) with 8 two are “It is a
classes” (BI4) think that usin
2) and the table dict teachers’ i
of 54%. Subje e level of 39% gnificance leve
nce
melleh-Engel, M melleh-Engel, M nald and H rugger & Müller 2000), McDona 2000), McDona
el Path Diagram the variable o asy for me to l %. The variabl nfluence varyin se performanc 85%. The vari a very good ide ) with 93%. Th ng ICT tools i
e of hypothese deas about the ective norms ( %. Perceived U el of 38%. Per
Vol. 4,
oosbrugger & M oosbrugger & M Ho (2002),
r (2003) ald and Ho (2002 ald and Ho (2002
m
f “perceived e learn how to u le of “perceive ng between 85 ce” (PU1) with
iable of behav ea to use ICT t he variable of in my courses
es (Table 9) sho e usefulness (P (SN) were foun Usefulness (PU
rceived ease of
No. 12; Decem
Müller (2003) Müller (2003)
Schermelleh-En 2)
2)
ease of use” ( use ICT tools” ed usefulness” 5% and 78%. h 84%, and “U vioral intention
tools in course subjective nor is a good idea
ow, opinions o PU) of informa und to predict t U) was found to f use (PEU) w
mber 2016
ngel,
(PEU) is ” (PEU1) ” (PU) is The two sing ICT n (BI) is es” (BI2) rms (SN) a” (SN3)
to predict teachers’ ideas about the usefulness (PU) of information and communication technologies with a significance level of 29%.
Table 9. Hypothesis rejection / acceptance table
Hypothesis Path Direction Coefficient Values T value P Accept /Reject
H1 PEUPU ,29 4,51 <,001 Accepted
H2 PEU BI ,08 1,28 ,202 Rejected
H3 PUBI ,38 4,59 <,001 Accepted
H4 SNPU ,54 7,23 <,001 Accepted
H5 SNBI ,39 4,86 <,001 Accepted
Results mostly supported the Technology Acceptance Model (TAM), with one exception: the theoretical expectation that perceived ease of use (PEU) would affect behavioral intention (BI) to use technology was not empirically supported (Table 9).
4. Discussion
Studies on the effects of information and communication technologies show that their use improves instructors’ effectiveness and efficiency when teaching (Kirkup & Kirkwood, 2005). New technologies strengthen cooperation and communication in education and training, and increase the flexibility and convenience of educational activities. The technology supported learning methods can be better adapted for students if teachers’ and students’ reactions to technology supported learning systems are understood well (Turan & Colakoglu, 2008). To utilize the full potential of information and communication technologies, complementary and descriptive studies are needed.
This study aimed to identify the factors that affect an individual’s decision to accept and use information and communication technologies, using the framework of TAM and working with pre-service special education teachers. First, data were collected on the duration and frequency of use of information and communication technologies by pre-service special education teachers. It was found that pre-service special education teachers used ICT tools frequently in their daily lives and a large majority of participants received training on ICT tools, but the duration and frequency of use for studying purposes were much lower. The findings of this study can be important for identifying the factors behind this behavior and taking necessary measures.
Special education teachers’ perceptions of usefulness (PU) of information and communication technologies, as well as opinions of people (SN) they care about regarding use of technology, shape their behavioral intentions (BI) towards information and communication technologies. In addition, special education teachers’ perceptions regarding the ease of use (PEU) of information and communication technologies, and opinions of people (SN) they care about regarding use of technology, predict their perceptions of usefulness (PU) of these technologies. Perceived ease of use (PEU) was not found to have a statistically significant effect on behavioral intention (BI). In another study that used technology acceptance model, perceived usefulness was found as a dominant factor affecting assistive technology usage (Nam et al, 2013).
Proper and effective use of technology by special education professionals goes hand in hand with their frequency of use of ICT tools in class, and competency in ICT supported education (Flanagan, Bouck & Richardson, 2013). If pre-service teachers make more active use of ICT tools for studying purposes during their college education, this would help them make more use of technology after graduation when they conduct sessions with special education students. This is because pre-service teachers’ intention to accept and use ICT would improve if they were introduced to technology-supported practices in the courses they take and found these practices to be useful and effective (Avcu & Gokdas, 2012). Therefore, during their university education, pre-service teachers should be provided periodic training regarding the effects of ICT practices on the learning/teaching process, and they should be encouraged to participate in these programs.
References
Avcu, D. U., & Gokdas, I. (2012). Acceptance and Usage Intentions Related to Information and Communication Technologies of Second Cycle Primary School Teachers, Journal of Educational Sciences, 3(1), 42-59.
Bertini, E. S., & Kimani, S. (2003). Mobile devices: opportunities for users with special needs. Mobile HCI. In L. Chittaro (Ed.). Lecture Notes of Computer Science, 2795, 486–491. https:/doi.org/10.1007/978-3-540-45233-1_52 Davis, F. D. (1989). Perceived usefulness, perceived ease of use, and user acceptance of information technology. MIS
Quarterly, 13(3), 319-340. https:/doi.org/10.2307/249008
Derer, K., Polsgrove, L., & Rieth, H. (1996). A survey of assistive technology applications in schools and recommendations for practice. Journal of Special Education Technology, 13, 62–80.
Journal of Educ abbreviat 301–311 Fernández-Lo learning Educatio Fishbein, M., Reading, Flanagan, S., assistive https:/do Hair, J. F., Jr.,
Hall. Hu, P. J., Clar
Informat Kirkup, G., & – a tale o Klem, L. (200 Kline, R. B. (2 Lee, Y., & Veg Special E Ludlow, B. L Educatio Ma, W. W., A
study of Martin, S. S. standards 2004(1), McDonald, R Psycholo Michaels, C.
Program 18, 29–4 Nam, C. S., B
equation https:/do Schermelleh-E
significan Teo, T. (2009
approach Teo, T. (2011 Educatio Turan, A. H., assessme Yee, H. S. S. IEEE Sym https:/do
This work is l
cation and Train
tion spelling to .
opez, Á, Rodrí technology b on, 61(0), 77-9 & Ajzen, I. ( , MA: Addison Bouck, E. C., technology in i.org/10.1080/ , Black, W. C.
rk, T. H. K., & tion & Manage & Kirkwood, A of Gradualism 00). Structural 2005). Princip ga, L. A. (2005 Education Tech L. (2001). Tec on and Special Anderson, R., &
student teache (2004). A sam s. In Proceedin 4930-4935. N R. P., & Ho, ogical methods A., & McDer coordinators’ 1.
Bahn, S., & Le model app i.org/10.1080/ Engel, K., Moo
nce and descri 9). Evaluating h. Internationa ). Factors infl on,57(4), 2432 & Çolakoğlu, ent at Adnan M
(2012). Mobi mposium on E-i.org/10.1109/
icensed under
ning Studies
o adolescents
guez-Fórtiz, M based on iOS
0. http://dx.do (1975). Belief, n-Wesley.
& Richardson literacy instru /10400435.201 , Babin, B. J.,
& Ma, W. W. (2 ement, 41(2), 2 A. (2005). Info
rather than rev equation mode les and practic 5). Perceived k hnology, 20, 60 chnology and Education, 24 & Streith, K. ers, Journal of mpling of activ
ngs of Society Norfolk, VA: AA
M. H. R. ( s, 7(1), 64. http rmott, J. (2003 perceptions of
ee, R. (2013). A proach. Inter /10447318.201 osbrugger, H., iptive goodnes the intention al Journal of Te luencing teach 2-2440. https:/d
B. E. (2008). Menderes Univ
ile technology -Learning, E-M IS3e.2012.641
a Creative Co
with mild lear
M. J., Rodrígue devices to su i.org/10.1016/ f Attitude, Inte
n, J. (2013). M uction. Assistiv 12.682697
& Anderson,
2003). Examin 227-241. https: rmation and c volution. Learn
eling. ce of structural
knowledge, att 0–63.
teacher educ 4, 143–163.
O. (2005). Ex f Computer Ass vities used in for Informatio ACE.
(2002). Princi ps:/doi.org/10. 3). Assistive te f current attain
Acceptance of rnational Jou 12.711990
& Müller, H. s-of-fit measu to use techno Technology in T hers’ intention doi.org/10.101 Faculty’s acce ersity. Journal y for children
Management a 14954 ommons Attrib rning disabilit ez-Almendros upport individ /j.compedu.20 ention and Beh
Middle school ve Technology,
R. E. (2005).
ning technology :/doi.org/10.10 ommunication ning, Media an
l equation mod titudes, and ch
cation in spec
xamining user sisted Learning
special educa on Technology
iples and pra 1037/1082-98 echnology inte nment and imp
f assistive tech urnal of Hu
(2003). Evalu ures. Methods o
ology among Teaching and L
to use techno 16/j.compedu.2
eptance and us l of Dogus Uni with autism s and E-Services
ution 3.0 Licen
ties. Journal of
, M. L., & Ma duals with spe
12.09.014 havior: An In
special educat 25(1), 24-30.
Multivariate d
y acceptence b 016/S0378-720 ns technologies nd Technology
deling (2nd ed. hallenges of AT
cial education
acceptance of g, 21, 387-395 ation teacher p y and Teacher
actice in repo 9X.7.1.64 egration in sp portance. Journ
hnology by spe Human-Comput
uating the fit of of psychologica
student teache Learning, 5(2), ology: Model d
2011.06.008 se of technolo iversity, 9(1), spectrum disor s (IS3e), 1-5.
nse.
Vol. 4,
f Special Educ
artínez-Segura ecial education
troduction to
tion teachers’ p
data analysis (
by school teach 06(03)00050-8
s (ICT) in high y, 30(2), 185-1
.). Guilford Pr T use in specia
: Disaster or
f computer tec .
preparation cou Education Int
orting structur
pecial educatio nal of Special E
ecial education ter Interactio
f structural equ al research on ers: A structur , 106-118. development a
gy in higher e 106-121. rder: Major tr
No. 12; Decem
cation Techno
, M. J. (2013) n need. Comp
Theory and R
perceptions an
(6th ed.). NY:
hers: a logtudi 8
her education 99.
ess, New York al education. Jo
deliverance?
chnology: an e
ursework: Mee ternational Co
ral equation a
on teacher prep Education Tec
n teachers: A s on, 29(5), 3
uation models: nline, 8(2), 23-ral equation m
and test. Comp
education: an e
rends and issu
mber 2016
logy, 12,
. Mobile puters &
Research.
nd use of
Prentice ial study. teaching k. ournal of Teacher empirical eting the nference analyses. paration: hnology, structural 365-377. Tests of 74. modeling puters & empirical