Issues
ISSN: 2146-4138
available at http: www.econjournals.com
International Journal of Economics and Financial Issues, 2017, 7(1), 178-191.
Influencing Factors of Net Interest Margin in Turkish Banking
Sector
Serhat Yuksel
1*, Sinemis Zengin
21
Head of the Department of International Trade and Management, Konya Food and Agriculture University, Konya, Turkey,
2Ph.D. in
Banking, Turkey. *Email: [email protected]
ABSTRACT
The aim of this paper is to define the influencing factors of net interest margin in Turkish banking sector. Within this scope, the effects of 14 explanatory variables on net interest margin were analyzed. Moreover, quarterly data for the period between 2003 and 2014 was used in this study. After that, we created a model by using multivariate adaptive regression splines method so as to illustrate the relationship. The major finding in this study is that net interest margin is negatively related with non-interest income, non-performing loans, total assets and exchange rates. According to these results, it was determined that banks should focus on the quality of the assets in order to increase net interest margin. In addition to this situation, volatility in exchange rates should also be taken into the consideration by the banks for this situation.
Keywords: Banking, Net Interest Margin, Multivariate Adaptive Regression Splines, Turkey
JEL Classifications: E43, G2, G21, O16
1. INTRODUCTION
The importance of the banks for the economies increases especially
after globalization. They play such an important role for financial
sectors that most of the investments in the countries depend on the
loans given by the banks. In addition to this situation, depositors
can gain interest income owing to banks. Because of this situation,
banking sector is developing almost all around the world.
Similar to this situation, banking sector is also growing in Turkey.
Especially, after the banking crisis occurred in 2001, Turkey made
a lot of regulations related to banking sector. The subjects of risk
management and auditing became more important in the banking
sector. Due to these improvements in the banking sector, many
foreign banks entered to Turkey.
However, the growing banking system in Turkey brings with
questions of bank performance and profitability of the system.
New regulations on income limitations of banks and low saving
rate increase banks deposit competition. This competition affects
deposit interest rate, liquidity and bank profitability. Stability of
the banking sector is important task for economic growth.
When taking into the consideration of these factors, in this
paper, we tried to understand the determinants of net interest
margin in Turkish banking sector. So as to achieve this purpose,
we created a model by using multivariate adaptive regression
splines (MARS) method. This method was firstly used in this
study related to the subject of net interest margin. By making
this model, it will be possible to define the ways to increase
net interest margin in order for the banks to perform more
efficiently.
The paper is organized as follows: After introduction part, the
second part describes background of net interest margin in Turkey.
After that, the third part provides literature review and fourth part
includes research and application, to understand the relationship
between determinants MARS method was used. Finally, the
analyze results were given at conclusion.
1.1. Net Interest Margin in Turkish Banking Sector
Net interest margin is a measure of the difference between the
weighted average of yields on interest revenue and interest
gives information about the intermediation costs and efficiency
of the banks (Türker-Kaya, 2001).
Turkey is a country which suffered from 2 important banking
crises occurred in 1994 and 2001. Because of this situation, many
improvements were implemented in banking sector of Turkey after
2003. These improvements led to many positive results in this
sector, such as low amount of non-performing loans as it can be
seen in Graph 1. Because of these positive developments, Turkish
banking sector became very attractive for foreign investors.
The Graph 2 also gives information about the changes in loans
and deposits after 2003.
As it can be seen from the Graph 2, there was significant increase
in both loans and deposits in Turkish banking sector after
2004. Moreover, interest rates were also affected from these
improvements. The Graph 3 illustrates interest rates in Turkey
after 2003.
It was seen in Graph 3 that there was a radical decrease in both
consumer lending interest rates and individual deposit interest
rates after 2003. As a result of these improvements, net interest
margin of Turkish banking sector was also affected. The Graph 4
gives information about net interest margin after 2003.
As it can be seen from the Graph 4, net interest margin of Turkey
has a decreasing path after 2004. This ratio was 5.77 in 2004
whereas it declined to 3.44 in 2014. Another interesting result
that can be understood form this graph is that this ratio increased
in 2009 due to the global economic crisis occurred in 2008. In
addition to this situation, the Graph 5 gives information about the
net interest margin of Turkish banks with respect to their types.
It can be understood from Graph 5 that there was a decrease in
net interest margin in all types of the banks. It can also be seen
that net interest margin of foreign banks was higher than the state
banks and private banks in all years. Additionally, it was identified
that net interest margin in private banks is almost similar to the
net interest margin of state banks.
2. LITERATURE REVIEW
There are lots of studies related to the determinants of net interest
margin in the literature. Some of these studies were depicted on
Table 1.
Abreu and Mendes tried to explain the determinants of net interest
margin for some European countries. Within this context, 4
European countries were analyzed in this study. Moreover, the
data for the period between 1986 and 1999 was tested by using
regression method. As a result, it was concluded that,
loan-to-asset ratio has a positive impact on interest margins (Abreu and
Mendes, 2001). López-Espinosa et al. (2011) also reached the
same conclusion for 15 developed and emerging economies by
using the same method.
Graph 1: Non-performing Loans of Turkish Banks (2004-2014)
Source: Turkish Banking Association
Graph 2: Total Loans and Deposits of Turkish Banks (1,000 TL) (2004-2014)
Almorzoqi and Naceur made a study to investigate determinants of
bank interest margins in the Caucasus and Central Asia. In order to
achieve this purpose, the data of 6 different countries for the years
between 1998 and 2013 was used in this study. They concluded that
the size of the banks is positively related with net interest margin
(Almarzoqi and Naceur, 2015). Gerlach et al. (2005), Valverde and
Fernandez (2007) and Beck and Hesse (2006) found the similar
results by using different methods.
Angbazo tested the determinants of net interest margin of the
banks located in United States. Within this context, the data for
the period between 1989 and 1983 was analyzed in this study.
As a result of this analysis, it was determined that net interest
margin of the banks decreases when there is an increase in NPL
(Angbazo, 1997). Kannan et al. (2001), Dumičić and Rizdak
(2013), Rahman et al. (2015) also made the same conclusion by
using regression method.
Graph 3: Banks Average Lending and Borrowing Interest Rate in Turkey
Source: BRSA
Graph 4: Net Interest Margin of Turkish Banks (2004-2014)
Source: Turkish Banking Association
Graph 5: Net Interest Margin of Turkish Banks Regarding Ownership (2004-2014)
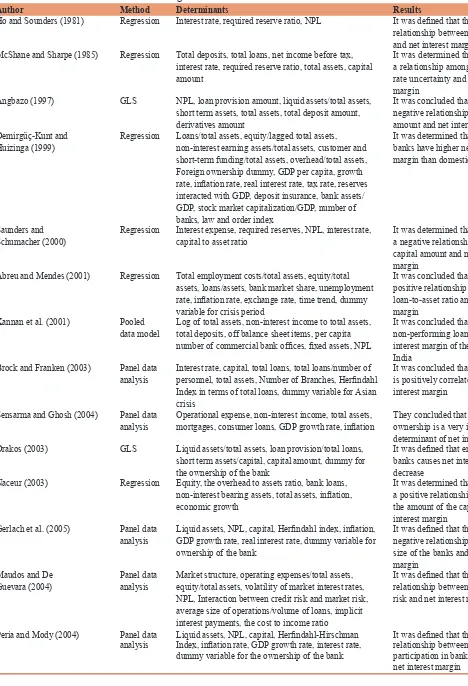
Author Method Determinants Results
Ho and Sounders (1981) Regression Interest rate, required reserve ratio, NPL It was defined that there is a relationship between interest rate and net interest margin
McShane and Sharpe (1985) Regression Total deposits, total loans, net income before tax, interest rate, required reserve ratio, total assets, capital amount
It was determined that there is a relationship among interest rate uncertainty and net interest margin
Angbazo (1997) GLS NPL, loan provision amount, liquid assets/total assets, short term assets, total assets, total deposit amount, derivatives amount
It was concluded that there is a negative relationship between NPL amount and net interest margin Demirgüç-Kunt and
Huizinga (1999) Regression Loans/total assets, equity/lagged total assets, non-interest earning assets/total assets, customer and short-term funding/total assets, overhead/total assets, Foreign ownership dummy, GDP per capita, growth rate, inflation rate, real interest rate, tax rate, reserves interacted with GDP, deposit insurance, bank assets/ GDP, stock market capitalization/GDP, number of banks, law and order index
It was determined that foreign banks have higher net interest margin than domestic banks
Saunders and
Schumacher (2000) Regression Interest expense, required reserves, NPL, interest rate, capital to asset ratio It was determined that there is a negative relationship between capital amount and net interest margin
Abreu and Mendes (2001) Regression Total employment costs/total assets, equity/total assets, loans/assets, bank market share, unemployment rate, inflation rate, exchange rate, time trend, dummy variable for crisis period
It was concluded that there is a positive relationship between loan-to-asset ratio and interest margin
Kannan et al. (2001) Pooled
data model Log of total assets, non-interest income to total assets, total deposits, off balance sheet items, per capita number of commercial bank offices, fixed assets, NPL
It was concluded that
non-performing loans affect net interest margin of the banks in India
Brock and Franken (2003) Panel data
analysis Interest rate, capital, total loans, total loans/number of personnel, total assets, Number of Branches, Herfindahl Index in terms of total loans, dummy variable for Asian crisis
It was concluded that bank capital is positively correlated with net interest margin
Sensarma and Ghosh (2004) Panel data
analysis Operational expense, non-interest income, total assets, mortgages, consumer loans, GDP growth rate, inflation They concluded that bank ownership is a very important determinant of net interest margin Drakos (2003) GLS Liquid assets/total assets, loan provision/total loans,
short term assets/capital, capital amount, dummy for the ownership of the bank
It was defined that entry of foreign banks causes net interest margin to decrease
Naceur (2003) Regression Equity, the overhead to assets ratio, bank loans, non-interest bearing assets, total assets, inflation, economic growth
It was determined that there is a positive relationship between the amount of the capital and net interest margin
Gerlach et al. (2005) Panel data
analysis Liquid assets, NPL, capital, Herfindahl index, inflation, GDP growth rate, real interest rate, dummy variable for ownership of the bank
It was defined that there is a negative relationship between the size of the banks and net interest margin
Maudos and De
Guevara (2004) Panel data analysis Market structure, operating expenses/total assets, equity/total assets, volatility of market interest rates, NPL, Interaction between credit risk and market risk, average size of operations/volume of loans, implicit interest payments, the cost to income ratio
It was defined that there is a relationship between interest rate risk and net interest margin
Peria and Mody (2004) Panel data
analysis Liquid assets, NPL, capital, Herfindahl-Hirschman Index, inflation rate, GDP growth rate, interest rate, dummy variable for the ownership of the bank
It was defined that there is indirect relationship between foreign participation in banking sector and net interest margin
Table 1: Studies related to net interest margin
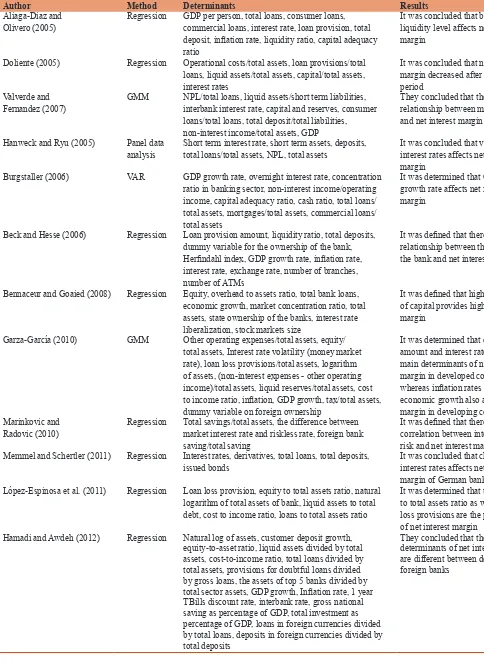
Author Method Determinants Results
Aliaga-Diaz and
Olivero (2005) Regression GDP per person, total loans, consumer loans, commercial loans, interest rate, loan provision, total deposit, inflation rate, liquidity ratio, capital adequacy ratio
It was concluded that bank liquidity level affects net interest margin
Doliente (2005) Regression Operational costs/total assets, loan provisions/total loans, liquid assets/total assets, capital/total assets, interest rates
It was concluded that net interest margin decreased after crisis period
Valverde and
Fernandez (2007) GMM NPL/total loans, liquid assets/short term liabilities, interbank interest rate, capital and reserves, consumer loans/total loans, total deposit/total liabilities, non-interest income/total assets, GDP
They concluded that there is a relationship between market power and net interest margin
Hanweck and Ryu (2005) Panel data
analysis Short term interest rate, short term assets, deposits, total loans/total assets, NPL, total assets It was concluded that volatility of interest rates affects net interest margin
Burgstaller (2006) VAR GDP growth rate, overnight interest rate, concentration ratio in banking sector, non-interest income/operating income, capital adequacy ratio, cash ratio, total loans/ total assets, mortgages/total assets, commercial loans/ total assets
It was determined that GDP growth rate affects net interest margin
Beck and Hesse (2006) Regression Loan provision amount, liquidity ratio, total deposits, dummy variable for the ownership of the bank, Herfindahl index, GDP growth rate, inflation rate, interest rate, exchange rate, number of branches, number of ATMs
It was defined that there is a relationship between the size of the bank and net interest margin
Bennaceur and Goaied (2008) Regression Equity, overhead to assets ratio, total bank loans, economic growth, market concentration ratio, total assets, state ownership of the banks, interest rate liberalization, stock markets size
It was defined that high amount of capital provides high interest margin
Garza-García (2010) GMM Other operating expenses/total assets, equity/ total assets, Interest rate volatility (money market rate), loan loss provisions/total assets, logarithm of assets, (non-interest expenses - other operating income)/total assets, liquid reserves/total assets, cost to income ratio, inflation, GDP growth, tax/total assets, dummy variable on foreign ownership
It was determined that capital amount and interest rate are the main determinants of net interest margin in developed countries whereas inflation rates and economic growth also affect the margin in developing countries Marinkovic and
Radovic (2010) Regression Total savings/total assets, the difference between market interest rate and riskless rate, foreign bank saving/total saving
It was defined that there is positive correlation between interest rate risk and net interest margin Memmel and Schertler (2011) Regression Interest rates, derivatives, total loans, total deposits,
issued bonds It was concluded that change in interest rates affects net interest margin of German banks López-Espinosa et al. (2011) Regression Loan loss provision, equity to total assets ratio, natural
logarithm of total assets of bank, liquid assets to total debt, cost to income ratio, loans to total assets ratio
It was determined that the loans to total assets ratio as well as loan loss provisions are the predictors of net interest margin
Hamadi and Awdeh (2012) Regression Natural log of assets, customer deposit growth, equity-to-asset ratio, liquid assets divided by total assets, cost-to-income ratio, total loans divided by total assets, provisions for doubtful loans divided by gross loans, the assets of top 5 banks divided by total sector assets, GDP growth, Inflation rate, 1 year TBills discount rate, interbank rate, gross national saving as percentage of GDP, total investment as percentage of GDP, loans in foreign currencies divided by total loans, deposits in foreign currencies divided by total deposits
They concluded that the
determinants of net interest margin are different between domestic and foreign banks
Table 1:
(Continued)
Garza-Garcia compared the determinants of net interest margin
in developed and developing countries. In order to achieve
this purpose, 6 developed and 8 developing countries were
analyzed for the period between 2001 and 2008. As a result,
it was defined that capital amount and interest rate affect net
interest margin in developed countries (Garza-Garcia, 2010).
Saunders and Schumacher (2000), Brock and Franken (2003),
Naceur (2003), Ben Naceur and Goaied (2008) and Khediri and
Ben-Khedhiri (2011) also reached the same results by using
regression method.
Demirgüç-Kunt and Huizinga made a study to identify the
determinants of net interest margin in commercial banks. Within
this scope, the data of 80 different countries for the years between
1988 and 1995 was used. As a result of regression analysis, it was
determined that foreign banks have higher net interest margin than
domestic banks (Demirgüç-Kunt and Huizinga, 1999). Sensarma
and Ghosh (2004), Drakos (2003), Peria and Mody (2004) and
Hamadi and Awdeh (2012) made the similar conclusion by
using different econometric technique. However, Aliaga-Diaz
and Olivero (2005) and Doliente (2005) reached the different
conclusion by using the same technique.
Maudos and De Guevera tried to analyze the determinants of net
interest margin in European banking sector. Within this context,
the data of 5 different countries for the period between 1993
and 2000 was used. As a result of the regression analysis, it was
determined that interest rate risk affect net interest margin (Maudos
and De Guevera, 2004). This conclusion was also reached in many
different studies (Ho and Saunders, 1981), (McShane and Sharpe,
1985), (Hanweck and Ryu, 2005), (Marinkovic and Radovic,
2010), (Memmel and Schertler, 2011). Nonetheless, Nassar
et al. (2014) and Demirguc-Kunt et al. (2003) made the different
conclusion by using the same method. Moreover, Burgstaller
concluded that there is a relationship between gross domestic
product (GDP) growth rate and net interest margin (Burgstaller,
2006).
In addition to these studies, there are also some studies related to
this subject in Turkey. Erol made a study related to the determinants
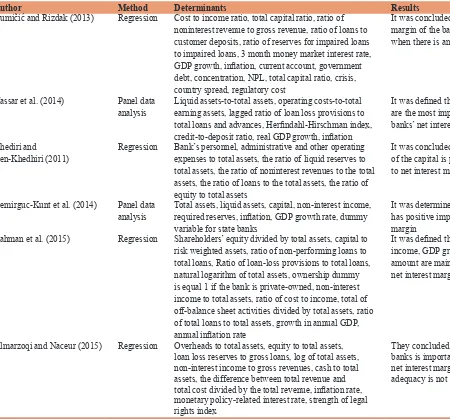
Author Method Determinants Results
Dumičić and Rizdak (2013) Regression Cost to income ratio, total capital ratio, ratio of noninterest revenue to gross revenue, ratio of loans to customer deposits, ratio of reserves for impaired loans to impaired loans, 3 month money market interest rate, GDP growth, inflation, current account, government debt, concentration, NPL, total capital ratio, crisis, country spread, regulatory cost
It was concluded that net interest margin of the banks decreases when there is an increase in NPL
Nassar et al. (2014) Panel data
analysis Liquid assets-to-total assets, operating costs-to-total earning assets, lagged ratio of loan loss provisions to total loans and advances, Herfindahl-Hirschman index, credit-to-deposit ratio, real GDP growth, inflation
It was defined that operating costs are the most important drivers of banks’ net interest margins
Khediri and
Ben-Khedhiri (2011) Regression Bank’s personnel, administrative and other operating expenses to total assets, the ratio of liquid reserves to total assets, the ratio of noninterest revenues to the total assets, the ratio of loans to the total assets, the ratio of equity to total assets
It was concluded that the amount of the capital is positively related to net interest margin
Demirguc-Kunt et al. (2014) Panel data
analysis Total assets, liquid assets, capital, non-interest income, required reserves, inflation, GDP growth rate, dummy variable for state banks
It was determined that inflation has positive impact on net interest margin
Rahman et al. (2015) Regression Shareholders’ equity divided by total assets, capital to risk weighted assets, ratio of non-performing loans to total loans, Ratio of loan-loss provisions to total loans, natural logarithm of total assets, ownership dummy is equal 1 if the bank is private-owned, non-interest income to total assets, ratio of cost to income, total of off-balance sheet activities divided by total assets, ratio of total loans to total assets, growth in annual GDP, annual inflation rate
It was defined that non-interest income, GDP growth and NPL amount are main determinants of net interest margin
Almarzoqi and Naceur (2015) Regression Overheads to total assets, equity to total assets, loan loss reserves to gross loans, log of total assets, non-interest income to gross revenues, cash to total assets, the difference between total revenue and total cost divided by the total revenue, inflation rate, monetary policy-related interest rate, strength of legal rights index
They concluded that the size of the banks is important determinant of net interest margin whereas capital adequacy is not
of net interest margin in Turkish banks. In this study, the data for
the period between 2003 and 2006 was used. As a result of panel
data analysis, it was determined that there is a positive relationship
between capital amount and net interest margin in Turkish banks
(Erol, 2007). Göçmen tried to analyze the determinants of net
interest margin in Turkish banking sector. Within this context, the
data for the years between 1990 and 2000 was tested. As a result
of the analysis it was determined that there is inverse relationship
between net interest margin and high inflation rates. Furthermore,
it was also defined that net interest margin decreases during the
crisis period (Göçmen, 2005).
Furthermore, Tunay and Silpar made a study to examine the
influencing factors of profitability of the banks. With respect to
the profitability, return on equity, return on asset and net interest
margin was used in this study. Furthermore, the data for the period
between 1960 and 2004 was used in order to achieve the objective.
As a result of regression analysis, it was defined that total assets
and total loans are the main determinants of net interest margin
(Tunay and Silpar, 2006). Türkey Kaya tried to create a model
related to the determinants of net interest margin for Turkish
banking sector. So as to achieve this objective, monthly data for
the period between 1986 and 2000 was used in this study. It was
concluded that any deficit in current account balance causes net
interest margin to increase (Türker-Kaya, 2001).
3. RESEARCH AND APPLICATION: TURKISH
BANKING SECTOR
3.1. Data
The aim of the study is to define the determinants of net interest
margin of the banks located in Turkey. Because of this situation,
we used quarterly data for the years between 2003 and 2015. The
data was provided from Turkish Banking Association, OECD,
Central Bank of Turkey and Turkish Statistical Institute. Moreover,
all banks of Turkey were included in the study.
3.2. Analysis Method: MARS
MARS method was produced by Jerome Friedman in 1991.
“Multivariate” refers that a lot of explanatory variables can be
used by using this method. Moreover, the term of “adaptive” means
that MARS method presents us the best model by choosing this
model among many alternatives. In addition to them, the word
of “regression” demonstrates that this method is used in order
analyze the relationship between dependent variable and a series
of independent variables. Furthermore, instead of creating a simple
regression line, MARS method uses “smoothing splines” so as to
define this relationship more accurately (Friedman, 1991). The
equation of MARS method is shown below.
Y=B + a B X +µ
0 n=1K
n n t
∑
( )
(1)
In this equation, “Y” refers to independent variable whereas
“X” shows dependent variable. In addition to them, “B0” is
the constant term and “an” shows the coefficient of the basis
function. Moreover, “ε” refers to error term of the equation and
“K” demonstrates the number of basis functions.
MARS method has many advantageous in comparison with other
regression methods. First of all, explanatory variables can take
part more than once in equation with different coefficients. This
situation provides to achieve more meaningful results. In addition
to this issue, in MARS method, there is no multicollinearity
problem that demonstrates the relationship among explanatory
variables. Therefore, it can be possible to use a lot of independent
variables in the analysis. Furthermore, different than other
methods, the combinations of independent variables are used
in MARS method in order to reach more meaningful results
(Friedman, 1991).
The process of creating model by using MARS method included
2 different stages. First of all, system produces all basis functions
which mean all potential functions created by independent
variables. The model that has maximum basis functions is also
called as “the most complex model.” The second stage is obtaining
the best model from the most complex model. In this stage, system
eliminates some basis functions that have highest error value
generalized cross validation (GCV). In other words, the best model
has the highest R
2and lowest GCV values (Friedman, 1991).
By creating model, some data should be embedded to MARS
system. The space of “the maximum amount of basis functions”
should be completed with numbers that are between 0 and 250.
Moreover, the number between 1 and 5 should be entered to
“volume factor” that is negatively correlated with the meaningful
of the model. Furthermore, the space of “maximum interaction
among variables” should be completed. This space gives
information about the maximum number of explanatory variables
that can be interacted each other at the same time (Friedman, 1991).
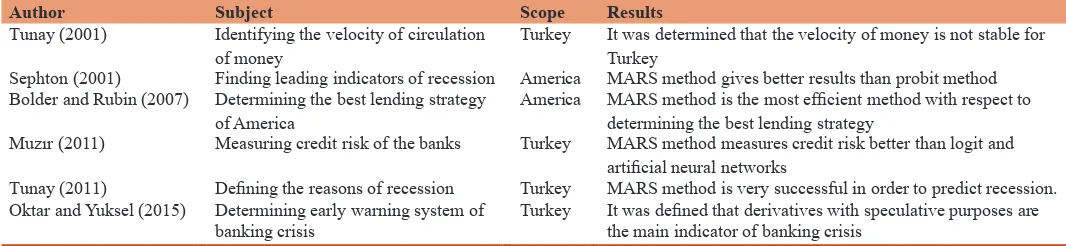
Because MARS is a very new model, there are not many studies
about economics and finance by using this method. Some studies
related to these majors are depicted on Table 2.
Bolder and Rubin made a study in order to define the best lending
strategy for America. In order to achieve this purpose, they used
4 different methods, which are least square method, Kernel
regression, projection pursuit regression and MARS method. As a
result of the analysis, it was determined that MARS method gives
the best result among these methods as for the lending strategy
(Bolder and Rubin, 2007).
Muzır tried to create a model regarding credit risk of Turkish
banks. Within this scope, quarterly data of 38 banks for the period
between 2002 and 2009 was used in this study. He used 3 different
methods, which are logit, artificial neural networks and MARS
so as to achieve this objective. As a result of the analysis, it was
defined that short term loans are the most important determinant
of the credit risk (Muzir, 2011).
Oktar and Yüksel made a study in order to determine the early
warning signals of banking crisis in Turkey. Within this context,
quarterly data for the years between 1988 and 2014 was tested by
using MARS method. According to the results of this analysis, it
was determined that derivatives with speculative purposes are the
most important early warning signal of banking crises occurred in
order to identify the reasons of the recession in Turkey. So as to
achieve this objective, quarterly data for the periods between 1986
and 2010 was used in this study. As a result, it was determined
that oil prices and industry production index are main reasons of
recession occurred in Turkey (Tunay, 2011).
Tunay made also another study in order to identify the velocity
of money in Turkey by using MARS method. So as to achieve
this objective, quarterly data for the periods between 1978
and 2000 was used in this study. As a result of the analysis by
using MARS method, it was determined that the velocity of
money is not stable for Turkey. Another result of this study is
that inflation is the main reason of this problem (Tunay, 2001).
Sephton tried to find the leading indicators of the recession for
America. He used both MARS and probit methods in order to
achieve this objective. Moreover, monthly data for the years
between 1960 and 1999 was used in this study. As a result, it
was defined that MARS method gives better results than probit
method (Sephton, 2001).
3.3. Variables
3.3.1. Dependent variable: Net interest margin of the banks
So as to analyze the determinants of net interest margin in Turkish
banking sector, the ratio of net interest income to total assets is
used as dependent variable.
3.3.2. Independent variables
In order to define the factor that affect net interest margin, we used
14 independent variables. The list of the dependent variables is
depicted on Table 3.
As it can be seen from Table 3, we used 14 different independent
variables. Out of these variables, 9 of them are related to the
internal process of the banks whereas 5 of them are external
variables.
3.3.3. Internal variables
3.3.3.1. Equity
If the equity amount is high for a bank, this situation represents
us that this bank has higher amount of sources to give credit. In
other words, this banks needs to lower amount of external funding.
Because of this situation, the bank will pay less interest for its
sources. Therefore, the relationship between the equity amount
of the bank and net interest margin is expected to be positive.
3.3.3.2. Loans
If the ratio of loans to assets increases, this means that the interest
income from the loans will also go up. Because net interest margin
is the difference between interest income and interest expense, it
is expected to have direct relationship between loans amount and
net interest margin.
3.3.3.3. Loan loss provisions
The loan loss provision amount demonstrates the expense of
the banks for the loans that are expected to be non-performing.
Therefore, there should be negative relationship between this
amount and net interest margin.
3.3.3.4. Liquidity ratio
If the banks has high amount of liquidity ratio, this means that the
bank does not use this amount as a loan. That is to say, this bank
does not get interest income from these liquid assets. Due to this
situation, there should be negative relationship between liquidity
ratio and net interest margin.
3.3.3.5. Non-performing loans
Because non-performing loans are defined as the loans that cannot
be paid back buy the customers, interest incomes of the banks
will be lower when NPL amount is high. Hence, it is expected
to have negative relationship between net interest margin and
NPL amount.
3.3.3.6. Total assets
Because net interest margin is directly related to the quality of
total assets, there are different results in the literature with respect
to the relationship between net interest margin and total assets. In
other words, this relationship differs by depending on the quality
of total assets.
3.3.3.7. Total deposits
If the deposit amount of the bank is high, this issue demonstrates
that this bank pays high interest to these deposits. Because the
interest expenses go up, net interest margin will decrease.
3.3.3.8. Net profit
The profits of the banks mostly come from interest income.
Therefore, there should be positive relationship between net profit
and net interest margin.
Table 2: Studies with MARS method in economies and finance
Author Subject Scope Results
Tunay (2001) Identifying the velocity of circulation
of money Turkey It was determined that the velocity of money is not stable for Turkey Sephton (2001) Finding leading indicators of recession America MARS method gives better results than probit method Bolder and Rubin (2007) Determining the best lending strategy
of America America MARS method is the most efficient method with respect to determining the best lending strategy Muzır (2011) Measuring credit risk of the banks Turkey MARS method measures credit risk better than logit and
artificial neural networks
Tunay (2011) Defining the reasons of recession Turkey MARS method is very successful in order to predict recession. Oktar and Yuksel (2015) Determining early warning system of
Independent
variables Definition Expected relationship with net interest margin
References
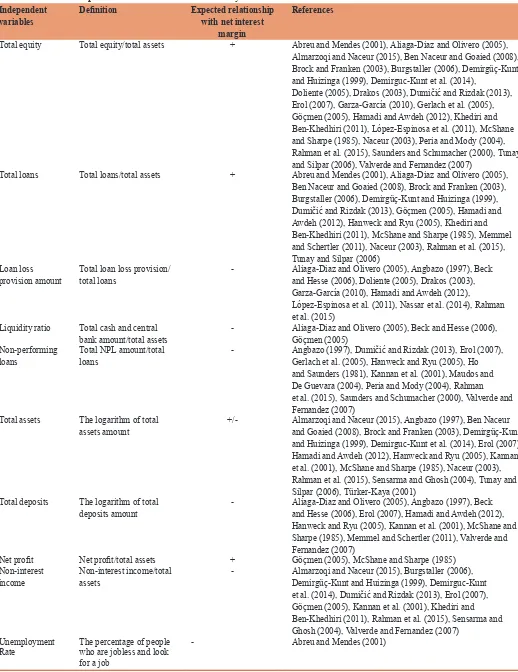
Total equity Total equity/total assets + Abreu and Mendes (2001), Aliaga-Diaz and Olivero (2005), Almarzoqi and Naceur (2015), Ben Naceur and Goaied (2008), Brock and Franken (2003), Burgstaller (2006), Demirgüç-Kunt and Huizinga (1999), Demirguc-Kunt et al. (2014),
Doliente (2005), Drakos (2003), Dumičić and Rizdak (2013), Erol (2007), Garza-García (2010), Gerlach et al. (2005), Göçmen (2005), Hamadi and Awdeh (2012), Khediri and Ben-Khedhiri (2011), López-Espinosa et al. (2011), McShane and Sharpe (1985), Naceur (2003), Peria and Mody (2004), Rahman et al. (2015), Saunders and Schumacher (2000), Tunay and Silpar (2006), Valverde and Fernandez (2007)
Total loans Total loans/total assets + Abreu and Mendes (2001), Aliaga-Diaz and Olivero (2005), Ben Naceur and Goaied (2008), Brock and Franken (2003), Burgstaller (2006), Demirgüç-Kunt and Huizinga (1999), Dumičić and Rizdak (2013), Göçmen (2005), Hamadi and Awdeh (2012), Hanweck and Ryu (2005), Khediri and Ben-Khedhiri (2011), McShane and Sharpe (1985), Memmel and Schertler (2011), Naceur (2003), Rahman et al. (2015), Tunay and Silpar (2006)
Loan loss
provision amount Total loan loss provision/total loans - Aliaga-Diaz and Olivero (2005), Angbazo (1997), Beck and Hesse (2006), Doliente (2005), Drakos (2003), Garza-García (2010), Hamadi and Awdeh (2012),
López-Espinosa et al. (2011), Nassar et al. (2014), Rahman et al. (2015)
Liquidity ratio Total cash and central
bank amount/total assets - Aliaga-Diaz and Olivero (2005), Beck and Hesse (2006), Göçmen (2005) Non-performing
loans Total NPL amount/total loans - Angbazo (1997), Dumičić and Rizdak (2013), Erol (2007), Gerlach et al. (2005), Hanweck and Ryu (2005), Ho and Saunders (1981), Kannan et al. (2001), Maudos and De Guevara (2004), Peria and Mody (2004), Rahman et al. (2015), Saunders and Schumacher (2000), Valverde and Fernandez (2007)
Total assets The logarithm of total
assets amount +/- Almarzoqi and Naceur (2015), Angbazo (1997), Ben Naceur and Goaied (2008), Brock and Franken (2003), Demirgüç-Kunt and Huizinga (1999), Demirguc-Kunt et al. (2014), Erol (2007), Hamadi and Awdeh (2012), Hanweck and Ryu (2005), Kannan et al. (2001), McShane and Sharpe (1985), Naceur (2003), Rahman et al. (2015), Sensarma and Ghosh (2004), Tunay and Silpar (2006), Türker-Kaya (2001)
Total deposits The logarithm of total
deposits amount - Aliaga-Diaz and Olivero (2005), Angbazo (1997), Beck and Hesse (2006), Erol (2007), Hamadi and Awdeh (2012), Hanweck and Ryu (2005), Kannan et al. (2001), McShane and Sharpe (1985), Memmel and Schertler (2011), Valverde and Fernandez (2007)
Net profit Net profit/total assets + Göçmen (2005), McShane and Sharpe (1985) Non-interest
income Non-interest income/total assets - Almarzoqi and Naceur (2015), Burgstaller (2006), Demirgüç-Kunt and Huizinga (1999), Demirguc-Kunt et al. (2014), Dumičić and Rizdak (2013), Erol (2007), Göçmen (2005), Kannan et al. (2001), Khediri and Ben-Khedhiri (2011), Rahman et al. (2015), Sensarma and Ghosh (2004), Valverde and Fernandez (2007)
Unemployment
Rate The percentage of people who are jobless and look for a job
- Abreu and Mendes (2001)
Table 3: Lists of independent variables used in this study
3.3.3.9. Non-interest income
Banks can generate income both from interest and non-interest
sources. The main source of non-interest income for banks is foreign
exchange income. In case of decrease in the margin of net interest,
volatility in the market also goes down. Therefore, it is believed that
when net interest margin is small, banks try to have incomes from
non-interest sources. In other words, it is expected to have negative
relationship between net interest margin and non-interest income.
3.4. Internal Variables
3.4.1. Unemployment rate
When unemployment rate in the country is high, this means that
there are many people in the country that do not get any revenue.
If these people cannot pay the loans back to the banks,
non-performing loans of the banks will rise. Thus, it is expected to
have negative relationship between unemployment rate and net
interest margin.
3.4.2. Inflation rate
When inflation rate is high in a country, it will lead to increase in
interest rates as well. Therefore, positive relationship expected
between inflation rate and net interest margin.
3.4.3. Exchange rate
The volatility of exchange rates is a significant indicator of
market risk for a country. If this rate increases very high, banks
that have open position will get losses. Because of this situation,
there should be inverse relationship between exchange rate and
net interest margin.
3.4.4. GDP growth
GDP growth rate is an essential indicator of economic condition
of the country. If economy is in the recession, unemployment
rates will go up and investments in this country decline. This
situation causes to decrease the profit of the banks. Therefore,
we expect positive relationship between net interest margin and
GDP growth rate.
Interest Rate: Interest rate in the market also affects net interest
margin. In case of high market interest rates, margin between
interest income and interest expense is expected to increase.
4. RESULTS
First of all, with respect to the stationary analysis, 14 explanatory
variables were tested by using Augmented Dickey Fuller (ADF)
unit root test. For this analysis, Eviews7 program was used. The
results of this analysis were depicted on Table 4.
In order for the variables to be stationary, ADF unit root test
results should be <0.05. If this condition is not satisfied, the
first differences of these variables are created and the same test
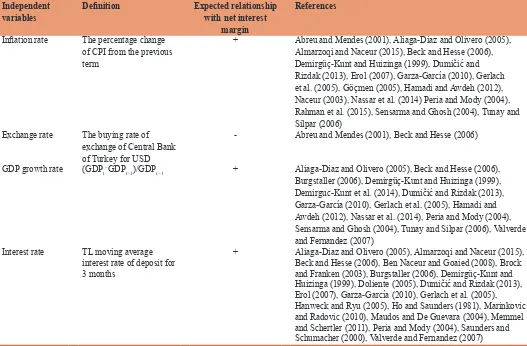
Independentvariables Definition Expected relationship with net interest margin
References
Inflation rate The percentage change of CPI from the previous term
+ Abreu and Mendes (2001), Aliaga-Diaz and Olivero (2005), Almarzoqi and Naceur (2015), Beck and Hesse (2006), Demirgüç-Kunt and Huizinga (1999), Dumičić and Rizdak (2013), Erol (2007), Garza-García (2010), Gerlach et al. (2005), Göçmen (2005), Hamadi and Awdeh (2012), Naceur (2003), Nassar et al. (2014) Peria and Mody (2004), Rahman et al. (2015), Sensarma and Ghosh (2004), Tunay and Silpar (2006)
Exchange rate The buying rate of exchange of Central Bank of Turkey for USD
- Abreu and Mendes (2001), Beck and Hesse (2006)
GDP growth rate (GDPt−GDPt−1)/GDPt−1 + Aliaga-Diaz and Olivero (2005), Beck and Hesse (2006),
Burgstaller (2006), Demirgüç-Kunt and Huizinga (1999), Demirguc-Kunt et al. (2014), Dumičić and Rizdak (2013), Garza-García (2010), Gerlach et al. (2005), Hamadi and Awdeh (2012), Nassar et al. (2014), Peria and Mody (2004), Sensarma and Ghosh (2004), Tunay and Silpar (2006), Valverde and Fernandez (2007)
Interest rate TL moving average interest rate of deposit for 3 months
+ Aliaga-Diaz and Olivero (2005), Almarzoqi and Naceur (2015), Beck and Hesse (2006), Ben Naceur and Goaied (2008), Brock and Franken (2003), Burgstaller (2006), Demirgüç-Kunt and Huizinga (1999), Doliente (2005), Dumičić and Rizdak (2013), Erol (2007), Garza-García (2010), Gerlach et al. (2005), Hanweck and Ryu (2005), Ho and Saunders (1981), Marinkovic and Radovic (2010), Maudos and De Guevara (2004), Memmel and Schertler (2011), Peria and Mody (2004), Saunders and Schumacher (2000), Valverde and Fernandez (2007) Source: Authors, GDP: Gross domestic product
is performed again. As it can be seen from Table 4, out of 14
independent variables, 5 of them are stationary with their original
levels. On the other hand, because the test results of other 9
variables are >0.05, the first difference of these variables were
created and used in the model.
After this analysis, a model was created for the net interest margin
of Turkish banks. For this process, MARS 2.0 program of Salford
Company was used. The maximum number of basis functions was
selected as 30 in this analysis in order to have more meaningful
results. In addition to this situation, the number of minimum
interactions among independent variables was defined as 3 so as
for the model not to be more complex.
Furthermore, penalty on added variables was not selected as
emphasized by the owner of the program. Moreover, the number
of minimum observations between knots was selected as 2. In
other words, there should be at least 2 observations in order for
a point to be accepted as knot. As a result of the analysis, 11
different models were created by MARS program. The details of
these models were shown on Table 5.
The model at the bottom of Table 5 is called as “starting model.” It
has one basic function and 1 variable. All meaningful combinations
of independent variables were added to this starting model by
MARS. According to the criteria given to the system, 11 different
models were created. The model, which is at the top of the table,
is called “the most complicated model.” This model has the most
basis functions and variables.
Furthermore, some basis functions were eliminated from the most
complicated model according to their GCV and GCV R-Square
values. In other words, if GCV value decreases and GCV R
2value
increases when a basis function is not included, this basis function
will be eliminated. By making this elimination, the system
determined “the best model.” As it can be seen from Table 5, the
model, which has 5 basis functions and 4 different variables, is
the best model in our study. The details of the best model were
illustruted on the Appendix. This model has the lowest GCV value
and highest GCV R
2value among all models. The results of the
best model are explained in Table 6.
As a result of the analysis, it was defined that p values of all variables
are less than 0.05. This situation shows us that all of the variables
are statistically significant at 5% level. The result of F test also
demonstrates that the model is also statistically significant. Moreover,
the value of adjusted R
2is 0.730. This value refers that independent
variables can explain 73% of the dependent variable. The details of
the basis functions stated in the best model are explained in Table 7.
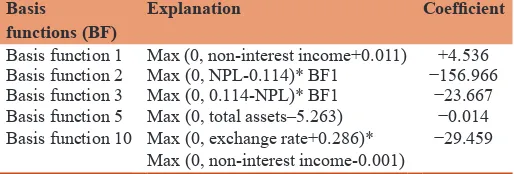
There are 5 different basis functions in our model. In addition to this
situation, it was determined that 4 independent variables affect net
interest margin of Turkish banks. Non-interest income is the first
determinant of net interest margin in our model. This explanatory
variable takes place in 4 different basis functions. Although the
coefficient of basis function 1 is positive, the coefficients of other
3 basis functions (BF2, BF3, BF10) are negative. Moreover, the
absolute values of negative coefficients (−156.966, −23.667,
−29.459) is much higher than the coefficient of BF1. Because of
this situation, it was defined that there is a negative relationship
between non-interest income and net interest margin.
Table 4: Results of ADF unit root tests
Independent variables Unit root test results Original data First difference
Equity/total assets 0.1007 0.0000
Loans/total assets 0.7499 0.0000
Loan loss provision/total loans 0.4574 0.0001
Liquidity ratio 0.0612 0.0000
NPL/total loans 0.0402
-Total assets 0.0404
-Total deposits 0.0400
-Net profit 0.6562 0.0000
Non-interest income 0.3207 0.0018 Unemployment rate 0.3997 0.0064
Inflation rate 0.0003
-Exchange rate 0.9893 0.0000
GDP growth 0.0002
-Interest rate 0.0710 0.0003
Sources: Authors, ADF: Augmented Dickey Fuller, GDP: Gross domestic product
Table 5: Results of all models
Basis functions Total variables GCV GCV R2
11 7 0.000151 0.067
10 7 0.000132 0.187
9 7 0.000113 0.307
8 6 0.000098 0.391
7 6 0.000089 0.449
6 5 0.000084 0.478
5** 4 0.000081 0.496
4 3 0.000084 0.482
3 2 0.000096 0.403
2 2 0.000106 0.346
1 1 0.000098 0.395
Sources: Authors, GCV: Generalized cross validation
Table 6: Results of the best model
Variables Coefficient Standard error t-test P
Constant term 0.013 0.003 4.109 0.000 Basis function 1 4.536 0.578 7.846 0.000 Basis function 2 −156.966 28.604 −5.487 0.000 Basis function 3 −23.667 6.909 −3.425 0.001 Basis function 5 −0.014 0.004 −3.132 0.001 Basis function 10 −29.459 5.616 −5.246 0.000 Observation
R2
Adj R2
GCV 51 0.757 0.730 0.015 F Test P Total variables
GCV R2
28.101 [0.000] 0.000
4 0.496 Sources: Authors, GCV: Generalized cross validation
Table 7: Explanation of basis functions
Basisfunctions (BF) Explanation Coefficient
Basis function 1 Max (0, non-interest income+0.011) +4.536 Basis function 2 Max (0, NPL-0.114)* BF1 −156.966 Basis function 3 Max (0, 0.114-NPL)* BF1 −23.667 Basis function 5 Max (0, total assets–5.263) −0.014 Basis function 10 Max (0, exchange rate+0.286)*
Non-performing loan is another independent variable that affects
net interest margin. This explanatory variable takes place in BF2
and BF3. Both of these functions have negative coefficients.
Therefore, it was identified that when the ratio of NPL to total
loans increases, net interest margin of the banks decreases.
Another result related to this variable is that the effect of the
coefficient of BF2 (−156.966) is higher than the coefficient of
BF3 (−23.667). In other words, it was defined that when the
ratio of NPL to total loans is >0.114, net interest margin goes
down more.
According to the results of the analysis, net interest margin
decreases when the logarithm of total asset is >5.263. This
inverse relationship shows that when total assets of the banks
exceed a level, the quality of these assets decreases. The last
independent variable that affects net interest margin is exchange
rate. The negative coefficient (−29.459) demonstrates that when
the exchange rate of USD increases net interest margin goes
down. That is to say when the volatility of the exchange rate rises,
there will be also increase in the losses and this situation causes
net interest margin to decrease. The importance levels of these 4
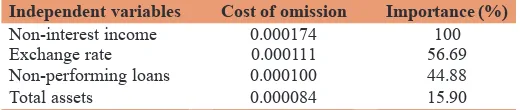
independent variables are depicted in Table 8.
As it can be seen from Table 8, non-interest income is the most
important variable that affects net interest margin of Turkish
banks. The importance of this variable is 100% and the cost of
omission is the highest. In addition to this issue, exchange rate is
the second most significant variable with the 56.69% importance
level. Moreover, non-performing loan has 44.88% and total asset
has 15.90% importance levels. As a result of this analysis, the
equation created from this model is the following.
Y = 0.013+4.536* BF1−156.966* BF2−23.667* BF3−0.014*
BF5−29.459* BF10
(2)
5. CONCLUSIONS
In this study, we tried to identify the influencing factors of net
interest margin in Turkish banking sectors. Within this context,
quarterly data for the period between 2003 and 2014 was used in
this study. In addition to this situation, the effects of 14 independent
variables on net interest margin were tested by using MARS model
in order to achieve this objective.
First of all, with respect to the stationary analysis, we made
ADF unit root test to all independent variables so as to use their
stationary forms. As a result of this analysis, it was determined that
5 of these variables are stationary whereas 9 independent variables
were not. Therefore, the first differences of these variables were
used in the study.
After stationary analysis, we created a model by using MARS
program. During this process, totally 11 different models were
created and 1 model was chosen as the best model by MARS
program. According to the best model, 4 independent variables
affect net interest margin of Turkish banks. Firstly, it was defined
that there is a negative relationship between non-interest income
and net interest margin. That is to say, when the margin in net
interest increases, the volatility in the market also goes up. In such
a risky situation, there is a decrease in foreign exchange income
which is the main component of non-interest income.
Furthermore, non-performing loan is another independent variable
that affects net interest margin negatively. Because the banks have
lower interest income in case of high NPL, net interest income
will go down. Moreover, it was determined that net interest
margin decreases when the logarithm of total asset is higher. This
result shows that when total assets of the banks exceed a level,
the quality of them decreases. Additionally, exchange rate is also
another variable that affects net interest margin for Turkish banks
negatively. This situation demonstrates that increase in the volatility
of the exchange rate leads to unfavorable results in banking sector.
REFERENCES
Abreu, M., Mendes, V. (2001), Commercial bank interest margins and profitability: Evidence for some EU countries. In: Pan-European Conference Jointly Organized by the IEFS-UK & University of Macedonia Economic & Social Science. Thessaloniki, Greece, May. p17-20.
Aliaga-Dıaz, R., Olivero, M.P. (2005), The cyclical behavior of net interest margins: Evidence from the United States banking sector. Raleigh, NC: North Carolina State University.
Almarzoqi, R., Naceur, M.S.B. (2015), Determinants of Bank Interest Margins in the Caucasus and Central Asia (No. 15-87). International Monetary Fund.
Angbazo, L. (1997), Commercial bank net interest margins, default risk, interest-rate risk, and off-balance sheet banking. Journal of Banking and Finance, 21(1), 55-87.
Beck, T., Hesse, H. (2006), Bank Efficiency, Ownership, and Market Structure: Why are Interest Spreads So High in UGANDA? World Bank Policy Research Working Paper, 4027.
Bennaceur, S., Goaied, M. (2008), The determinants of commercial bank interest margin and profitability: Evidence from Tunisia. Frontiers in Finance and Economics, 5(1), 106-130.
Bolder, D.J., Rubin, T. (2007), Optimization in a Simulation Setting: Use of Function Approximation in Debt Strategy Analysis. Available from: http://www.SSRN 1082840.
Brock, P., Franken, H. (2003), Measuring the determinants of average and marginal bank interest rate spreads in Chile, 1994-2001. Economía Chilena, 6(3), 45-65.
Burgstaller, J. (2006), The Cyclicality of Interest Rate Spreads in Austria: Evidence for a Financial Decelerator? (No. 0602). Working Paper, Department of Economics, Johannes Kepler University of Linz. Demirgüç-Kunt, A., Huizinga, H. (1999), Determinants of commercial
bank interest margins and profitability: Some international evidence. The World Bank Economic Review, 13(2), 379-408.
Demirguc-Kunt, A., Laeven, L., Levine, R. (2003), Regulations, Market Structure, Institutions, and the Cost of Financial Intermediation (No. w9890). National Bureau of Economic Research.
Doliente, J.S. (2005), Determinants of bank net interest margins in Southeast Asia. Applied Financial Economics Letters, 1(1), 53-57.
Table 8: Importance levels of independent variables
Independent variables Cost of omission Importance (%) Non-interest income 0.000174 100
Exchange rate 0.000111 56.69
Non-performing loans 0.000100 44.88
Total assets 0.000084 15.90
Drakos, K. (2003), Assessing the success of reform in transition banking 10 years later: An interest margins analysis. Journal of Policy Modeling, 25(3), 309-317.
Dumičić, M., Rizdak, T. (2013), Determinants of banks’ net interest margins in central and Eastern Europe. Financial Theory and Practice, 37(1), 1-30.
Erol, H. (2007), Bankalarda net Faiz Marjının Belirleyicileri, Risk Duyarlılığı ve Politika Önerileri. Uzmanlık Yeterlilik Tezi. Ankara: Türkiye Cumhuriyet Merkez Bankası.
Friedman, J.H. (1991), Multivariate adaptive regression splines. The Annals of Statistics, 19, 1-67.
Garza-García, J.G. (2010), What influences net interest rate margins? Developed versus developing countries. Banks and Bank Systems, 5(4), 32-41.
Gerlach, S., Peng, W., Shu, C. (2005), Macroeconomic Conditions and Banking Performance in Hong Kong SAR: A Panel Data Study, 481. Press& Communications CH-4002 Basel, Switzerland E-mail: Publications@ bis. org Fax:+ 41 61 280 9100 and+ 41 61 280 8100 This Publication is Available on the BIS Website. Available from: http://www.www bis org.
Göçmen, G. (2005), Bankacılık Sektöründe Net Faiz Marjını Belirleyen Faktörler: Türkiye Uygulaması (1990-2000). (Doctoraldissertation, Sosyal Bilimler).
Hamadi, H., Awdeh, A. (2012), The determinants of bank net interest margin: Evidence from the Lebanese banking sector. Journal of Money, Investment and Banking, 23(3), 85-98.
Hanweck, G.A., Ryu, L.H. (2005), The Sensitivity of Bank Net Interest Margins and Profitability to Credit, Interest-rate, and Term-structure Shocks Across Bank Product Specializations. Washington, DC: Federal Deposit Insurance Corporation.
Ho, T.S., Saunders, A. (1981), The determinants of bank interest margins: The ory and empirical evidence. Journal of Financial and Quantitative analysis, 16(04), 581-600.
Islam, S., Nishiyama, S.I. (2015), The Determinants of Bank Net Interest Margins: A Panel Evidence from South Asian Countries. Tohoku Economics Research Group. Discussions Paper, 328.
Kannan, R., Narain, A., Ghosh, S. (2001), Determinants of net interest margin under regulatory requirements: An econometric study. Economic and Political Weekly, 36 (4), 337-344.
Khediri, K., Ben-Khedhiri, H. (2011), Determinants of bank net interest margin in Tunisia: A panel data model. Applied Economics Letters, 18(13), 1267-1271.
López-Espinosa, G., Moreno, A., de Gracia, F.P. (2011), Banks’ net interest margin in the 2000s: A macro-accounting international perspective. Journal of International Money and Finance, 30(6), 1214-1233. Marinkovic, S., Radovic, O. (2010), On the determinants of interest
margin in transition banking: The case of Serbia. Managerial Finance, 36(12), 1028-1042.
Maudos, J., De Guevara, J.F. (2004), Factors explaining the interest margin
in the banking sectors of the European Union. Journal of Banking and Finance, 28(9), 2259-2281.
McShane, R.W., Sharpe, I.G. (1985), A time series/cross section analysis of the determinants of Australian trading bank loan/deposit interest margins: 1962–1981. Journal of Banking and Finance, 9(1), 115-136. Memmel, C., Schertler, A. (2011), Banks’ Management of the Net Interest
Margin: Evidence from Germany. Available from: http://www.SSRN 1944140.
Muzir, E. (2011), Basel II Düzenlemeleri Doğrultusunda Kredi Riski Analizi ve Ölçümü: Geleneksel Ekonometrik Modellerin Yapay Sinir Ağları ve MARS Modelleriyle Karşılaştırılmasına Yönelik Ampirik Bir Çalışma. İstanbul Üniversitesi Sosyal Bilimler Enstitüsü, Yayınlanmamış Doktora Tezi.
Naceur, S.B. (2003), The Determinants of the Tunisian Banking Industry Profitability: Panel Evidence. Universite Libre de Tunis Working Papers.
Nassar, K.B., Martinez, E., Pineda, A. (2014), Determinants of Banks’ Net Interest Margins in Honduras (No. 14-163). International Monetary Fund.
Oktar, S., Yüksel, S. (2015), Bankacılık krizlerinin erken uyari sinyalleri: Türkiye üzerine bir uygulama. İstanbul Ticaret Üniversitesi Sosyal Bilimler Dergisi (İlker Parasız Özel Eki), 14(28), 37-53.
Peria, M.S.M., Mody, A. (2004), How foreign participation and market concentration impact bank spreads: Evidence from Latin America. Journal of Money, Credit and Banking, 36(3), 511-537.
Rahman, M.M., Hamid, M.K., Khan, M.A.M. (2015), Determinants of bank profitability: Empirical evidence from Bangladesh. International Journal of Business and Management, 10(8), 135.
Saunders, A., Schumacher, L. (2000), The determinants of bank interest rate margins: An international study. Journal of International Money and Finance, 19(6), 813-832.
Sensarma, R., Ghosh, S. (2004), Net interest margin: Does ownership matter? Vikalpa: The Journal for Decision Makers, 29(1), 41-47. Sephton, P. (2001), Forecasting recessions: Can we do better on MARS?
Review Federal Reserve Bank of Saint Louis, 83(2), 39-49. Tunay, K.B. (2001), Türkiye’de paranın gelir dolaşım hızlarının MARS
yöntemiyle tahmini. ODTÜ Gelişme Dergisi, 28(3-4), 431-454. Tunay, K.B. (2011), Türkiye’de durgunluklarin MARS yöntemi ile
tahmini ve kestirimi, Marmara Üniversitesi İ.İ.B.F. Dergisi, 30(1), 71-91.
Tunay, K.B., Silpar, A.M. (2006), Türk Ticari Bankacılık Sektöründe Karlılığa Dayalı Performans Analizi-I. Türkiye Bankalar Birliği, Araştırma Tebliğleri Serisi, 1.
Türker-Kaya, Y. (2001), Türk Bankacılık Sisteminde Net Faiz Marjının Modellenmesi. BDDK, Mali Sektör Politikaları Dairesi Çalışma Raporları, 4.
Valverde, S.C., Fernández, F.R. (2007), The determinants of bank margins in European banking. Journal of Banking and Finance, 31(7), 2043-2063.