Issues
ISSN: 2146-4138
available at http: www.econjournals.com
International Journal of Economics and Financial Issues, 2019, 9(2), 162-167.
Impact of Taxes and Fees on the Productivity of the Palestinian
Industrial Sector
Yousef Abdel Jawad*, Shaker Zabada
Department of Economic, An- Najah National University, Nablus, Palestine. *Email: Yousef.abed.1989@hotmail.com
Received: 11 January 2019 Accepted: 27 February 2019 DOI: https://doi.org/10.32479/ijefi.7559
ABSTRACT
The study aimed to determine the effect of taxes and fees on the productivity of the industrial sector in Palestinian case, also in the details at the level of economic activity. To achieve the objectives of this study, the descriptive and quantitative methodology was used. Based on the data of the
economic survey series cross sectional data in 2015 was used and, provided by the Palestinian Central Bureau of Statistics, the ordinary least squares
method was used in regression analysis. The study found that the effect of taxes on the productivity of the industrial sector is small in general and varies according to the nature of the economic activity. This is different from the expectation that the effect of taxes will be negative. This is mainly because the high degree of tax evasion in Palestine while it does not constitute as a burden in other countries.
Keywords: Productivity, Taxes, Fees, Industrial Sector
JEL Classifications: D2, L2, O4, G38
1. INTRODUCTION
The Palestinian economy has been in a special situation. Since 1967, the Israeli authorities have imposed a series of restrictions, represented in land confiscation, settlement construction, water diversion, seizing land and sea crossings and making the
Palestinian economy dependent on it. Palestinian Central Bureau of Statistics (PCBS) (2016) indicates that 83% of Palestinian exports go to Israel, and 58.3% of imports come from Israel.
For a clearer view the main economic indicators in Palestine
for 2015 indicate that gross domestic product (GDP) at constant
prices reached about 7721.72 billion US dollars, While the GDP
per capita is 1745.9 US dollars, the number of employment was 1295.4 thousand people, the unemployment rate reached 25.9%, and the current account deficit by 1712.9 million US dollars, PCBS (2016).
According to the PCBS (2016), the contribution of industrial activities to the GDP is about 13.4%. The percentage of employed
persons in the industrial sector reached 13.7% of the total number
of workers in Palestine. The percentage of establishments
operating in the industrial sector reached 13.5% of the total
institutions operating in Palestine.
The State’s ability to spend on public expenditure and to increase
economic growth depends on the financial resources it has to finance its investments. Taxes are an important tool for the state
to achieve many economic goals. In Palestine, Gross domestic
tax revenues was USD 605.2 million and accounted for 21.5% of total net revenues in 2015, while gross domestic non tax revenues accounted for 8.9%, earmarked collections accounted for 2.0%, total clearance revenues constituted 73.1% of total net revenues in 2015. Since the domestic tax revenues continued to rise from 2007 to 2015 as a result of tax reforms in the area of tax collection
and in line with the Government’s development and reform plan.
According to the data from the Palestinian Monetary Authority, the
financial grants to support the Palestinian authority budget decreased by 43.4% between 2013 and 2015. In order to compensate for the
shortfall and fluctuation in the financial grants provided to support
the PA budget, several means were used, including government
reforms in the field of tax collection, It caused by the rate of tax revenues increased by 25.7% between 2011 and 2015. Palestine Monetary Authority (2017), PCBS (2016).
This increase in taxes may have different economic effects on the productivity of the industrial sector in Palestine, and there is
a need to find the impact of taxes and fees on productivity in the
industrial sector in Palestine.
2. LITERATURE REVIEW
Many financial economists studied the relationship between
corporate income taxes, investment and productivity, and evidence has been found that excessive regulatory and government policies have negative consequences for the business environment and economic development, Since Hall and Jorgenson in 1967, work has been shown that changes in the cost of capital can reasonably explain overall investment, where higher corporate income taxes have had a negative impact on investment by increasing the cost of capital used. Many studies examined the theoretical and empirical interpretations of this relationship, but the studies that deal with the relationship between taxes and productivity were lower than those that examined the relationship between taxes and investment. This is because there is no single measure of productivity. Galindo
and Pombo (2011).
A study by Auerbach and Hines (2001) confirmed that taxes affect productivity, creating distortions by influencing prices and
decision-making for businesses and households, these distortions
lead to the redistribution of inputs within firms or industries that
can have implications for growth. Where any change in the price of a production input can result in a reduction in the use of a production input in a company or industry, so all unused inputs in this company or industry may be reallocated to a less productive
company or industry, or not used at all. Thus reducing efficiency
in the use of production inputs, thereby reducing total factor
productivity (TFP).
In Vartia (2008) analyze the impact of different tax policies
on investment and productivity at the industrial level of the
Organisation for Economic Co-operation and Development (OECD), to examine whether industries are affected differently
by taxation, the study showed that investment responds negatively to the increase in corporate tax rate, The study analyzed potential linkages between taxes and productivity, and examined the hypothesis that taxes affect productivity through different channels, and the study found that high tax-income companies are negatively affected by productivity, while tax incentives for research and development have a positive impact on productivity.
The previous study was combined with a study of Galindo
and Pombo (2011), to analyze the impact of corporate taxes
on investment and productivity. The study used data from 42 developing countries from the World Bank’s business environment surveys, and examined whether companies of different sizes are affected differently by taxes. The study showed that both
investment and productivity responded negatively to increase the corporate tax rate, and these effects were stronger in large companies.
Whereas Hussain (2015), analyzed the impact of change in tax
policy on TFP in the United States. The study showed that the permanent tax increase has a strong, lasting and negative impact
on TFP, which represents about 80% change in output after
increase in tax.
More broadly, study of Everaert et al. (2014) analyzed the impact of fiscal policy on TFP for OECD countries during the period 1970-2012. The results showed that the shift to the transfer of
production expenditure has a positive effect on TFP. Indirectly, there is a positive impact on TFP, by allowing access to global technology, comes through reducing corporate taxes and reducing barriers to international trade.
While the study of Dechezleprêtre and Sato (2017) confirmed
the scope and nature of regulations on economic activity can negatively affect productivity, growth and economic activity. Because of the taxes are an important element in the chart of
regulations that define the business environment, many of the
ideas that have been explored can be brought down to tax policies.
3. METHODOLOGY AND DATA
3.1. Methodology
In this study, the methodology of descriptive and quantitative
analysis will be used. The ordinary least squares (OLS) method
used in data analysis, and the tested from the following variables:
TFP=f(Wages,Capital intensity,TAX Fees)
Where the dependent variable in this study is the TFP in the industrial sector. And the independent variables are:
• Wages: Wages and compensation of workers in the industrial sector. Capital intensity: Ratio of capital to labor in the industrial sector (as an indicator of volume).
• TAX fees: Taxes on income and profits of the enterprise, export
duties, and customs duties.
And by using the SPSS.20 program and the Microsoft Excel
program, raw data will be processed, analyzed and results obtained.
3.2. The Data
The sample of the study was 2512 institutions, covering both the West Bank (61%) and the Gaza Strip (39%), and for a period from 1/1/2015 to 31/12/2015. Thus, the data cross-sectional was
used, distributed across all economic sectors. The source of the
data is the economic survey series for 2015 (PCBS). Covering the
industrial survey, which includes mining and exploitation activities quarries, manufacturing, electricity, gas, steam, air condensation, water supply, sanitation activities and waste management.
3.3. Description of Study Variables
the Palestinian territory, and at the level of economic activity (mining and quarrying, manufacturing, electricity, gas, steam, air
conditioning, water supply, and processing) is necessary.
3.3.1. Description of the study variables at the level of Palestine
The number of establishments operating in Palestine in 2015 reached 135,880 establishments for all economic activities, of which 18056 were operating in the industrial sector. 2512
establishments were selected, representing the industrial sector
in the economic survey series, 66% for the West Bank and 34%
for the Gaza Strip.
From Table1, the average number of workers in the industrial
sector in the Palestinian Territory is about 10 workers, and the worker receives an annual wage of 21206 Israeli shekels while the
working capital density in the Palestinian Territory during the year
2015 reaches 87175, which it means thatthe operating institutions spend an average of87175 NIS on fixed capital in 2015 for every
single worker in the institution.
3.3.2. Description of the study variables at the level of economic activities
The industrial sector is divided into several major economic activities: Mining and quarrying, manufacturing, electricity, gas, steam, air conditioning, water supply, sanitation and waste management and treatment. Each major economic activity involves several economic activities, including mining and quarrying activities for the extraction of marble and granite, salt extraction, precious metal extraction, etc., and includes manufacturing industries on several activities, such as food industry, industry Textiles, fertilizer industry, etc., while the electricity, gas, steam and air conditioning industry includes the generation, transmission and distribution of energy, the sale of electricity to consumers, the production and distribution of chilled air, the production of ice, etc. Sewage and waste management and treatment contains several activities, such as rainwater harvesting activities, water
purification for the purpose of selling, waste collection, wastewater
treatment etc.
The establishments operating in the manufacturing industry in
Palestine are 94.03%, while the establishments are working in drinking water and sanitation, about 3.18%, and about 2.43%
for enterprises engaged in mining and quarrying activities, while institutions operating in the electricity, gas, steam and air
conditioning sectors accounted for 0.36% of the total number of
establishments in the industrial sector.
From Table 2, it is found that the average number of workers in enterprises engaged in mining and quarrying activities and
manufacturing enterprises is about 10 workers per enterprise,
while the average number of workers in enterprises engaged in water supply, sanitation and waste management activities To about
5 workers, and enterprises operating in the activities of electricity
supply, gas, steam and air conditioning, the average number of workers in one institution to 216 workers.
For the average annual wage per worker, workers in the electricity, gas, steam and air conditioning systems receive the highest
annual wage rate of about 40,000 Israeli shekels compared with their counterparts in other activities, and about 28,000 Israeli
shekels as the average annual wage of the worker in mining and quarrying activities, while The annual wage rate of the worker in the manufacturing industries and worker in the water supply, sewage and waste management activities is converged and
processed, with an annual average wage of NIS 20910 and NIS 20413 respectively.
In view of the intensity of fixed capital, electricity, gas, steam and
air conditioning supply activities are the most intensive activities
of fixed capital, followed by enterprises engaged in water supply
activities, sanitation activities, waste management and treatment,
mining and quarrying activities, while the intensity of fixed capital
in manufacturing activities is the lowest.
4. MODEL
The following model was used to study the effect of taxes and fees on the productivity of the industrial sector in Palestine:
TFP=α_0+α_1 Wages+α_2 Capitalintensity+α_3 TAXFees (1)
To give a clearer sight of the effect of the average wages of workers and the average taxes and duties per worker on the productivity of enterprises in the industrial sector, I divided the wages, taxes and fees on the number of employees, taking into account the natural logarithm of variables on both sides, Thus, the model used in this study takes the following form:
Table 1: Statistical description of the study variables at the level of Palestine
Variables Range Mean±SD
Labor 960 10±37
Wage per labor 167625 21206±10753
Capital intensity 5052850 87175±209313
Taxes and fees 4851136 24226±177248
The table was calculated by the researcher, based on the economic survey series data for 2015. *Currency in Israeli Shekel. SD: Standard deviation
Table 2: Statistical description of the study variables at the level of economic activities
Industrial sector Variables Range Mean±SD
Mining and quarrying Labor 60 10±10
Wage per labor 163914 27999±20354
Capital intensity2233364228677±457891
Taxes and fees 47500 6639±9764
Manufacturing industry Labor 750 10±30
Wage per labor 76230 20910±9750
Capital intensity 2541751 76304±151039
Taxes and fees 4851136 24206±177413
Electricity, gas, steam
and air conditioning LaborWage per labor 95763 40011±29271957 216±328 Capital intensity2926136505660±948104
Taxes and fees 2036448 306967±672747
Water supply, sanitation
and waste management LaborWage per labor 90000 20314±15189260 5±29 Capital intensity 5048586 250188±624162
Taxes and fees 430000 6401±48314
ln ln Wages Labor ln
l
TFP Capitalintensity
(
)
= + +
(
)
+
α α α
α
0 1 2
3nn
TAXFees Labor
(2)
Where α1, α2, α3 represent the elasticity of the average wage per worker, the elasticity of the capital intensity, and the elasticity of the average tax or fee per worker, respectively.
And the mathematical expression used in this study to calculate TFP as follows:
Total output labor + capital
TFP= (3)
Where total output represents total production value of establishments operating in the industrial sector. Labor: Paid
workers in the industrial sector. Capital: The value of fixed capital
in the industrial sector.
And TFP was calculated as in Kisi (2015), using the following
mathematical expression:
Total output
Labor + material + equipment + energy + capital
TFP= (4)
However, in this study, the variables (material, equipment, energy) were excluded because the PCBS did not provide these variables
in the industrial survey.
The selection of variables and method of analysis in model (2),
was based on different previous studies, since there are many studies that linked the taxes and productivity, including a study
Galindo and Pombo (2011), which dealt with the impact of taxes on corporate productivity, and Varita (2008) to analyze the impact of tax policies on investment and productivity in firms using the
OLS method. The two studies agreed on the negative impact of taxes on corporate productivity.
Whereas a study Ehrenberg and Smith (2012) examined the
impact of wages on productivity and found that higher wages in the enterprise than wages in the market lead to commitment by employees, which increases their productivity. In addition, an institution that pays higher wages can attract workers with better
quality, experience and skills. And according to Nikulin (2015), he
showed a strong relationship between wages and productivity in
Poland, Czech Republic, Estonia and Hungary. While Duke (2016)
showed that Wage increases are another means of increasing productivity, since employers have few reasons to invest in new capital and increase productivity when real wages stagnate. So, when employers face rising labor costs, they will invest and innovate, which is key to increasing productivity.
While Tasrif (1995) showed the effects of technological changes
on productivity growth in developing countries, using changes in
capital-labor ratio. In addition, the study of Turcotte and Renneson (2014) examined the effect of capital intensity on productivity.
5. RESULTS
To determine the effect of the independent variables on the productivity of the industrial sector at the level of Palestine, and
by using the OLS method, the coefficients of the model were estimated from Equation (2), and the results are shown in Table 3.
Table 3 shows that the productivity of enterprises operating in
the industrial sector is expected to increase by 0.197%, this is
mainly because the high degree of tax evasion in Palestine, and it could be because of the taxes and fees represent pressure on the product to increase productivity, to cover taxes and fees paid, in addition to the large tax evasion in Palestine, Which amounts
to about 70% for 2015, so taxes do not constitute a burden as in
other countries.
On the other hand, when wages per worker are increased by 1%, the productivity of enterprises will increase by 0.311%. This finding is consistent with the Ehrenberg and Smith (2012) study, which
asserts that wage increases lead to commitment by employees. In addition, a higher paying institution can attract workers with better quality, experience and skills.
And it is expected that when the capital intensity increases by 1%, the productivity of institutions will fall by 0.74%. This is due to the
nature of the labor-intensive Palestinian industries in addition to the lack of capital to modernize the industrial sector in Palestine.
To determine the impact of taxes and fees on the productivity of the main activities of the industrial sector in Palestine, the OLS
method was used in the analysis of Equation (2).
Table 4 shows that taxes and fees affect the productivity of manufacturing industries only, where the institutions operating
Table 3: Regression results at the level of the industrial sector in Palestine
Variables Coefficients Standard error t- stat P-value
Ln (Wage per labor) 0.311 0.053 5.810 0.000
Ln (Capital intensity) 0.740 0.022 34.119 0.000
Ln (Tax and fees per labor) 0.197 0.022 9.163 0.000
Intercept 4.475 0.515 8.688 0.000
Observation 2512
R2 0.57
Adjusted R2 0.569
F- Statistics 392.485
Prob.(F- Statistics) 0.000
in the manufacturing industries, constitute about 94% of the
institutions operating in the industrial sector.
To study the effect of taxes and fees on the productivity of
manufacturing industries in Palestine, we analyze Equation (2)
by using the OLS method.
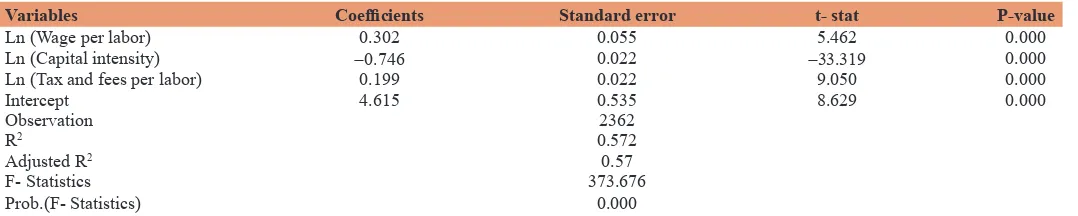
Table 5 shows that if taxes and fees are increased for each worker by 1%, the productivity of enterprises operating in manufacturing will increase by 0.199%, and by 0.302% when the increase in wages per worker by 1%, while productivity decreased by 0.746%, when increasing the capital intensity by 1%.
6. CONCLUSIONS
When increasing the taxes and fees per worker by 10%, productivity in the industrial sector will increase by 1.97% at
the level of Palestine. And on the level of economic activities,
productivity will increase by 1.99% in manufacturing industries, when taxes and fees increase by 10% per worker. These results converge with Duke (2016), which suggests that increasing direct
costs has a positive impact on productivity, when employers face higher costs, they will invest and innovate, a key to increasing productivity. But these results differ with Galindo and Pombo
(2011) and Varita (2008), who note that the increase in taxes has a
negative impact on the productivity of operating institutions. This difference can be explained by the large tax evasion in Palestine,
which reached 70%, so the taxes do not constitute a burden as in
other countries.
From the above, recommendations can be made to decision-makers
to develop prudent fiscal policies aimed at senior taxpayers, and
to reduce tax evasion.
On the other hand, when wages increase by 10% per worker in the industrial sector in Palestine, productivity will increase by 3.11%.
And at the level of economic activities, will increase by 3.02%
in the manufacturing industries when taxes and fees increase by
10% per worker. These results are close to the Ehrenberg and Smith (2012) study, which indicated that the wage increase has a
positive impact on the productivity of the operating institutions. So we can come up with a recommendation to decision-makers to work on incentive wage policies in the industrial sector because of the positive impact on the productivity of the industrial sector
as a whole. The intensity of fixed capital has a negative impact
on the productivity of manufacturing activities in the industrial sector. This is due to the nature of Palestinian industries, which
are labor-intensive rather than fixed capital, in addition to the lack of fixed capital in the Palestinian industrial sector.
REFERENCES
Auerbach, J.A., Hines, R.J. (2001), Taxation and Economic Efficiency. Working Paper 8181, NBER Working Paper Series.
Dechezleprêtre, A., Sato, M. (2017), The impacts of environmental regulations on competitiveness. Review of Environmental Economics and Policy, 11(2), 183-206.
Duke, V.B. (2016), To Rise Productivity, Let’s Raise Wages. Center for
American Progress.
Ehrenberg, R.G., Smith, R.S. (2012), Modern Labor Economics: Theory
and Public Policy. 11th ed. Ithaca, New York: School of Industrial and Labor Relations Cornell University.
Everaert, G., Freddy, H., Ruben, S. (2014), Fiscal Policy and TFP in the OECD: Measuring Direct and in Direct Effects. Working Paper Research. No 274.
Galindo, J.A., Pombo, C. (2011), Corporate taxation, investment and productivity: A firm level estimation. Journal of Accounting and Taxation, 5(7), 185-161.
Hall, R.E., Jorgenson, D.W. (1967), Tax policy and investment behavior. The American Economic Review, 57(3), 391-414.
Hussain, M.S. (2015), The contractionary effects of tax shocks on
productivity: An empirical and theoretical analysis. Journal of
Macroeconomics, 43, 93-107.
Kisi, P.K. (2015), Estimation of Optimal Productivity in Labor-Intensive Table 4: Regression results at the level of the main economic activities in the industrial sector in Palestine
Activities of the industrial sector N R2 Adjusted R2 Standard error of estimate F- statistic Prob. F- statistic
Mining and quarrying 61 0.218 0.137 0.6956 2.694 0.064
Manufacturing industries 2362 0.572 0.570 0.7915 373.676 0.000
Electricity, gas, steam and air conditioning activities 9 0.775 0.437 1.1664 2.292 0.318
Water supply and sanitation activities and waste
management and treatment 80 0.447 0.115 0.8024 1.347 0.359
The table was calculated by the researcher, based on the economic survey series data for 2015. N: Represent the number of establishment in the sample, where the number of industrial establishments in Palestine reached 18056 in 2015
Table 5: Regression results at the level of manufacturing industries in Palestine
Variables Coefficients Standard error t- stat P-value
Ln (Wage per labor) 0.302 0.055 5.462 0.000
Ln (Capital intensity) ‑0.746 0.022 ‑33.319 0.000
Ln (Tax and fees per labor) 0.199 0.022 9.050 0.000
Intercept 4.615 0.535 8.629 0.000
Observation 2362
R2 0.572
Adjusted R2 0.57
F- Statistics 373.676
Prob.(F- Statistics) 0.000
Construction Operations. Construction Systems-Dissertations and
Theses 19.
Nikulin, D. (2015), Relationship between wages, labour productivity
and employment rate in new EU member countries. Journal of
International Studies, 8(1), 31-40.
Palestine Monetary Authority. (2017), Revenues, Expenditures and Financing Sources of PNA Fiscal Operations (Cash Basis). Ramallah,
Palestine: Palestine Monetary Authority.
Palestinian Central Bureau of Statistics. (2016), Performance of the Palestinian Economy, 2015. Ramallah-Palestine.
Palestinian Central Bureau of Statistics. (2016), Registered Foreign Trade
Statistics-Goods and Services, 2015: Main Results. Ramallah-Palestine. Tasrif, M. (1995), Developing Countries Dilemma Labor Intensive
Technological or Capital Intensive? Indonesia: Center for Research
on Energy ITB.
Turcotte, J., Rennison, W.L. (2004), Productivity and Wages: Measuring the Effect of Human Capital and Technology Use from
Linked Employer-Employee Data. Working Paper. Department of Finance.