ECONOMIC DEVELOPMENT – A PREREQUISITE FOR DEMOCRATIZATION
CASE OF KENYA AND UGANDA
Giola Cami,
(MA Candidate) Istanbul Commerce University, TurkeyReceived: April 02, 2018 Accepted: May 30, 2018 Published: June 1, 2018
Abstract
Political changes transforming an authoritarian regime into a democratic one is conditional on the ground of factors inciting the process. Economic development of a country is a prerequisite condition to shape democratic changes in a country - modern democracies have come into existence in economically developed countries. For a non-democratic country to become democratized the structure responsible for the shift of regimes is capitalism - responsible for the distribution of the produced wealth and creates middle class so needed for seeking accountability of governance. Wealthier countries have a predisposition to be “more democratic” which allows the average citizen to have access to resources, unlike “less democratic” regimes where access to resources is limited, not merit based and questionable.
Keywords:
Political changes, structure, capitalism, democratic, resources
1. Introduction
Since XIX-th century to nowadays three waves of democratization, followed by two reverse waves, became the ground work of modern concept of democratization. Twentieth century offers a rich legacy on democratic transitions as the modern states started to take form and alongside the democratization phenomenon described as the Three Waves of Democratization followed with counter waves (Huntingon, 1991), the theoretical approach about the process was to be built. Concept of democracy is nothing new in the process, but now in an explanatory and analytical pattern concept of transition –theoretical frame, conditions required for it to take place and measurement was to be built.
Theoretical approaches in the field of democratization, beside differences, forms what is called ‘‘Paradigm of Transition‘‘, where transition is understood as the changing from one inferior status to a superior one. Democratic transition seems to be considered as a new concept, but in fact it is not such – we can detect the changes in antique Greek cities which explored different types of governments from Aristocracy, Monarchy, Tyranny, Oligarchy and Democracy .Part of ‘‘ Paradigm of Transition‘‘ is the debate for the causes of democratic transition ,with an emphasis on the theory developed by Lipset in 1959 enhancing economic development as a chain effect developer , solely able to support regime changes.
2. Literature Review
Authors, who take economic development as an argument to explain trends of democratization, analyse this correlation in two dimensions:
- Economic development as a trigger to democratization process
- Economic performance as a factor which supports the legitimacy of an already established democracy. Modernization Theory, founded on Lipset’s Theory, claims that modern democracies have come into existence in economically developed countries; therefore for a non-democratic country to become democratized through modernization, it is capitalism the structure that is responsible for the distribution of the produced wealth and creates middle class (Lipset 1959: 78).
Lipset established the democratization explanatory theory based on economic data, positively correlating economic development and legitimacy of institutions with the degree of democracy (Lipset 1960: 46). According to author ‘the more well-to-do a nation, the greater the chances that it will sustain democracy’ (Lipset 1959: 75; 1960: 48–50), Lipset relates the degree of economic development with the degree of democracy. According to author, from the Greek Antique the level of democracy has been labelled with societies in which the difference between the rich and the poor is light, with a wide middle class which has access to wealth; and that societies characterized by an rich elite and poor massive population are subject to oligarchy and tyranny (Lipset : 75). Author relates economic development with four ingredients: Wealth, industrialization, urbanization and education, which when tested with empirical data Lipset argues that average wealth, degree of industrialization and urbanization, and the level of education is much higher for the more democratic countries rather than those countries which score lower in democracy evaluation indicators.
Wealthier countries have a predisposition to be “more democratic” which allows the average citizen to have access to resources, unlike “less democratic” regimes where access to resources is limited, not merit based and questionable. According to Lipset education -basing his argument in Bryce’s theory that education if it does not make men good citizens- makes it a least easier to become so (Lipset :79) , author empirically establishes his argument that the more literate a society is , the more it will be tolerant to minority groups, opposition and tend to establish democratic regimes. Also Lipset bases his theory on Tocqueville’s (1835) argument that lawful institutions have a crucial importance in controlling and checking centralized government power.
Daniel Lerner in his work “The Passing of Traditional Society: Modernizing the Middle East” (1958) draws a correlation between democratic regimes and economic development, taking in basis the variables of Lipset and argues that a society firstly swimming in the waters of urbanization, is followed by a rising wave of literacy, rising media participation and finally therefore is produced democracy, standing solid on the above factors.
Robert A. Dahl in the same line with Lipset’s argument associates polyarchy with economic ingredients as high level of income, wealth per capita, continuous growth of income and wealth, increase in urbanization, a decreasing trend in the agricultural populations, growing literacy level (Dahl 1989: 251).
For Samuel Huntington regimes –democratic and non-democratic ones – are legitimized by prospering economically (Huntington 1991: 34-36), when concluding that almost all wealthy countries are democratic and almost all democratic countries are wealthy (Huntington 1991: 34).Yet, according to Huntington, if a regime will fail economically it might undermine the regime, but on the same line economic success of an authoritarian regime will legitimize it.
Robert Barro in “Determinants of Democracy” (1999) supports and confirms Lipset/ Aristotle hypothesis which concludes that the higher the standard of living the more democracy is promoted. Democracy, according to Barro, is closely measured with electoral rights, civil liberties, standard of living by capita GDP, the gap between male and female schooling and middle class (Barro 1999: 182).
3. Kenya’s Economic Development
In 1964 Kenyan government decided to project economy under a capitalist framework aiming to empower and vitalize economy, though in practice it was a mix of state and private sectors presence to ensure high rate of growth (Zeleza, 1991: 36). Private sector was focused on agriculture and industry, trying to support enterprises toward farming and cooperatives and producing goods due to their raw materials. These policies built an economy depended on western countries as technology, Foreign Investments and markets came directly from them. Aiming FI, government applied liberal policies which created a soft environment for foreigners who were asked to put capital into Kenya. Redistribution policy through growth harvested increment in investment creating thus stable income source (Zeleza, 1991: 37).
During late 80’s due to political oppression of Kenyan government to opposition FI were cut until 1991 when multi-party system was sanctioned in the new amendments made to Constitution.
Kenya’s economy during the years has adopted a market-free economy with little state ownership in infrastructure enterprises, making it the hub of East and Central Africa. Home to financial , communication and transportation services, since the early days of post-independence the liberal policies for foreign investments has created a reputation as friendly hub for investments.
Agriculture is the backbone of the economy, which produces 1/3 of GDP.75% of population works in this sector mainly in the farming structures. Horticulture by 23% and tea by 22% are the columns of income via exports in agriculture.
Fishing relies on Lake Victoria and Magadi which in early 2000s provided up to 128,000 metric tons of fishes, but due to pollution and illegal fishing incomes from this sector have been decreasing over the last years.
Industry sector for now is not as developed as agriculture because poor infrastructure is a present obstacle toward growing industrial enterprises. It is focuses on food and customer goods production and government is working to export more processed goods. In Eastern Africa it is the most developed country in terms of technology and lacks in trade logistics, but to attract FI it needs investments especially in energy sector which is not doing great for now. Government has introduced Vision2030 package of reform and investment to empower industrial sector in Kenya, which includes investments up to USD 300 million to achieve a 6.8% growth in this sector, establishing a good spot as a Middle Income Economy and a regional trade hub.
3.1.Exports and Imports
Both are significant indicators of income and outcome of national fund policies, drawing a map of one country’s potential and projecting thus its competing abilities in an international hub.
Egypt and South Africa. The following graph compares export and import from 1995-2015, data acquired from World Bank official site.
Figure 1.Kenya: Export and Import 1995 – 2015
Source: Observatory of Economic Complexity, 2015
Both exports and import from 1995 to 2005 have increasing trend, but exports seem to have slow improvement, while as imports have a breakthrough starting 2005. From 1995 – 2005 export’s growth is USD 2.6 billion, while as import’s growth is USD 2.3 billion. In the timetable of 2005 – 2015 export is increased with 37%, while import by 174% or USD 11.9 billion.
3.2 GDP Per Capita
Gross Domestic Product, referred as GDP, is the indicator in dollar value of a country’s wealth which includes the goods and services during a certain timetable. Because it provides specific data unified in the same structure for countries, it creates standing base for comparison. Evaluating Kenya’s economy magnitude starting from post-independence 1964 to 2018, the following data generated by World Bank shows these trends:
Figure 2.Kenya’s Gross Domestic Product 1964 – 2016
Source : World Bank National Accounts Data, 2016
place in 2006 were an increase of 9 (nine) billion dollars becomes the new financial reality in Kenya’s economy and such trend has been building same path ever since.
3.3 HDI
Human Development Index is considered to be an important indicator for the prosperity of a country despite GDP, focusing on people and their abilities which can channel government’s national policies. It is built on three dimensions: Health, Education and Standard of living which respectively are measures by life expectancy at birth, years of schooling and Gross National Income per capita. Kenya’s data on HDI shows the following trends:
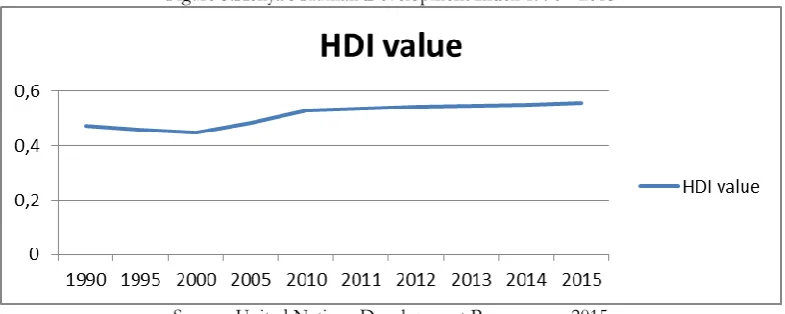
Figure 3.Kenya’s Human Development Index 1990 - 2015
Source: United Nations Development Programme, 2015
Ranked worldwide 146-th out of 188, Kenya is labelled as member of Medium Human Development group, just one step above Low Human Development group. HDI’s annual growth has been slow in change, stable in poor results toward achievement in the standard of people’s lives. There is a fall down of Life Expectancy from 1990 – 2010, which is the starting point of the increase of LEI from 58.8 (2010) to 62.2 (2015), approximately 10.5% growth. Education Index (EI) more or less shares the same features as trending years; since 2010 it has been the same of 11.1 values and it marks an 8.1 % growth since 1991 – 2 more years of schooling.
GNI per capita from 1990 has targeted 8% growth from 2,287 to 2,881 and this is an important achievement impacting therefore positively chances to further support middle class .
HDI itself has seen an improvement from 0.473 to 0.555, translated in 8.5% growth in the last three decades. Change is slow, but promising in increasing steps.
3.4 Public Debt
Figure 4.Kenya’s public debt as a percentage of GDP
Source: Country Economy, 2016
Peak of PD was in 2002 when it reached 61.84 of GDP; in the following years it started to fall dawn reaching the lowest rate in 2007 being 38.37% of GDP. From 2007 it has drawn increasing trend which by 2016 makes 53.47% and if comparing with 1998 there is actually a decrease of 0.6 percentage point.
Kenya’s economy is promising to pursue growth and enrich prosperity in the country. Agriculture makes 75% of the country’s GDP, but government is working to implement public policies which support industrial development. Recently project Vision2030 has been introduced as part of the efforts government is doing to empower industrial sector as an important column of economy. Being considered as a regional trade hub, it’s a legacy that has been relying on the continuous governmental efforts to make Kenya a suitable and warm business environment for FI, by conduction labour regulations and investment laws which give foreigners same treat as local ones.
Not to forget that its transportation infrastructure –despite in a need for more investments- has lead country to be a cross-international route for regions transportation logistics, referred as “Preferred entry point to East Africa”. Energy sector absolutely is in need for attention and government has planned to invest USD 1.4 billion on geothermal power plants with a capacity of 280 MW. Its population of nearly 50 million configures promising median age of 19.2 years old and as Kenya is offering secondary education for free in order to promote working skills of its citizens , creating thus a well-educated workforce – an advantage to its neighbours. In a graphical view, Kenya’s economic potential would be:
Figure 5.Kenya’s potential for Foreign Investments
Source: Business Sweden in Kenya, 2017
4. Uganda’s Economic Development
After gaining independence from Britain in 1962, Uganda’s economy was primarily based on agriculture sector. From 1962 to late 1980s political situation in the country has was characterized by turmoil, instability, issues with human rights and coup d’état which caused economy to perform poorer with no significant growth. Years characterized of political and economic chaos, including civil war in the North, impacted country’s finances till late 1980s. Yet, it is to be taken in consideration that growth has been stable despite slow progress. Increasing inequality, unemployment especially among youth generation, high rate of corruption have halted Uganda to achieve a flagship as a middle income country, while 83% of population is rural and industrialization process has not made enough advancement to increase urban population.
Home to natural resources like copper, cobalt, hydropower, limestone, salt, arable land, gold and oil Uganda baptized as “The pearl of Africa” has received international attention especially for its oil presence. Recently 6.5 billion barrels of oil are discovered, out of which according to World Bank 1.4 billion are recoverable. Oil production is expected to start in 2020 and the following licensed companies to operate are: Total E & P Uganda, Tullow Uganda and China National Offshore Oil Corporation (CNOOC) which operate in 6 (six) blocks/ areas as indicated in the picture:
Figure 6.Uganda’s Oil licensed companies
Source : Nogtec, 2014
4.1. Export – Import
Both are significant indicators of income and outcome of national fund policies, drawing a map of one country’s potential and projecting thus its competing abilities in an international hub. Uganda is ranked 126th largest export economy globally, a rank due to 2016 exports which reached USD 11.7 B. Exports lately have been led by gold which covers 22% of exports or USD 697 M , followed by Coffee 14% or USD 413 M . Other export goods include raw tobacco, cocoa beans, raw sugar, fish, cement, corn, rice, plants, dried legumes, flowers.
Figure 7.Uganda: Exports and Imports 1995 -2016
Source: Observatory of Economic Complexity, 2015
From 1995 to 2005 exports have been increased by 41.3% or USD 310 M, while imports have been increased by 100% or USD 1 B. From 2005 to 2015 exports have been increased by 477% or USD 5 B and imports have been increased by 449 %. The difference between imports and exports is relatively high – Only in 2016 this gap was USD 558 M.
4.2. GDP
Three Gross Domestic Product’s data for Uganda can be found from 1960 to 2016 from World Bank National Accounts data and OECD National Accounts data, which provides official numbers in USD value, allowing ground for comparison.
Figure 8.Uganda’s Gross Domestic Product, 1960 -2016
Source: World Bank National Accounts Data, 2016
During Amin’s regime 1971-1979 who came into power via military coup economy shrunk due to the policy of expulsion of Ugandans with Asian origin that covered most of the enterprises in the private sector. Delivery of social services failed while Obote 1 state enterprises were totally inefficient.
Post Amin era 1979 – 1986 six governments came into power mining any ground of political stability which would allow economic development instead of shrinking pattern which continued till early 1990.
When current president Museveni came into power he applied successful package of reforms aiming liberalization of economy such as Economic Recovery Programme and Structural Adjustment Programmes empowering private sector and from 1992 each year GDP has been growing.
4.3 HDI
Human Development Index is considered to be an important indicator for the prosperity of a country despite GDP, focusing on people and their abilities which can channel government’s national policies. It is built on three
dimensions: Health, Education and Standard of living which respectively are measures by life expectancy at birth, years of schooling and Gross National Income. Uganda’s data on HDI shows the following trends:
Figure 9.Uganda’s Human Development Index, 1990 – 2015
Source: United Nations Development Programme, 2015
Ranked worldwide 163-rd out of 188, Uganda is labelled as member of Low Human Development group sharing the same spot with Haiti. Over the last 25 (twenty-five) years of HDI evaluation LEI is increased from 45 to 59.2 ,which means nowadays Ugandans’ life expectancy has been increased with 14.2 years , while education index has achieved a 4.3 additional years of studying . GNI has been increased by 120% from USD 759 million to USD 1.67 billion. HDI value last half century with light ups and downs has the same scoring and Uganda is considered to be the last group of HDI global ranking with little progress. Comparing to the region Uganda is below the average of Sub-Saharan African countries’ average of 0.523 and below “Low Human Development” group average scores.
4.4 Public Dept.
Figure 10.Uganda’s public debt 1997- 2014
Source: Country Economy, 2014
Uganda’s case when it comes to public debt is promising; due to the hard work it took to decrease debt during mid 2000s when from 60% in 2003 it fell down to 18.8% in 2009. Years following 2010 have shown an increasing trend, yet no more than 30% of its GDP, regionally distinguished for its performance.
Uganda’s economy relying mostly in agriculture has produced a rural population and due to the lack of investments necessary funds to support industrial enterprises, technological development and telecommunication effect negatively economy in the course of a industrialized global economy.
In 2020 oil production is expected to start which if treated carefully and corruption is pushed away will give a push up to economy to make crucial reforms toward industrializing economy and subsequently imports which are mainly based on industrial products will decrease and the gap with exports will be positive.
A more developed economy would empower education by increasing quality, supporting education system by offering free secondary education and creating thus a middle class, much needed for democratic reformation. Urbanization however is conditional on the basis of a developed transportation system because as of 2017 the primary form of transport is walking, while only 20% of roads are in a fair condition (Haas, 2017).
5. Comparing Kenya and Uganda
Economic development is strongly related with the political changes in both countries, as certain regimes have worked upon building economic institutions toward either state centralized economy or free market.
Since Obote took over the rule of country in 1964 he worked for the implementation of a liberalized economic system, projected economy under a capitalist framework aiming to empower and vitalize economy, though in practice it was a mix of state and private sectors presence to ensure high rate of growth (Zeleza, 1991: 36). Generally Kenya’s economy has adopted a market-free economy with little state ownership in infrastructure enterprises, making it the hub of East and Central Africa. Home to financial , communication and transportation services, since the early days of post-independence the liberal policies for foreign investments has created a reputation as friendly hub for investments.
Figure 11.Kenya and Uganda: Comparing Export data, 1995 – 2015
Source: Observatory of Economic Complexity, 2015
In terms of Exports, Uganda has been exporting mostly agriculture products and has been performing poorer than Kenya and has seen been shrunk from 2014. Same trends follows Kenya, but at better number of exporting.
As far as imports data following suggests that Kenya’s imports have been greater than Uganda’s one – it mostly imports industrial goods, as its technologic development is insignificant.
Figure 12.Kenya and Uganda: Comparing Import data, 1995 – 2015
Source: Observatory of Economic Complexity, 2015
Figure 13.Kenya and Uganda: Comparing GDP in capita, 1980 – 2016
Source :World Bank National Accounts Data, 2016
The same results come even when comparing their ranking and scores in Human Rights Index. Kenya has achieved slightly a better position than Uganda: Kenya is considered as a “Middle Human Development” group member, while as Uganda is a “Low Human Development” group member. Comparing to the region Uganda is below the average of Sub-Saharan African countries’ average of 0.523 and below “Low Human Development” group average scores.
Figure 14: Kenya and Uganda: Comparing HDI values, 1990 – 2015
Source: United Nations Development Programme, 2015
The post-independence period from1963 – 2018 indicate Kenya performing financially better than Uganda, as political environment has been a key factor on shaping reforms which restored financial policies be those for good or bad. Kenya’s economy is promising to pursue growth and enrich prosperity in the country. Government is working to implement public policies which support industrial development. Project Vision2030 has been introduced as part of the efforts government is doing to empower industrial sector as an important column of economy. Being considered as a regional trade hub, it’s a legacy that has been relying on the continuous governmental efforts to make Kenya a suitable and warm business environment for FI, by conduction labour regulations and investment laws which give foreigners same treat as local ones.
Current governments Museveni in Uganda is actually empowering economy, with a growing perspective of exports and a public debt that is much better than the other part of the region. Biggest obstacle that Uganda faces is the lack of industrialization, technology and very poor transportation means. It’s reported that “walking” is the most used mean of transportation. Government is looking forward to investing in the above fields, and the funds might soon be available as of 2020 oil production will come into being with already six blocks in the western part legalized to work at.
In both countries economy is a prerequisite to democratic development to support institutions, fight corruption and empower their selves regionally for more interaction in a globalized world. A better economy means a better education, middle class and citizens eager to require accountability. Of course in these countries where governments have been flourishing in a culture of “Leader having no share of power”, if international factor will not push for democratic development in the country, economic stability as well might become a shelter for a non-democratic regime.
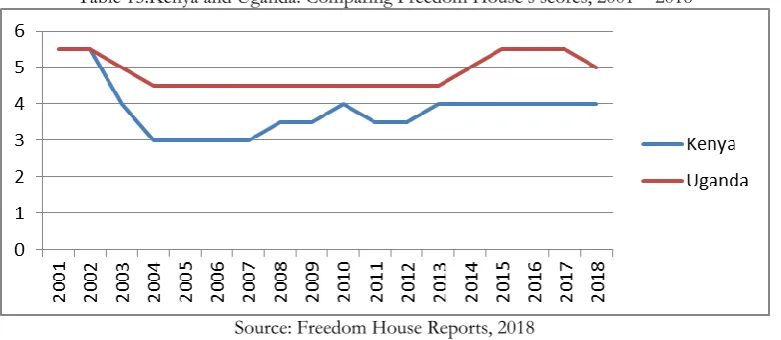
Comparing democracy in Kenya and Uganda to show which of one has applied a more liberal, democratic country than the other the following graph shows each country’s score by Freedom House. Political Rights and Civil Liberties are the columns on which the evaluation is based:
Table 15.Kenya and Uganda: Comparing Freedom House’s scores, 2001 – 2018
Source: Freedom House Reports, 2018
A more economically developed Kenya a more democratized country; a less developed Uganda a less democratized country. In their whole history of evaluation , except year 2002 when they have been evaluated same, Kenya has scored less than Uganda ( Scoring scales varies from 1 to 7 , with 1 to stand for free democratized countries and 7 for not free, non-democratic countries).
Kenya and Uganda offer a great example to study correlation between economic development and democracy as they both had the same starting point, same political legacy but since their independence it has resulted that Kenya, more developed financially than Uganda, has been able to perform more democratic reforms rather than Uganda.
6. Conclusions
There is a correlation between economic development and democracy showing a positive relationship. More democratic countries allow the average citizen to have access to resources like the contribution of wealth, unlike “less democratic” regimes where access to resources is limited, not merit based and questionable. With clarity and consistency, a strong causal relationship between economic development and democracy is also an explanatory pattern of the differences of democracy between Uganda and Kenya.
Kenya and Uganda – two countries in the Eastern Africa with the same colonial legacy – respectively in 1963 and 1962 gain their independence and since then their starting point has been the same but progress different. Kenya which was able to create early post-colonialism institutions to support private enterprises in the agriculture and industrial sector succeeded to shift toward successful economy. Uganda on the other hand did not go on the same path, its progress was short lighted and the events after would bring total destruction of any institution. For Uganda economic development started somewhere around 1986 and so did its democracy, while an early developed Kenya accelerated stability and democratic reforms in the country.
7. References
Barro, R. (1999) Determinants of democracy , Journal of Political Economy, pp.182 Country Economy (Apr 15, 2018) General government gross debt (Apr 15, 2018) https://countryeconomy.com/national-debt
Dahl, R. (1989) Polyarchy :Participation and Opposition, Yale University Press, pp. 251 Freedom House (Apr 10, 2018) Freedom in the World 1991 -2018 : Country Reports https://freedomhouse.org/report/freedom-world/freedom-world-2018
Huntington, S. (1991) The third wave –Democratization in the late twentieth century, University of Oklahoma Press, pp.34-36
Lerner, D. (1958) The Passing of Traditional Society: Modernizing the Middle East, New York, Free Press of Glencoe
Lipset, S.M. (1959) Some Social Requisites of Democracy: Economic Development and Political Legitimacy, American Political Science Review (53) , pp.75-79
Marks, G. & Diamond, L. (1992) Seymour Martin Lipset and the study of democracy, American Behavioural Scientist, 35, pp.6
Nogtec (2014) , Uganda signs MoU with oil firms over production
http://www.nogtec.com/uganda-signs-mou-with-oil-firms-over-production/ Observatory of Economic Complexity (Apr 10, 2018) , Country profile https://atlas.media.mit.edu/en/profile/country/ken/
The Swedish Trade and Invest Council (2017) Business Sweden in Nairobi: The infrastructure sector in Kenya, Nairobi.
United Nations Development Programme (Apr 15, 2018) , Country Reports http://hdr.undp.org/en
World Bank National Account Data (Apr 8 , 2018)
https://data.worldbank.org/indicator/NY.GDP.MKTP.CD