U
U
P
P
O
O
N
N
T
T
H
H
E
E
E
E
V
V
O
O
L
L
U
U
T
T
I
I
O
O
N
N
O
O
F
F
F
F
R
R
E
E
S
S
H
H
M
M
E
E
N
N
E
E
V
V
A
A
L
L
U
U
A
A
T
T
I
I
O
O
N
N
S
S
O
O
F
F
T
T
H
H
E
E
E
E
D
D
U
U
C
C
A
A
T
T
I
I
O
O
N
N
A
A
L
L
P
P
R
R
O
O
C
C
E
E
S
S
S
S
–
–
A
A
S
S
T
T
A
A
T
T
I
I
S
S
T
T
I
I
C
C
A
A
L
L
S
S
U
U
R
R
V
V
E
E
Y
Y
T
T
i
i
b
b
e
e
r
r
i
i
u
u
-
-
M
M
a
a
r
r
i
i
u
u
s
s
K
K
a
a
r
r
n
n
y
y
a
a
n
n
s
s
z
z
k
k
y
y
,
,
O
O
l
l
i
i
v
v
i
i
a
a
A
A
n
n
n
n
e
e
M
M
a
a
r
r
i
i
e
e
V
V
a
a
l
l
e
e
“Tibiscus” University of Timişoara, Romania
Corresponding Author: Tiberiu-Marius Karnyanszky, [email protected]
ABSTRACT: After presenting ([KM14, KM15]) a survey
using the expert system implemented at the “Tibiscus” University of Timisoara, Romania, applied for at least five years to analyze the quality assessment of the educational process, compulsory made by the students at our university using an online web-based application and based on the requirements of the Romanian Agency for Quality Insurance in Higher Education (ARACIS), we’re now introducing the results of a survey upon the Computer Science master students. The results of the statistical analysis are used on departments to ensure the transparent policy of the educational high education evaluation. The application allows first the evaluation by students, then the interpretation of the results and finally the study of the evolution of the results. The mathematical apparatus we’re using are statistical indicators as the average, the mean squared deviations, the class values, the correlations and others. We continue to suggest that a widely implementation of our solution permits to have the same evaluation system in all universities and, by consequence, a unitary insight to the higher education level.
KEYWORDS: Fisher test, Student test, students'
satisfaction, education assessment.
1. INTRODUCTION
The evaluation and interpretation of the students’ assessment regarding the quality of the education is one of the most important part of the higher education management. The conclusions from this interpretation can bring improvements to the act of teaching and evaluation and can increase the satisfaction of the students regarding the quality of the study programs they attend.
In [CG01], the use of a questionnaire for the students’ evaluation is presented as the most important factor, offering excellent reliability and reasonable validity.
Similarly, [KLK02] presents an investigation into 3- or 4-year departmental sets of student feedback questionnaire. However, this paper concludes that is no evidence that the use of the questionnaire was making any contribution to improving the overall quality of teaching and learning of the departments, at least as perceived by the students.
The [Wac98] paper presented a review of the existing research on students’ evaluations, offering
arguments for and against the use of student evaluations as a valid indicator of teaching effectiveness.
A large description of the principles, purposes, practices and uses of assessment, with particular emphasis on student learning and development, is presented in [Erw9]. The book offers clear principles about assessment, about some active institutional assessment programs around the US, about the program objectives, the selection and design of assessment methods, about information collection and maintenance, the techniques employed in the analysis and interpretation of assessment information.
The purposes of [Mar87] were to provide an overview of findings and of research methodology used to study students' evaluations of teaching effectiveness, and to examine implications and directions for future research in the UK.
[Hil95] presents aspects of current service quality theory in the UK: the role of the student as primary consumer of higher education services and the implications of this for the management of service quality in universities, not only during their time at university, but at the point of arrival and before, from enrolment through to graduation. The similar activity implemented in our university starts from 2006, the first year to apply questionnaires to evaluate the students’ satisfaction regarding the educational process and the evaluation of teaching and teachers. Some of our previous articles, some presented at dedicated conferences on quality in education ([CK07, KM14, KM15, KLA12, K+07, K+10, TKS08]) presented our procedures and the capitalizing of student responses in improving the teaching process.
Our paper focuses on the evolution of the freshmen from three consecutive years of a M. Sc. study program, offering a statistical analysis of the evolution of the responses.
2. MATERIAL AND METHODS
changes between the responses of students in the second year with those in year 3, we apply several times (for each question), a test to compare the averages of two populations. Here, a population is represented by all students of a year. Because the population variances are unknown and the three sample size (for each question) is less or equal to 30, we first apply a Fisher test to determinate if they are equal or not ([SP09]).
We establish the statistical hypothesis of the Fisher test that will be verified.
or
: The null hypothesis under which the variances of the two populations are equal.
or
: The alternative hypothesis under which the variances of the two populations are not equal.
Because all the calculations were made using the Data Analysis package of Microsoft Excel and will be presented below in the form of tables, we noticed simply the dispersion of the population corresponding to the year by (without indicating the question that was answered).
Using the Excel ”F-Test Two-Sample for Variances” we find out the computed value of the Fisher test (the F line of the table) and the critical value of the Fisher test for a confidence level of 95%, namely α=0.05 (the F Critical one-tail line of the table). If the computed value of the Fisher test is less or equal to the critical value of the Fisher test, then the null hypothesis is accepted, if not the other hypothesis.
Now that we know if the dispersions of the two populations are equal or not, we can apply a Student test with a confidence level of test of . The Student test hypothesis are: the null hypothesis under which the averages of the two populations are equal (
or
) and the alternative hypothesis under which the averages of the first population is less then the average of the second one (
or
).And this time when we made the notations, we did not consider the question that was answered. To find the critical value of the Student test and the computed one we used the Excel ”t-Test: Two-Sample Assuming Unequal Variances” (lines t Stat and t Critical two-tail). These results are found below. If the computed value of the Student test is less than the critical value of the test, the alternative hypothesis is accepted for a confidence level of 95%. In addition to the results of the two tests, information on the sample average, variance, size are also presented.
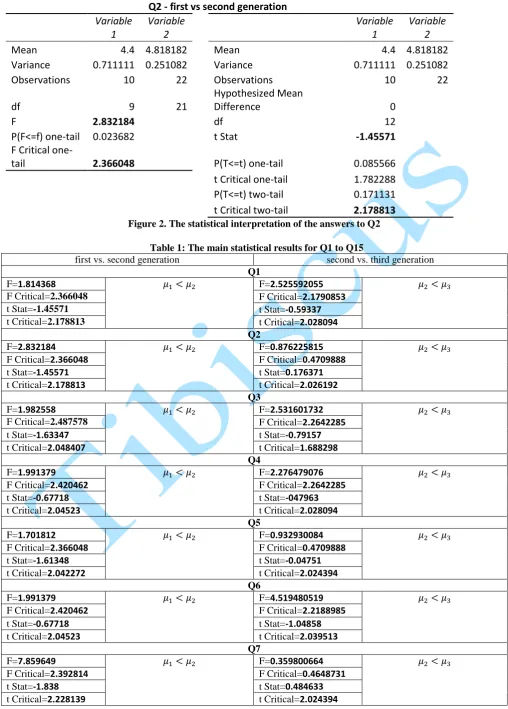
Interpretation for figure 1: in this case the null hypothesis is accepted, there are no significant differences between the averages of the two populations. Because the value of the test (line P(T<=t) two-tail) is small (2.1256% 5%), this hypothesis is accepted with a maximum probability of . Interpretation for figure 2: in this case the alternative hypothesis is accepted with a maximum probability of 99.82887%, the average of answers of the first generation is less than the average of answers of the second generation.
F-Test Two-Sample for Variances t-Test: Two-Sample Assuming Equal Variances Q1 - first vs second generation
Variable 1
Variable
2
Variable 1
Variable 2
Mean 4.3 4.818182 Mean 4.3 4.818182
Variance 0.455556 0.251082 Variance 0.455556 0.251082
Observations 10 22 Observations 10 22
df 9 21 Pooled Variance 0.312424
F 1.814368
Hypothesized Mean
Difference 0
P(F<=f) one-tail 0.12513 df 30
F Critical
one-tail 2.366048 t Stat -2.43078
F-Test Two-Sample for Variances t-Test: Two-Sample Assuming Unequal Variances Q2 - first vs second generation
Variable 1
Variable
2
Variable 1
Variable 2
Mean 4.4 4.818182 Mean 4.4 4.818182
Variance 0.711111 0.251082 Variance 0.711111 0.251082
Observations 10 22 Observations 10 22
df 9 21
Hypothesized Mean
Difference 0
F 2.832184 df 12
P(F<=f) one-tail 0.023682 t Stat -1.45571
F Critical
one-tail 2.366048 P(T<=t) one-tail 0.085566
t Critical one-tail 1.782288 P(T<=t) two-tail 0.171131 t Critical two-tail 2.178813 Figure 2. The statistical interpretation of the answers to Q2
Table 1: The main statistical results for Q1 to Q15
first vs. second generation second vs. third generation Q1
F=1.814368 F=2.525592055
F Critical=2.366048 F Critical=2.1790853
t Stat=-1.45571 t Stat=-0.59337
t Critical=2.178813 t Critical=2.028094
Q2
F=2.832184 F=0.876225815
F Critical=2.366048 F Critical=0.4709888
t Stat=-1.45571 t Stat=0.176371
t Critical=2.178813 t Critical=2.026192
Q3
F=1.982558 F=2.531601732
F Critical=2.487578 F Critical=2.2642285
t Stat=-1.63347 t Stat=-0.79157
t Critical=2.048407 t Critical=1.688298
Q4
F=1.991379 F=2.276479076
F Critical=2.420462 F Critical=2.2642285
t Stat=-0.67718 t Stat=-047963
t Critical=2.04523 t Critical=2.028094
Q5
F=1.701812 F=0.932930084
F Critical=2.366048 F Critical=0.4709888
t Stat=-1.61348 t Stat=-0.04751
t Critical=2.042272 t Critical=2.024394
Q6
F=1.991379 F=4.519480519
F Critical=2.420462 F Critical=2.2188985
t Stat=-0.67718 t Stat=-1.04858
t Critical=2.04523 t Critical=2.039513
Q7
F=7.859649 F=0.359800664
F Critical=2.392814 F Critical=0.4648731
t Stat=-1.838 t Stat=0.484633
Q8
F=7.859649 F=0.359800664
F Critical=2.392814 F Critical=0.4648731
t Stat=-1.838 t Stat=0.484633
t Critical=2.228139 t Critical=2.024394
Q9
F=2.876437 F=0.876225815
F Critical=2.366048 F Critical=0.4709888
t Stat=-1.10022 t Stat=0.176371
t Critical=2.178813 t Critical=2.026192
Q10
F=2.149123 F=1.471861472
F Critical=2.447064 F Critical=2.6462285
t Stat=-0.97298 t Stat=-0.36384
t Critical=2.04523 t Critical=2.022691
Q11
F=2.965278 F=2.299159664
F Critical=2.39812 F Critical=2.1906479
t Stat=-1.98648 t Stat=-0.29613
t Critical=2.178813 t Critical=2.030108
Q12
F=4.480603 F=0.25294212
F Critical=2.487578 F Critical=0.4637652
t Stat=-0.49544 t Stat=0.700818
t Critical=2.306004 t Critical=2.026192
Q13
F=11.87083 F=0.093703765
F Critical=2.420462 F Critical=0.4709888
t Stat=-1.35188 t Stat=1.532625
t Critical=2.262157 t Critical=2.022691
Q14
F=0.774425 F=4.770562771
F Critical=0.318433 F Critical=2.1790853
t Stat=-0.22236 t Stat=-1.08476
t Critical=2.109816 t Critical=2.042272
Q15
F=1.991379
F=4.770562771
F Critical=2.420462 F Critical=2.1790853
t Stat=-0.67718 t Stat=-1.08476
t Critical=2.04523 t Critical=2.042272
As can be seen from the Tables 1 and 2, the average of second-generation students' responses are better than the first generation; the average of the third generation is better than the average of the second-generation (with a probability of 95%). As a result, there are visible improvements from one generation to the next one.
Using the soft Decision Analyst STATS 2.0, we checked whether the number of students who answered questions could be a representative sample of our study. Thus, with a maximum acceptable percentage error or 5% and a desired confidence level of 95%, the sample size is representative for all three years.
CONCLUSIONS
We presented in this paper a survey regarding the evolution of the freshmen satisfaction upon the educational process, using the computer aided management system we developed.
Some conclusions are noticeable:
a) All results are representative for the indicated years of study
b) Even if not all students gave answers to all the questions (there is the possibility of answering I do not know) yet the weight of the elusive answers is very low
Table 2: Statistical results
Q Year Mean Variance Coeff.var. Q1 1st 4.3 0.455556 15.6965
2nd 4.818182 0.251082 10.3998 3rd 4.894737 0.099415 6.4416 Q2 1st 4.4 0.711111 19.1653
2nd 4.818182 0.251082 10.3998 3rd 4.789474 0.28655 11.176664 Q3 1st 4.375 0.553571 17.0063
2nd 4.772727 0.279221 11.0715 3rd 4.882353 0.110294 6.8021625 Q4 1st 4.666667 0.5 15.1523
2nd 4.818182 0.251082 10.3998 3rd 4.882353 0.110294 6.8022 Q5 1st 4.3 0.677778 19.1459
2nd 4.727273 0.398268 13.3499 3rd 4.736842 0.426901 10.00 Q6 1st 4.666667 0.5 15.1523
2nd 4.818182 0.251082 10.3998 3rd 4.944444 0.055556 4.767012 Q7 1st 4.4 0.711111 19.1653
2nd 4.904762 0.090476 6.1327 3rd 4.842105 0.251462 10.3562 Q8 1st 4.4 0.711111 19.1653 2nd 4.904762 0.090476 6.1327 3rd 4.842105 0.251462 10.3562 Q9 1st 4.5 0.722222 18.8853 2nd 4.818182 0.251082 10.3998 3rd 4.789474 0.28655 11.1767 Q10 1st 4.777778 0.194444 9.2294
2nd 4.904762 0.090476 5.9939 3rd 4.941176 0.058824 4.9085 Q11 1st 4.3 0.677778 19.1459
2nd 4.857143 0.228571 9.8431 3rd 4.894737 0.099415 6.4416 Q12 1st 4.625 1.125 22.9332
2nd 4.818182 0.251082 10.3998 3rd 4.647059 0.992647 21.4397 Q13 1st 4.444444 1.027778 22.8104 2nd 4.909091 0.08658 5.9939 3rd 4.578947 0.923977 20.9925 Q14 1st 4.777778 0.194444 9.2294
2nd 4.818182 0.251082 10.3998 3rd 4.947368 0.052632 4.6371 Q15 1st 4.666667 0.5 15.1523
2nd 4.818182 0.251082 15.1523 3rd 4.947368 0.052632 4.6371
d) Some of the answers are closer to 5 grade (Table 2) which corresponds to very good / very satisfied qualifier, for all three years: -at the Q.4: Audio-video and computers -at the Q.6: Availability of learning resources
-at the Q.9: Partnerships with other universities
-at the Q.10: Quality of teaching -at the Q.12: Furniture
-at the Q.14: Educational spaces
-at the Q.15: Structure of the study program
e) Some responses show a very low dispersion of students' grades (from Table 2), less than 0.5 for all three years:
-at the Q.1: Student-centered learning methods
-at the Q.4: Audio-video and computers -at Q.6: Availability of learning resources -at the Q.10: Quality of teaching
-at the Q.14: Educational spaces
-at the Q.15: Structure of the study program f) More than that, using the coefficient of
variation (Table 2), it can be seen that all coefficients are less than 35%, so all data are homogeneous; in some cases, the data are very homogeneous (coefficient < 5%) as for Q6, Q10, Q14 or Q15 in the 3rd year - since the coefficient of variation tends to 0%, it results that the variation of the characteristic is small, the collectivity being studied is homogeneous, the average of series is representative of the series, and the grouping is well done
g) Some responses have a continuous mean increase (as seen in Table 2):
-at the Q.1: Student-centered learning methods, from 4.30 to 4.82 and 4.89
-at the Q.3: Possibility of course selection, from 4.38 to 4.77 and 4.88
-at the Q.4: Audio-video and computers, from 4.67 to 4.82 and 4.88
-at the Q.5: Student services, from 4.38 to 4.73 and 4.74
-at the Q.6: Availability of learning resources, from 4.67 to 4.82 and 4.94 -at the Q.10: Quality of teaching, from 4.78 to 4.90 and 4.94 – always on the top of grades
-at the Q.11: Availability of staff, from 4.30 to 4.86 and 4.89
-at the Q.14: Educational spaces, from 4.78 to 4.82 and 4.95
-at the Q.15: Structure of the study program, from 4.67 to 4.83 and 4.95
Finally, we can conclude that there is an improvement in students' responses and a grouping of them to the average responders, which demonstrates the fairness of the implemented measures to ensure a better curriculum, to provide better-trained teachers and also to implement a modern teaching style.
REFERENCES
[CG01] M. Coffey, G. Gibbs – The Evaluation of the Student Evaluation of Educational Quality Questionnaire (SEEQ) in UK Higher Education, in Assessment & Evaluation in Higher Education, vol. 26, issue 1, 2001.
[CK07] O. Crista, T. M. Karnyanszky - Application for Evaluation of the Professional Competencies of the Teaching Staff, Anale. Seria Informatica, vol. V, pp. 71-76, 2007.
[Erw91] T. D. Erwin – Assessing Student Learning and Development: A Guide to Principles, Goals, and Methods of Determining College Outcomes, Jossey-Bass Inc., Publishers, San Francisco, 1991.
[Hil95] F. M. Hill – Managing service quality in higher education: the role of the student as primary consumer, in Quality Assurance in Education, vol. 3, issue 3, pp. 10-21, 1995.
[KM14] T. M. Karnyanszky, C. Muşuroi - A Statistical Survey upon the Evolution of the Students’ Satisfaction Regarding the Educational Process, Anale. Seria Informatica, vol. XII, fasc. 2, pp. 71-77, 2014.
[KM15] T. M. Karnyanszky, C. Muşuroi - A Statistical Survey upon the M. Sc. Students’ Satisfaction Regarding the Educational Process, Anale. Seria Informatica, vol. XIII, fasc. 2, pp. 80-87, 2015.
[KLA12] T. M. Karnyanszky, L. D. Lacrămă, S. A. Apostol - Computer Aided Assessment of Students’ Satisfaction Regarding the Educational Process, E” Era & Higher Education, Proceedings of the 7th International Conference Quality Management in Higher
Education, Austrian Computer Society, Viena, 2012, ISBN: 978-3-85403-291-5, pp. 39-48.
[KLK02] D. Kember, D. Y. P. Leung, K. P. Kwan – Does the Use of Student Feedback Questionnaires Improve the Overall Quality of Teaching?, in Assessment & Evaluation in Higher Education, vol. 27, issue 5, 2002.
[K+07] T. M. Karnyanszky, L. D. Lacrămă, L. Luca, I.Iacob - Teacher’s Evaluation - a Component of Quality Assessment System, Anale. Seria Informatica, vol. VI, pp. 107-112, 2007.
[K+10] T. Karnyanszky, A. Fortiş, O. Crista, D. Lacrămă - Computer Aided Management of the Teaching Staff Assessment, Proceedings of the 6th International Seminar on Quality Management in Higher Education, Book 1, pp. 87-90, 2010.
[Mar87] H. W. Marsh – Students’ evaluation of University teaching: Research findings, methodological issues, and directions for future research, International Journal of Educational Research, vol. 11, issue 3, pp. 253-388, 1987.
[SP09] O. Saierli, L Pater – Statistică. Aplicaţii economice, Ed. Eubeea, Timişoara, 2009, ISBN: 978-973-673-168-6.
[TKS08] C. Ţuican, T. M. Karnyanszky, B. Şelariu - Expert System for Quality Assessment in „Tibiscus” University, Anale.Seria Informatica, vol. VI, pp. 239-248, 2008.