Development and Evaluation of a Real Time Site-Specific
Inter-Row Weed Management System
A. M. SHIRZADIFAR
1*, M. LOGHAVI
1**and M. H. RAOUFAT
1*1
Department of Mechanics of Agricultural Machinery, College of Agriculture, Shiraz University, Shiraz, I. R. Iran
Received 8 November 2011, Accepted 12 November 2012, Available Online 1 June 2014 ABSTRACT- A real-time, site-specific, machine-vision based, inter-row patch herbicide application system was developed and evaluated. The image resolution was 640 × 480 pixels covering a total area of 350 mm x 240 mm of a field composed of four quadrants of 350 mm x 60 mm each. The image frames were processed by LabView® and MatLab®. The developed algorithm, based on weed
coverage ratio and segmentation method for separating soil from plants, was chosen to be 2G-R-B. The unit was lab-tested to evaluate the accuracy of the sprayer at three travel speeds of 2, 4 and 6 km h-1. The effect of travel speed on spraying delay
was not significant when using LabView®, while it was significant when MatLab®
was used for image processing. A binary analysis algorithm showed that misclassification rates for plant (MCRP) and soil (MCRS) were (2.4±1.3)%
[mean±SD] and (2.8±0.7)%, respectively and correct classification rates for plants (CCRp) and soil (CCRs) were (96 ±1.1)% and (93.8±1.3)%, respectively. During the
field test, three herbicide application treatments consisting of target patch spraying, conventional (uniform) spraying and no spraying (control) were compared at three levels of weed coverage (low, medium and high). In the patch spraying treatment, a spray mixture of 2-4-D (0.35%) was sprayed only over the weed patches, while the conventional treatment plots received uniform and continuous applications of the same mixture. The result showed that the herbicide used in each patch spraying plot was proportional to the weed coverage level. On average, the target application resulted in 75% less herbicide consumption compared to the conventional application, while the patch spraying application was as effective as the conventional application for the eradication of weeds.
Keywords: Herbicide application, Machine vision, Patch spraying, Variable Rate Application, Weed control
INTRODUCTION
Since weed control is one of the essential farming practices towards high crop yields, adoption of sustainable weed management systems plays an important role in modern agriculture. In conventional crop management systems, agro-chemicals are uniformly applied through the whole field. Several studies have confirmed that weeds are generally clustered together in patches within a field (19, 24, 32, 33). Yang et al. (31) mapped weed distribution of a maize field using digital images. The results showed that only 59% of the maize field required full herbicide application having a weed density of 5% or more, based on the percentage of greenness area in the images. As numerous studies have shown that weed population is non-uniform within agricultural fields (3, 5, 6, 12, 13), adoption of a site-specific weed management (SSWM) system has potential economic and environmental benefits. Site-specific weed management, based on variable rate technology (VRT) is one of the most widely used technologies in precision agriculture (20). In this technique, agricultural production inputs (such as chemicals, fertilizers, etc.) are applied proportional to the needs of each management section of the field (8). By controlling weeds site-specifically, herbicide consumption is reduced 30% to 97%, without losing efficacy (2, 9, 10, 16, 22, 24, 25, 34). VRT eliminates the need to apply herbicide on places where weeds are not present or weed density is below a preset threshold value. Weeds can be identified by employing real-time sensors or using a predetermined digital weed map. This map is used in conjunction with a differential global positioning system (DGPS) and a variable rate sprayer control system to produce an application map (8).
Al-Gaadi and Ayers (1) integrated GIS and GPS into a spatially variable rate herbicide application system using a direct nozzle injection field sprayer equipped with real-time DGPS. GopalaPillai et al. (14) tested an electronic flow control system for site-specific herbicide application. The control system used spray nozzles coupled with solenoid regulated valves, using pulse-width modulation at 10 Hz and duty cycles of 10-100% to control flow rate. They concluded that further research was necessary to establish the best nozzle frequency as well as to modify the controller to operate it with a real-time weed sensing system. Tian et al. (28) developed and tested a real-time machine-vision sensing system with an automatic herbicide sprayer. This system saved 48% herbicide application compared to conventional spraying. Later, a vision-sensor-based precision chemical application system was developed and tested by Tian (28). Multiple vision sensors were used to cover the target area and each individual spray nozzle was controlled separately. Using the onboard DGPS, geo-referenced chemical input maps were also recorded in real-time. The target hit accuracy test results demonstrated that the system operated with a 91% overall delivery accuracy while the sprayer traveled at 3.2 to 14 km/h. A system time lag was most noticeable at higher travel speeds.
barley, rotating on one site. Herbicides were applied site-specifically according to the spatial variation of weed populations using a patch sprayer coupled with DGPS that allowed for variable rate application and selective control of each section of the spray boom.
Yang et al. (32) developed a weed map by estimating weed coverage and weed patchiness based on the percentage of the greenness area in the images. Using weed coverage and weed patchiness as inputs, a fuzzy logic model was developed to determine site-specific herbicide application rates. Simulations indicated that significant amounts of herbicide could be saved using this approach.
Timmermann et al. (30) conducted a 4-year experiment on five fields with a GPS-guided sprayer to evaluate economic benefits of site-specific weed control. They concluded that herbicide saving was strongly dependent on crop and year and that on average, 54% herbicide could be saved. Weed control effectiveness and herbicide savings were determined for a variable-rate herbicide application scenario involving three rates, including 100, 67 and 33% (27). The performance of the treatments against blanket applications of each rate used in the variable rate application (VRA) scenario was tested. Comparing VRA to conventional methods, the former was found to have achieved the best performance in terms of weed control effectiveness and herbicide use efficiency. Blanket applications of the highest rate showed inefficient use of herbicide, because a 33% increase in herbicide use between the medium and high rates only contributed to a 5% increase in weed control.
Tangwongkit et al. (26) developed a real-time variable rate herbicide applicator for between-row weeding using machine vision technology. The pulse width modulation (PWM) drive motor speed control was correlated with the percentage of greenness to vary the application flow rate by adjusting the duty level of the PWM motor. The laboratory performance evaluation revealed 20.6% reduction in herbicide consumption.
Celen et al. (4) developed an electronic weed control system using an optical sensor for selective spraying of weeds in sunflower fields. The system became active when weeds interrupted a signal passing between the sensor and the reflector. The field test indicated that the new system consumed a minimum of 0.9 L and a maximum of 1.3 L of spray liquid as compared with 11 to 13 L for conventional spraying. Loghavi and Behzadi (18) developed a prototype patch sprayer for a target oriented weed control system by integrating the DGPS with a geographic information system (GIS). Results showed that herbicide consumption was reduced to 69.5% compared to the conventional application.
A micro spraying system consisting of five nozzles was evaluated by Nieuwenhuizen et al. (21) to control volunteer potatoes in sugar beet fields. Average color information was used to distinguish crops and weed plants using an adaptive Bayesian classifier. At the forward speed of 0.8 m /s, the system controlled the growth of 77% of the volunteer potatoes while killing only up to 1% of the crop.
The objectives of this study were
to (1) develop a real-time site-specific herbicide application system, based on machine vision technology and to (2) evaluate the developed system under both laboratory and field conditions.
MATERIALS AND METHODS
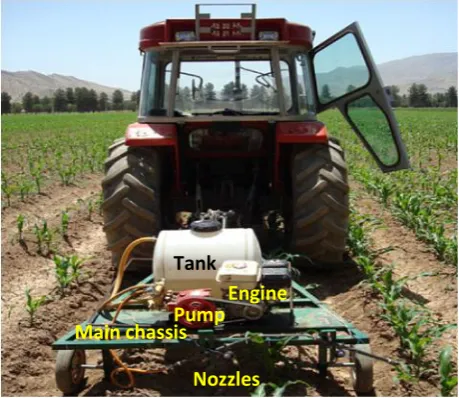
The weed management system consisted of a spraying unit, an image acquisition and processing system, an electronic circuit, a rotary encoder, solenoid valves, spray nozzles and other necessary hardware. The prototype site-specific herbicide application system was developed for a single crop row (Fig. 1). The image frames of the test field between two adjacent ridges were captured by two cameras (A4 Tech, 1.4 Megapixel, Taiwan) and sent to a portable computer (Sony, VAIO, NR498E) through a USB port. The images taken by the cameras had JPEG format to be compatible with image processing software programs MatLab® and LabView®. The image resolution was 640 x 480 pixels covering a total area of 350 mm x 240 mm of the field. Each image was divided into four quadrants of 350 mm x 60 mm each. To control each individual nozzle separately, the area of the field-zone covered by an 11002 Teejet nozzle was selected equal to the detection zone of the vision system. A LED indicator in the electronic control circuit monitored the operation of two solenoid valves on the nozzle bodies.
Fig. 1. The prototype site-specific herbicide application system developed in this study
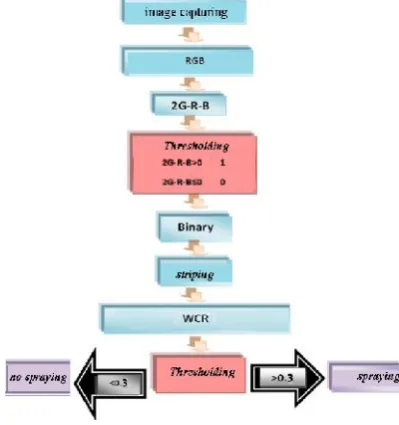
Each pixel of the taken image has three red (R), blue (B) and green (G) color components. Since the image pixels corresponding to plant leaves have a greater G component as compared to R and B, the segmentation method for separating soil from plants was chosen to be “2G-R-B” as shown in Fig. 2. An important advantage of this formula is reducing the effect of light intensity on image resolution (17). The developed
Tank
Engine Pump Main chassis
algorithm was based on plant leaf greenness (weed coverage ratio). The weed coverage ratio algorithm was used to calculate the percentage of greenness of each picture frame relative to the field surface. Weed coverage ratio (WCR) is defined as:
pixels of
number total
pixels plant
WCR (1)
where “Plant pixels” is the sum of all plant pixels segmented by the “2G-R-B” formula and the total number of pixels in one control zone is equal to “76800” (160 by 480) pixels.
Fig. 2. Image processing algorithm developed in this study
Therefore, for each image frame with aWCRlarger than a preset threshold value, a signal was sent to invoke the controller circuit of the solenoid valves. Spraying continued as long as theWCRwas above the predefined threshold. Since static threshold values have been proved to be unreliable in outdoor lighting conditions (28), a dynamic thresholding algorithm as calculated by equation 2 was adopted to accommodate variable outdoor lighting conditions.
T=c (Imax-Imin), (2)
where T is the dynamic threshold, Imax and Imin are the sampled maximum and
minimum of “2G-R-B’’ values, respectively and C is a coefficient determined experimentally during the pre-test trials.
The cameras had to be installed at a considerable distance ahead of the sprayer carriage for experiments for which MatLab® was used. For this arrangement, it was
necessary to install a rotary encoder with an appropriate controlling circuit. The encoder was mounted on the drive shaft of the sprayer’s front wheel and generated pulse signals to provide information regarding the specific location where that particular image was captured. To avoid this tedious arrangement, LabView® was used as the alternative
Evaluation of the Image Processing Algorithm
In order to evaluate the performance of the (2G-R-B) separation method, two performance indices, correct classification rate (CCR) and misclassification rate (MCR) were determined. Correct classification rate (CCR) is defined as the ratio of the number of plant pixels correctly classified to the total number of plant pixels in an image (7). It is important that soil not be classified as plant. So, MCR was defined as the ratio of soil pixels classified as plant to the total soil pixels in an image. Binary results of segmentation scheme were compared to their initial captured field image in order to determine CCR and MCR for 40 sample images.
Laboratory Tests
The test rig could be pulled at any desirable speed by an MF-285 tractor along a test track in the Farm Machinery Laboratory, Shiraz University, Iran. The unit was tested to evaluate spraying accuracy of the sprayer at three travel speeds of 2, 4 and 6 km h-1 by
using both MatLab®and LabView®software programs separately. Farm weeds were cut
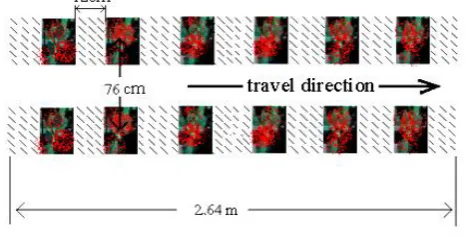
and placed on the test track floor under the sprayer carriage, simulating field conditions. For each trial, a total of 40 weed samples were placed on the lab floor in two rows. Water which was marked by Methyl Red (4) was used as spraying agent to label samples being sprayed (Fig. 3). The mean percentage of spraying accuracy at each tested travel speed was calculated by equation 3.
System performance accuracy (%) = B
A×100 (3)
where
A: weed samples sprayed by the test rig.
B: total number of weed samples laid on the test track.
To determine the amount of herbicide saved in patch spraying compared to conventional (uniform) spraying, filter papers were laid under the weed rows to determine the ratio of the sprayed colored area to the total test track area (uniform application sprayed area). Each test was replicated three times to confirm the reliability of the system.
Field Tests
Field tests were conducted in a cornfield at the Agricultural Experiment Station, College of Agriculture, Shiraz University. The experiment started when corn plants had 4 to 6 leaves. Row spacing was 76 cm and individual plants were spaced at 12 cm apart along the row. A MF-285 tractor at a forward speed of 3 Km h-1pulled the test apparatus. Two
Teejet 11002 spray nozzles were mounted on a sprayer boom 76 cm apart, at a height of 30 cm above the ground and slightly tilted toward each other to provide symmetric spraying areas on both sides of the planting row. Each nozzle was controlled independently by a 12 VDC powered solenoid valve.
The spraying nozzles were adjusted in a tilted position to spray directly and normally on both sides of the back furrow. A pair of deflector plates was mounted back to back on the sprayer boom midway between the nozzles to prevent the presence of corn plant leaves in the picture frames and to keep them from being subjected to the applied herbicide. A randomized complete block design experiment was conducted with three herbicide application treatments to assess the field performance of the system. Treatments consisted of target patch spraying, conventional (uniform) spraying and no spraying (control) with three replications at three levels of weed coverage (low, medium and high). In the patch spraying treatment, a spray mixture of 2-4-D (0.35%) was sprayed only over the weed patches detected by the two cameras and controlled by the microprocessor, while the conventional treatment plots received uniform and continuous application of the same mixture. The amount of herbicide application in the conventional and patch spraying treatments and the effectiveness of the applications were measured at 5-20% (low), 20.1-40% (medium) and 40.1-100% (high) levels of weed coverage. A square frame (0.5m×0.5m) was used to measure weed coverage ratio (percent of test area covered by weeds) before and after herbicide treatments. Weed coverage ratio was measured using a WCR algorithm (equation 1). Field images were captured by placing the frame randomly at five locations in each of the treatment plots. According to Pierce (23), there are two indices for effectiveness (weed eradication) of herbicide application. The first is “percent control” that compares the weed count (density) after each herbicide application treatment with its original weed count before application. The second index is “weed control” which compares the average weed count of treated plots with that of the control (untreated) plots.
These two indices can be calculated by equations 4 and 5.
100 .
. A
B A C
P (4)
where
P.C.:Percent control
A: average number of weeds present in each plot before herbicide application and B: average number of survived weeds in each plot three days after herbicide application.
100
C T C index control
Weed (5)
where
T: average number of survived weeds in treated plots.
RESULTS AND DISCUSSION
Typical Weed Distribution
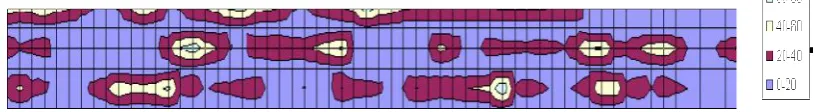
Based on the results, weeds were found to be distributed in clumps or patches within the test corn field. Measurements of weed infestation density before herbicide application showed that weeds covered 20-60% of the plot areas (Fig. 4).
Fig. 4. Typical distribution of weeds in test plots
Evaluation of the Algorithm
Based on the results, misclassification rates for plant (MCRP) and soil (MCRS) were found
to be (2.4±1.3) % and (2.8±0.7) % [mean±SD], respectively, while correct classification rates for plants (CCRp) and soil (CCRs) were (96.0±1.1) % and (93.8±1.3) %, respectively.
Plant zone detection accuracy of the WCR algorithm was determined during the corn’s growing stage of 4 to 6 leaves. Experimental data in Table 1 illustrate the number of times the plant zones were in the specific portion of the test images, and the number of correct recognitions by the controller.
Spraying Accuracy
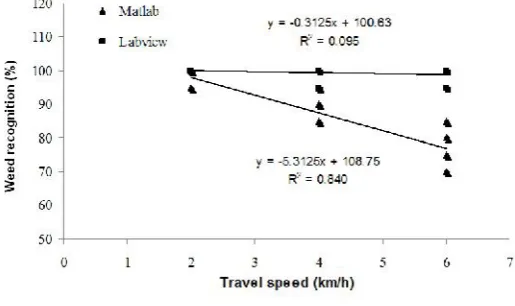
The effect of travel speed on system performance accuracy was not significant when LabView was used as the image processing software (Figure 5). Since it was desirable to prepare and develop the system for real–time application, adoption of the MatLab®software
resulted in significant occurrences of spraying delay (10%) as compared to LabView®
(<3%) where real-time spraying operation was adopted. In fact, lab tests revealed that replacement of MatLab®with LabView®resulted in 7% less delay lags.
Table 1. The WCR algorithm recognition accuracy test
Test No. Nozzle 1 Nozzle 2
Occurrenca Recognitionb Occurrenca Recognitionb
Test 1 40 38 38 35
Test 2 35 32 43 41
Test 3 36 34 33 31
Test 4 42 40 37 34
Correct Response (%) 94.03 93.3
aTotal No. of plants in the field test
Fig. 5. Test results of weed recognition accuracy at various travel speeds
Fig. 6 exhibits average delay magnitudes at various carriage forward speeds and three spacings adopted between prepared samples on the test track. By increasing travel speed, the magnitude of spraying delay significantly increased when MatLab®software was used. This
could be mainly attributed to the lack of proper output of the rotary encoder due to the skidding of the carriage land wheel. Since the rotary encoder was not used in the unit when LabView® was employed as image processing software, the percentage of displacement
delay was less than 3%. Several factors such as rotary encoder error due to the skidding of the driven wheel of the sprayer, solenoid response time, and system pressure fluctuations resulting from sudden opening and closing of spray nozzles are considered to be responsible for the application delays observed in these tests.
Fig. 6. Average displacement delay vs. travel speeds for Matlab®software
MatLab software was used. Reductions in the sprayed area could be attributed to the larger spraying delays at higher travel speeds and the rotary encoder errors associated with using MatLab®software.
Table 2. Comparison between of sprayed and expected sprayed areas at three travel speeds Travel speed (km h-1)
Software used
6 4
2
27 31
34 MatLab
30 32
34 LabView
Expected sprayed area is constant at 34% for all speeds and both software systems.
Amount of Herbicide Application
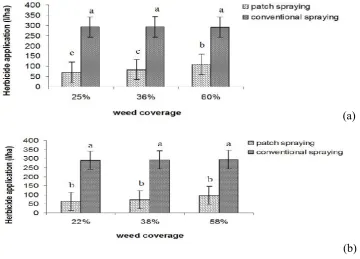
Measuring weed infestation density before herbicide application showed that weeds covered about 20-60% of the plots. Therefore, a significant reduction in herbicide application was expected by implementing patch spraying instead of conventional (uniform) spraying. Fig. 7 compares the average amount of herbicide sprayed in the conventional and patch spraying treatments (SSWM) conducted in the field experiment.
(a)
(b)
Analysis of variance of the mean values of the herbicide application data showed that the two spraying methods were significantly different at 99% confidence level. On the average, the target application resulted in 75% less herbicide consumption compared to the conventional application. Haggar et al. (15) estimated a 60% herbicide reduction by using site-specific spraying. Rew et al. (24) reported saving chemicals from 34 to 97% if herbicides were only applied to the areas where weeds were detected. Gerhard et al. (9) observed that herbicide use could be reduced up to 50% by intermittent spraying using an economic threshold in winter wheat fields. Biller (2) reported that by establishing weed patches and performing site-specific spraying, reduction of herbicide consumption between 30 to 70% could be obtained.
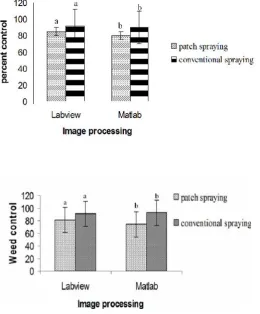
In Fig.s 8a and 8b, bar graphs of ‘percent control’ and ‘weed control’ indices for patch and conventional treatment spraying are shown, respectively. The mean values of these two indices are not significantly different at 95% confidence level for the two herbicide application methods indicating that patch spraying application was as effective as the conventional (uniform) application method in the eradication of weeds.
According to Fig. 9, the average amount of herbicide application rates in patch spraying plots is linearly proportional to the weed coverage of those plots. This indicates that the patch spraying system has successfully controlled spraying in response to weed density.
y = 0.97x + 38.13 R² = 0.96 y = 1.05x + 45.55
R2 = 0.98
40 60 80 100 120 140
10 20 30 40 50 60 70
Weed Coverage (%)
H
er
bi
ci
de
a
pp
lic
at
io
n
ra
te
(L
/ h
a)
Matlab
Labview
Fig.9. Comparison between weed coverage and herbicide application rate at patch spraying plots
CONCLUSIONS
A real time, site-specific, machine-vision based, inter-row patch spraying herbicide application system was developed and evaluated. Based on lab-tested evaluation, the accuracy of the patch spraying performance increased at lower travel speeds using LabView®software due to its faster processing time in comparison with MatLab®. Field
evaluation tests showed that the herbicide consumption rate for each of the patch spraying plots was linearly proportional to the weed coverage of the plot. The target application resulted in saving 75% herbicide compared to the conventional practice, while patch spraying application was as effective as the conventional (uniform) application method in the eradication of weeds. The results proved promising for future adoption of such system, which is both cost effective and environmentally friendly.
REFERENCES
1. Al-Gaadi, K. A. and P. D. Ayers. 1999. Integrating GIS and GPS into a spatially variable rate herbicide application system. Applied Eng. in Agric. 15(4): 255-262. 2. Biller, R. H. 1998. Reduced input of herbicides by use of optoelectronic sensors. J.
3. Brown, R. W., G. A. Steckler and G. W. Anderson. 1994. Remote sensing for identification of weeds in no-till corn. Trans. ASAE 37(1): 297-302.
4. Celen, H., E. Klick and M. R. Durget. 2007. Development of an automatic weed control system for sunflower. Trans. ASABE 24(1): 23-27.
5. Cousens, R. D. and J. L. Woolcock. 1997. Spatial dynamics of weeds: an overview.
In: Farnham, (ed.), proceeding of the Brighton crop protection conference-weeds British Crop Protection Council. U.K. pp. 613-618
6. Dieleman, J. A., D. A. Mortensen, D. D. Buhler and R. B. Ferguson. 2000. Identifying associations among site properties and weed species abundance. II. Hypothesis generation. Weed Sci. 48: 576-587.
7. El Faki, M. S., N. Zhang and D. E. Peterson. 2000. Factors affecting color-based weed detection, Trans. ASAE, 43(4): 1001-1009.
8. Ess, D. and M. Morgan. 2003. The Precision-Farming Guide for Agriculturists. Deere & Company, Moline, IL, USA.
9. Gerhards, R., M. Sokefeld, K. Schulze-Lohne, D. A. Mortensen and W. Kuhbauch. 1997. Site-specific weed control in winter wheat. J. Agron. Crop Sci. 178: 219-255.
10. Gerhards, R., M. Sokefeld, C. Timmermann, W. Kuhbauch and M. M. Williams II. 2002. Site-specific weed control in maize, sugar beet, winter wheat, and winter barley. Precision Agric. 3: 25–35.
11. Godwin, R. J. and P. C. H. Miller. 2003. A review of the technologies for mapping within-field variability. Biosys. Eng. 84(4): 393‐407.
12. Gonzalez-Andujar, J. L. and M. Saavendra. 2003. Spatial distribution of annual grass weed populations in winter cereals. Crop Protec., 22: 629-633.
13. GopalaPillai, S., L. Tian and J. Zheng. 1999. Evaluation of a flow control system for site-specific herbicide applications. Trans. ASAE. 42(4): 867-870.
14. Green, H. M., W. K. Vencill, C. K. Kvien, B. C. Boydell and S. Poknee. 1997. Precision management of spatially variable weeds.In:J. V. Stafford (ed.), Precision Agriculture 97. BIOS Scientific Publishers, Oxford, UK, pp.983-989.
15. Haggar, R. G., C. J. Stent and S. Isaac. 1983. A prototype hand-held patch sprayer for killing weeds activated by spectral differences in crop/weed canopies. Agric. Eng. Symp. 427-432.
16. Heisel, T., S. Christensen and A.M. Walter. 1997. Validations of weed patch spraying in spring barley–Preliminary trial. In: J. V. Stafford (ed.), Precision Agriculture ’97, Bios Scientific Publishers, SCI, Warwick, pp. 879-886.
18. Loghavi, M. and B. Behzadi. 2008. Development of a target oriented weed control system. Computers and Electronics in Agric. 63(1): 112-118.
19. Marshall, E. J. P. 1988. Field-scale estimates of grass weed populations in arable land. Weed Res. 28: 191–198.
20. National Research Council. 1997. Precision Agriculture in the 21st Century—
Geospatial and Information Technologies in Crop Management. National Academy Press, Washington, D.C.
21. Nieuwenhuizen, A., J. Hofstee and E. Van Henten. 2010. Performance evaluation of an automated detection and control system for volunteer potatoes in sugar beet fields. Biosys. Eng. 107(1): 46-53.
22. Nordmeyer, H., A. Hausler and P. Niemann. 1997. Patch weeds control as an approach in precision farming, In: J. V. Stafford (ed.), Precision Agriculture’ 97. BIOS Scientific Publishers, Oxford, UK..pp. 307-314.
23. Pierce, R. A. 2001. Evaluation of deposition and application accuracy of a pulse-width modulation flow control field sprayer. Master's thesis, Department of Chemical and Bioresearch Engineering. Colorado State University, Fort Collins, Co.
24. Rew, L., J. Cussans, M. A. Mugglestone and P. C. H. Miller. 1996. A technique for mapping the spatial distribution of Elymus repens, with estimates of the potential reduction in herbicide usage from patch spraying. Weed Res. 36: 283–292. 25. Stafford, J. V. and P. C. H. Miller. 1996. Spatially variable treatment of weed
patches. In: International Conference on Precision Agriculture, Minneapolis, Madison,ASA; CSSA, SSSA., pp.465-474.
26. Tangwongkit, R., V. M. Salokhe and H. P.W. Jayasuriya. 2006. Development of a real-time, variable rate herbicide applicator using machine vision for between-row weeding of sugarcanes. The CIGR Ejournal, Manuscript PM 06009, Vol. III.
27. Thorp, K. R. and L. F. Tian. 2004. Performance study of variable-rate herbicide applications based on remote sensing imagery. Biosys. Eng. 88 (1): 35–47.
28. Tian, L., J. F. Reid and J. W. Hummel. 1999. Development of a precision sprayer for site-specific weed management. Trans. ASAE 42(4): 893-900.
29. Tian, L. 2002. Development of a sensor-based precision herbicide application system. Computers and Electronics in Agric. 36: 133-/149.
30. Timmermann, C., R. Gerhards and W. Kuhbauch. 2003. The economic impact of site-specific weed control. Precision Agric. 4: 249-260.
32. Yang, C. C., S. O. Prasher, J. A. Landry and H. Ramaswamy. 2003. Development of an image processing system and a fuzzy algorithm for site-specific herbicide applications. Precision Agric. 4: 5–18.
33. Wiles, L. J., G. W. Oliver, A. C. York, H. J. Gold and G. G. Wilkerson. 1992. Spatial distribution of broadleaf weeds in North Carolina soybean (Glycine max) fields. Weed Sci. 40(4): 554–557.