INTERPRETING WHEAT GENOTYPES FOR GRAIN YIELD UNDER DIFFERENT REGIMES OF KHYBER PAKHTUNKHWA
Nasarullah*, Raiz uddin*, Fakhar Uddin* and Muhammad Jamal*
ABSTRACT:- Pakistan has been blessed with wide range of environ-mental conditions ranging from plains to mountains. Wheat is grown throughout the country to feed more than 200 million people. To get maximum yield, high yielding genotypes suitable to diverse agro-climatic conditions are needed. However, so for few varieties have been developed that can efficiently grow in different environments. This is one of the reasons for lower wheat production in the country. Current experiment was conducted to monitor stability of yield potential of 15 diverse wheat genotypes at Skardu-Gilgit-Baltistan (Northern and mountainous region of Pakistan) and Peshawar, Khyber Pakhtunkhwa, during wheat crop season 2011-2012 using RCB design with three replications. The genetic material was comprised of 9 nationally released cultivars, three advance line from Tajikistan, one from China and two locally grown cultivars. The analysis of variance revealed significant differences among genotypes, locations and genotype by environment interactions for days to heading, days to matu-rity, plant height (cm), spike length (cm), spikelets spike , 1000-grain weight and grain yield. Flag leaf area (cm displayed non-significant diffe-rences across environments and its interaction with genotypes. Mean values across the environments range between 147.17 to 174.00, 190.83 to 202.83, 23.32 to 54.13,78.40 to 115.17, 9.72 to 13.08, 16.33 to 23.80 for days to heading, maturity, flag leaf area, plant height, spike length and spikelets spike , respectively. The estimates of broad sense heritability were high for all studied traits. Similarly, genetic advance was also high for all studied traits except days to heading and maturity where genetic advance was low. High heritability coupled with high genetic advance indicated the effectiveness of selection in early generation for the improvement of these traits. Genotypes Faisalabad-2008 and line from Tajikistan (2S-3094) performed better for most of yield and associated traits across both environments therefore could be an asset for plant breeders to breed genotypes suitable for diverse environments.
-1 2)
-1
Key Words: Genotypes x Environment; Heritability; Genetic Advance; Skardu; Bread Wheat; GEI
INTRODUCTION
Bread wheat (
L.) is one of the most important and widely consuming cereals of world including Pakistan. It occupies a central position in making agricul-tural policies of the country and
Triticum aestivum
* University of Agriculture, Peshawar, Pakistan. Corresponding author: shafiq_qm@yahoo.com
the districts which are located in Northern part of the country where it borders with China and Kashmir. This area is mostly encompasses high mountains and rivers. It is connected with rest of the country through Silk Road. Gilgit-Baltistan is a land of subsistence farming with small land holdings. Under irrigated conditions wheat can be grown in the valleys and terraces of high mountains. Wheat is the major cereal crop of the area, which is planted both in the double cropping zone (upto 1800 meters) and in the single cropping zone (generally above 1800 meters). Agro ecological features of Gilgit-Baltistan are totally different from rest of the country. Moreover, the agro-climatic condi-tions within the Skardu itself are so contrasting that imposes challenges for the plant breeders.
Wheat is grown throughout the country including Gilgit-Baltistan. Hardly any cultivar has been develo-ped for different parts of this region. Therefore, local farmer within the region are compelled to cultivate low yielding varieties which have not been bred for different environments. Whe-at growing areas in Pakistan contain both irrigated and rainfed which are located in diverse environmental conditions. Therefore this demands the development of such varieties which can withstand diverse environ-mental conditions that give reason-able yields from all type of areas. Crop plant is exposed to a range of environ-mental factors such as the amount of precipitation, humidity, day length, temperature, texture and potency of soil during its growth which greatly influence its performance or yield (Asif ., 2003). The assessment of a variety in a series of diverse environ-ments to test the consistency in yield
et al
is therefore, a part of majority of the breeding programs (Kaya . 2002). Plant breeders around the country are trying hard to identify wheat genotypes with steady performance over a variety of environments. Only few high yielding wheat genotypes have been evolved by the breeders and are being cultivated across the country (Khan et al., 2011). The true yielding potential of a genotype is the product of its interaction with enviro-nment. The difference in performance of a genotype when subjected to varying environments is termed as genotype × environment (GE) interac-tion (Basford and Cooper, 1998). Varieties having lower degree of fluc-tuation in their yield performance in diverse environments are considered stable and widely adaptable geno-types (Amin et al., 2005).
Heritability is a study of forecas-ting the behaviour of crops in erratic environments (Songsri et al., 2008). It guides the breeder to predict a requir-ed genetic advance from selection in multiple environments. If the herita-bility is high for a particular trait, it can make the selection simpler and easy for that trait (Khan, 2013). However, in advanced generations heritability alone cannot be adequate to bring the desired improvement. Therefore, stress has been given to use heritability with significant magnitude of genetic advance. The effectiveness of herit-ability is boos-ted when accompanied by genetic advance, which projects the amount of genetic advance when subjected to a specific selection pressure. Hence, the use of genetic advance in selection is a significant parameter as it directs the breeder in selection (Ikramullah,
., 2011).
Keeping in view the importance of
et al
wheat and its widespread cultivation across the country an experiment was conducted with the objectives to i) study relative performance of wheat genotypes across contrasting enviro-nments, ii) estimate heritability and genetic advance for various traits across two environments, and iii) identify high yielding wheat geno-type(s) for general cultivation.
A set of 15 wheat diverse wheat genotypes procured from Agricultural Research Station, Skardu (Gilgit-Baltistan) were evaluated at two locations ., The University of Agri-culture Peshawar, Khyber Pakhtun-khwa and Agriculture Department Skardu, Gilgit-Baltistanduring crop season 2011-12 using RCB design in three replications. The germplasm comprised of 9 approved varieties (Shafaq-2006, Faisalabad-2008, Chakwal-50, Bakhar-2002, Lasani-2008, Kohat-2010, Aas-2011, Meraj-200 and Sehar-Meraj-2006); 3 advanced lines from Tajikistan, (5066, 2S-3094 and 2S-4178); one line from PR China (China Selection) and two local cultivars (Mondu Tro and Bagrot). At each location, each genotype/line was sown in five rows of 5m length while rows were 0.3m apart. Appro-ved cultural practices including hoeing, application of fertilizer and irrigation and all other practices necessary for crop management were followed throughout the growing season at each site. Data were recorded on ten randomly selected plants of each genotype at each location from central three rows at proper time on days to heading, days to maturity, plant height, flag leaf area, spike length, spikelet spike , 1000-grain weight and grain yield.
MATERIALS AND METHOD
viz
-1
Statistical Analysis
RESULTS AND DISCUSSION
A. Analysis of variance
B. Variance, heritability and selection Response
Climatic Data
Analysis of variance for indi-vidual trait was performed by Steel and Torrie (1984) using MSTATC computer program. The means were separated by Fisher's protected Least Significant Difference test (LSD).
Variance for the studied parame-ters were formulated from the ana-lysis of variance under each environ-ment to determine broad sense heritability (h ) using the procedure followed by Singh et al (1993)
Where,
Selection response (Re) for a trait at each location was predicted as:
Where,
This experiment was conducted at Peshawar-Khyber Pakhtunkhwa and Skardu (Gilgit-Baltistan). These two locations are totally different from
2 BS
.
Re =
V = Genetic variance; V = Phenotypic variance;
V = Genotype X Environment varia-nce, and
V = Error variance. G
P GE
E
ίx ρh x√ 2
2 2
2
2 2 2 2
d d
d d d d
g g
h (BS) = =
p g + ge + e
ί
ρ =
x selection intensity for trait x; h = heritability for trait x; square root of the phenotypic variance of trait x. selection intensity at 10% will be 1.76 was assumed in predicting direct selection responses at both environ-ments (Falconer and Mackay, 1996).
7.2-9.1 Peshawar 331m 34.017° N 71.583° E 384mm 10.70 33.20
Alkaline Skardu 2248m 35.300° N 75.617° E 202mm 4.70
23.40 Alkaline 7.6-7.9 Location Altitude Latitude Longitude Annual
rainfall
Temperature Soil type
Average PH Min Max
one another and are located about 1000 km away having diverse agro-climatic conditions. Peshawar is located 331m above the sea level with 34.0167° N latitude whereas Skardu is located 2248m above sea level and at latitude of 35.3000°N. Annual precipitation varied from 202 to 384 mm for Skardu and Peshawar respectively. The annual temp-eratures ranged from to 10.7 °C to 32.02°C.at Peshawar, whereas, at Skardu temperature ranged from −4.7 to 23.4°C (Table 1). The crops at Skardu tolerated harsh cold stress (snow) during the months of December and January.
Early heading has a very crucial role in grain formation in majority of crops including wheat. Due to delay Analysis of variance and Mean performance
Days to heading
in heading, lesser time is available for grain filling which ultimately reflects in lower grain weight (Uddin et al. 2015). Significant (P 0.01) difference was observed for days to heading for locations, genotypes, and genotype by location interaction (Table 2). Mean values for genotypes across locations varied from 127.62 and 190.56 days, indicating large variation among genotypes. Overall, genotypes performed better at Peshawar than Skardu. Mean values for genotypes ranged from 147.17 to 174 days where genotype Shafaq-2006 took minimum day's genotype Mondu Tro took maximum days to heading (Fig. 1). Genotype by location interaction means ranged from 113.67 to 203.67days. Mean data revealed that earliest heading was observed for genotype Shafaq-2006 (113.67) at Peshawar, whereas, genotype Mondu Tro (203.67) took
≤
Table 1. Description of experimental environments
Table 2. Mean Squares value of location, genotypes and genotype by location
interaction for various traits in wheat
**, * Significant at 0.01% and 0.05% probability level ns Non significant
Parameters Location (df=1)
Genotypes (df=14)
G×L (df=14)
Error (df=56)
CV %
Days to heading 38.22 1.82 0.38 0.98 10.74 6.75 Days to maturity 7.63 1.52 1.28 0.89 4.58 2.34 Flag leaf area 86.71 8.84 27.02 1.00 16.38 49.43 Plant height 103.02 16.49 22.84 0.90 16.90 16.80 Spike length 1.76 0.34 0.38 0.88 2.19 19.75 Spikelet spike 3.52 0.39 1.28 0.90 3.13 16.81 1000-grain weight 204483.9 672045.4 309734.6 0.35 467.70 1333.23 Grain yield 4016544 1047832 3411448 0.99 3507.82 199.94
Traits Vg Vgy
Ve
h2(BS)
GA GA (%) 250
200
150
100
50
0
113.67
147.17
124.67
188.67
156.67
126.67
190.67
158.67
125.33
187.67
156.5
126.33
190.33
158.33
132.33
193.67
163
126.67
190.33
120.33
185.33
152.83 155.83
127.67
189.67
158.67
124.33
187.33
158.5
180.67
Shafaq 2006
Faisalabad
2008
Chakwal
50
Bakhar
2002
Lasani 2008 Kohat 2010
Aas
2010 Meraj 2008 Sehar 2006
2S-5066 2S- 3094 2S- 4178
Mondu
Tro
China
Selection
Bagrot
Peshawar Skardu Mean
LSD0.05for Location=6.31; LSD0.05for Genotype=1.07; LSD0.05for G x L=1.07
Days To Heading
124
187.67
155.83
127
190.33
158.67
144.33
293.67
174
133.67
195.33
164.5
137.33
197
167.17
Figure 1. Mean values for Days to heading across locations during 2011-12
maximum days for heading at Skardu (Fig. 1). However, on overall basis the genotype Shafaq-2006 took lesser days for heading at both locations. Genotypic, genotype x environment and error variance for days to heading w e r e 3 8 . 2 2 , 1 . 8 2 a n d 0 . 3 8 , respectively. Similar findings have been reported earlier in wheat for days to heading by Khan (2013), who observed significant differences among the genotypes, environments and their interaction. Our results are further supported by the findings of Ijaz et al. (2013), who reported significant difference between
g e n o t y p e s a n d e n v i r o n m e n t s . Ikramullah et al. (2011) also reported s i g n i f i c a n t d i f f e r e n c e a m o n g genotypes and environments in wheat for days to heading. Results of Litvinenko and Abakumenko (1989) are also in line with current findings. They observed significant differences for heading in wheat genotypes.
Days to heading exhibited high broad sense heritability (0.98) accompanied by low genetic advance (6.75) as percent of mean (Table 3), indicating the presence of non-additive type of gene actions which c a n b e m a n i p u l a t e d t h r o u g h
Table 3. Variance components, broad-sense heritability (h2BS) and expected
heterosis breeding. Sardana et al. (2007) proposed that high heritability may not always leads to increased genetic advance, unless adequate amount of variability present in the germplasm. . High heritability accompanied with low genetic advance for days of 50% heading was also reported by Eid (2009). Similarly, Rafiullah et al. (2007) and Ikramullah et al. (2011) also reported high heritability in wheat genotypes.
Analysis of variance for days to maturity revealed highly significant (P 0.01) variations among genotypes, location and their interaction (Table 2). Mean values for genotypes ranged from 190.83 to 202.83 days (Fig. 2). Among locations, at Peshawar genotypes took 164.17 days for maturity, whereas, at Skardu genotypes matured in 227.09 days where earliest maturity was recorded for Shafaq-2006 , whereas, maximum
Days to Maturity
≤
days for maturity were taken by genotype Bagrot (Fig. 2). Mean data for genotypes and its interaction with the environment revealed that g e n o t y p e S h a f a q - 2 0 0 6 t o o k minimum days (157.33) at Peshawar whereas, genotype Bagrot (232.67) took maximum days to mature at Skardu (Fig. 2). On overall basis, g e n o t y p e S h a f a q - 2 0 0 6 t o o k minimum days to maturity at both environments. Current findings are supported by the earlier reports of Inamullah et al. (2011) who reported significant variations among wheat genotypes for maturity. As per Worland et al. (1994) photo-sensitivity and verna-lisation-sensitive genes determine the differences in maturity in different crop varieties because genes re-sponsible for earliness are responsive to temperature. Salfer (1996) also reported that early maturing varieties/lines respond to high
250
200
150
100
50
0
157.33 162 162.33 162.67 165 165 162.67 162.67 164.33 165 162.33 162.67
168 169.33 173 190.83 194 194.33 193.83 197 195.67 194.5 193.17 195.83 196 194.17 194.33 197.67 200.17
202.83
224.33 226 226.33 225 229 226.33 226.33 225.67 227.33 227 226 226 227.33
231 232.67
Shafaq 2006
Faisalabad
2008
Chakwal
50
Bakhar
2002
Lasani 2008 Kohat 2010
Aas
2010 Meraj 2008 Sehar 2006
2S-5066 2S- 3094 2S- 4178
Mondu
Tro
China
Selection
Bagrot
Peshawar Skardu Mean
LSD0.05for Location=11.74; LSD0.05for Genotype=1.98; LSD0.05for G x L=1.98
Days To Maturity
temperature at time of maturity in case of occurrence of intrinsic earliness genes.
The estimates of broad sense heritability were high (0.89) for days to maturity indicating the presence of less environmental effect on this trait among tested genotypes further suggesting the existence of non-additive type of gene action. Low genetic advance (2.34) as percent of mean (Table 3) also indicates the effect of non-additive gene action for this trait. High heritability coupled with low genetic advance suggested the effectiveness of specific selection procedure for the improvement of this trait. High heritability for days to maturity in bread wheat was also observed by Ijaz . (2013) and Singh (2009).
Flag leaf area is considered as the main contributor in grain formation in wheat therefore larger flag leaf
et al et al.
Flag leaf area
areas is preferred by the breeders in wheat. Analysis of variance displayed significant differences for flag leaf area among genotypes, whereas, non-significant differences were exhibited between locations and its interaction with genotypes (Table 2), suggesting the existence of sufficient genetic variability among tested genotypes. Mean value for flag leaf area across locations showed maximum value at Peshawar (34.76cm) and minimum at Skardu (33.63cm). Mean values for genotypes ranged from 23.32 to 54.13 cm where genotype Kohat-2010 attained minimum and genotype China Selection displayed maximum flag leaf area. As per interaction, minimum flag leaf area was recorded for genotype Kohat-2010 (23.12cm) at Skardu, whereas, maximum mean value (54.64cm) was recorded for g e n o t y p e C h i n a S e l e c t i o n a t Peshawar (Fig. 3). Rahim . (2006) also found significant differences among wheat genotypes. However,
et al
Figure 3. Mean values for flag leaf area across locations during 2011-12
60
50
30 40
20
10
0
Shafaq 2006
Faisalabad
2008
Chakwal
50
Bakhar
2002
Lasani 2008 Kohat 2010
Aas
2010 Meraj 2008 Sehar 2006
2S-5066 2S- 3094 2S- 4178
Mondu
Tro
China
Selection
Bagrot
Peshawar Skardu Mean
LSD0.05for Location=53.93; LSD0.05for Genotype=9.10; LSD0.05for G x L=9.10
Flag leaf area
40.94
39.33 40.13
26.8 27.18 25.61 25.63 25.62
36 34.57 35.28
29.78 28.84 29.31
23.53 23.12 23.32 32.43 31.1 31.77
34.35
32.77 35.56 30.78 30.13 30.45
33.83 32.5 33.16 29.79 29.13 29.46
26.46
54.64 53.78
42.02
24.83
53.63 52.3
39.77
25.65
54.13 53.04
40.89
Mcneal and Berg (1977) observed non-significant differences for flag leaf area in wheat. The contrasting results could be attributed to differences in the germplasm or severity in environments.
In the present investigation, high heritability (16.38) estimates coupled with high genetic advance (49.43) were recorded for flag leaf area (Table 3) suggesting the presence of additive type of gene action, hence selection in early generation would be more effective. Current results are in line with the earlier findings of Ali . (2008), Haq . (2008) and Chowdhry et al. (1997) who reported high heritability and genetic advance in wheat.
Plant height is vital character in wheat improvement programs. Plant breeders usually focus on short or medium height that helps in lodging resistance. It also utilizes chemical
et al
et al
Plant height
fertilizers, irrigation and other inputs efficiently. Current data revealed s i g n i f i c a n t d i f f e r e n c e s a c r o s s locations whereas, highly significant differences were observed among wheat genotype and its interaction with environment (Table 2). Locations means showed that genotypes grown at Peshawar attained maximum plant height (100.96cm) while minimum plant height (94.07cm) was recorded at Skardu. Mean values for plant height among wheat genotypes ranged from 78.40 (Shafaq-2006) to 122.20cm (Mondu Tro) (Fig. 4). In Genotype x Location interaction, genotype Shafaq-2006 (72cm) produced short plants at Skardu whereas tall plants were produced by genotype Mondu Tro (122.93cm) at Peshawar (Fig.4). However, on overall basis, genotype Mondu Tro attained maximum plant height at both locations. Current findings confirm the earlier results of Khan et al. (2013) who reported significant
Figure 4. Mean values for plant height across locations during 2011-12
140
120
80
60 100
40
20
0
Shafaq 2006
Faisalabad
2008
Chakwal
50
Bakhar
2002
Lasani 2008 Kohat 2010
Aas
2010 Meraj 2008 Sehar 2006
2S-5066 2S- 3094 2S- 4178
Mondu
Tro
China
Selection
Bagrot
Peshawar Skardu Mean
LSD0.05for Location=4.9; LSD0.05for Genotype=8.3; LSD0.05for G x L=8.3
Plant height
84.8
78.4
102.2
78.53
89.87 90.93 81.6 86.27
97
91.8 94.4
100.87
91.27 96.07 92.33 89.8 91.07
107.07
94.53 100.8
103.4
88.73
96.07
102.33
93 97.67
101.67
96.93 99.3
93.53 93.87 93.7 97.4 96.7
103.47 106.87 105.17 122.93 121.47 122.2
115.53 114.6 115.07
96
differences among wheat genotypes, environments and their interaction.
Plant height exhibited high heritability (0.90) associated with high genetic advance (16.80) (Table 3), pointing towards the effectiveness of selection in early generation. Current results are in line of earlier reports of Kalimullah . (2012) who reported high heritability for plant height in wheat. Ikramullah et al. (2011) also reported high heritability for plant height in wheat genotypes across different locations.
Highly significant (p<0.001) differences were observed for spike l e n g t h a m o n g g e n o t y p e s , environments and GE interaction (Table 2) indicating the presence of sufficient genetic variability among tested genotypes. Mean value for location ranged from 10.20 to 12.02cm where minimum spike lengths were noted at Skardu and
et al
Spike length
maximum spike lengths were recorded at Peshawar. Among genotypes, spike length ranged from 9.72 to 14.75cm for genotype Chakwal-50 and China Selection respectively. Mean values for interaction ranged from 8.60cm (for genotype Faisalabad-2008) at Skardu to 15.23cm ( for genotype China Selection) at Peshawar (Fig.5). Current results are in conformity with earlier results of Khan (2013) who observed significant difference among genotype, location and genotype by environment interaction in wheat genotypes. Khalil . (2006) also found highly significant difference for spike length among wheat genotypes.
The estimates of broad sense heritability and genetic advance for spike length were high (0.88 and 19.75, respectively) (Table 3) indicating the involvement of additive type of gene action. This type of results helps plant breeders to exploit
et al
Figure 5. Mean values for spike length across locations during 2011-12
16
14
10
6 8 12
4
2
0
Shafaq 2006
Faisalabad
2008
Chakwal
50
Bakhar
2002
Lasani 2008 Kohat 2010
Aas
2010 Meraj 2008 Sehar 2006 2S- 5066 2S- 3094 2S- 4178
Mondu
Tro
China
Selection
Bagrot
Peshawar Skardu Mean
LSD0.05for Location=6.31; LSD0.05for Genotype=1.07; LSD0.05for G x L=1.07
Spike length
11.07
8.77
9.92
11
8.6
9.8
10.77
8.67
9.72
11.93
9.67
10.8
10.1 9.73 9.92
14.07
10.2
12.13
11.73
9.8
10.77
12.2
9.63
10.92
12.5
10.33
11.42
12.57
10.27
11.42
10.5 10.17 10.33
15.23
14.27 14.75
12.47
11.27 11.87
13.33
12.83 13.08
9.83
10.8
such traits through selection in early generations. Our results are in agreement to the earlier findings of Laghari . (2010) who found high heritability for wheat genotypes. High heritability estimates were also reported by and Kashif and Khaliq (2004) in wheat.
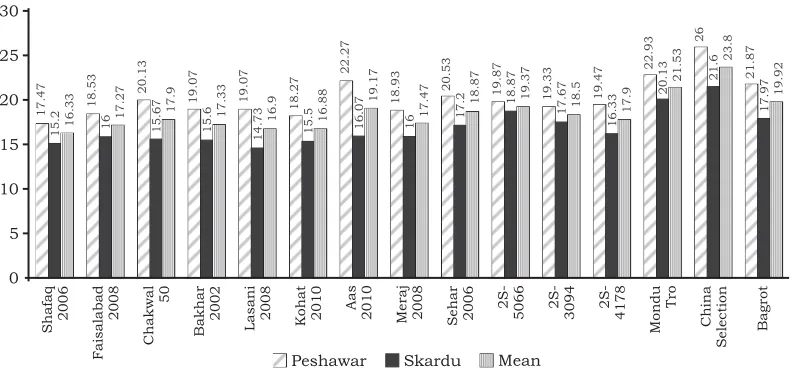
Number of spikelets spike is one of the important yield contributing trait in wheat. Mean square values for spikelets spike showed significant (p<0.001) differences for locations, genotypes and their interaction (Table 2) suggesting the presence of reasonable variability among the tested genotypes and locations. Genotype mean values for spikelet spike ranged from 16.33 (Shafaq-2006) to 23.80cm (China Selection). Mean value across location showed m a x i m u m s p i k e l e t s s p i k e a t Peshawar (20.25cm) and minimum spikelets spike at Skardu (16.97). Interaction means were minimum for
et al
Spikelets spike-1
-1
-1
-1
- 1
-1
genotype Lasani-2008 (14.73cm) at Skardu while maximum for genotype China Selection (26cm) at Peshawar (Fig. 6). Genotype Mondu Tro and China Selection revealed more spikelet spike in genotype and genotypes × location interaction. Highly significant differences for spikelets spike were also reported by Khan (2013).
Spikelets spik showed high heritability (0.90) coupled with high genetic advance (16.81) (Table 3), indicating the presence of additive genes in controlling this trait. Hence, selection in early generation for the improvement of spikelets spike would be effective. Current findings are in conformity with the earlier reports of Gupta, . (2004) and Deswal, . (1996).
Thousand grains weight is very i m p o r t a n t y i e l d c o n t r i b u t i n g character and is given more emphasis during cultivar development process.
-1
-1
-1
-1
et al et al
1000-grain weight
Figure 6. Mean values for spikelets spike-1 across locations during 2011-12
17.47
15.2 16.33
18.53
16 17.27
20.13
15.67 15.6
17.33 18.27
19.07
14.73
16.9
15.5
16.88
22.27
16.07
19.17 18.93
16
17.47
20.53
18.87 18.87 19.37 19.33 17.67 18.5
19.47
16.33
17.9
26
21.6
23.8
22.93
20.13
21.53 21.87
17.97
19.92
19.87
17.2
17.9 19.07 30
25
15 20
10
5
0
Shafaq 2006
Faisalabad
2008
Chakwal
50
Bakhar
2002
Lasani 2008 Kohat 2010
Aas
2010 Meraj 2008 Sehar 2006 2S- 5066 2S- 3094 2S- 4178
Mondu
Tro
China
Selection
Bagrot
Peshawar Skardu Mean
LSD0.05for Location=11.74; LSD0.05for Genotype=1.98; LSD0.05for G x L=1.98
Analysis of variance revealed significant differences among the g e n o t y p e s , l o c a t i o n s a n d i t s interaction with genotypes for 1000-grain weight (Table 2). Genotype mean values for 1000-grain weight ranged from 30.92g to 44.49g. Minimum mean values for 1000-grain weight were recorded for the genotype China Selection 30.92g while; maximum mean values were recorded for genotype Sehar 2006 (44.94g) for 1000-grain weight. Mean value for 1000 grain weight for the genotype grown at Skardu were minimum (33.33g) while 1000 grain weight at Peshawar were recorded maximum 36.83g. The interaction mean data for 1000 grain weight revealed minimum for the genotype Bagrot 13.35g at Peshawar while maximum 1000-grain weight were recorded for genotype 2S-3094 (43.45g) at Peshawar (Fig. 7). Overall genotype 2S-3094 and Faisalabad 2008 showed maximum values for 1000-grain weight in genotypes and genotypes × location interaction.
Present results are supported by the findings of Khan (2013) and Ahmad et al. (2009) who reported significant difference for 1000-grains weight.
Thousand grains weight exhibits low heritability (0.35) coupled with high genetic advance (1333.23) (Table 3), indicating the selection in later generation for the improvement of 1000-grain weight would be effective. Current findings are contradictory with the earlier reports of Gupta, . (2004).
Analysis of variance showed significant differences (p<0.01) for genotypes, locations and their interaction for the grain yield (Table 2). Grain yield for all genotypes ranged between 1719 kg ha and 4775 kg ha . Maximum mean values for grain yield was recorded from the genotype 2S-3094 (4775 kg ha ) whereas, minimum mean value for grain yield was obtained from the genotype Bagrot (1719 kg ha ) (Fig. 8). Mean value for grain yield
-1 -1
-1
-1 et al
Grain yield
Figure 7. Mean values for 1000-grain weight across locations during 2011-12
50
30 35 40 45
20 25
10
5 15
0
Shafaq 2006
Faisalabad
2008
Chakwal
50
Bakhar
2002
Lasani 2008 Kohat 2010
Aas
2010 Meraj 2008 Sehar 2006 2S- 5066 2S- 3094 2S- 4178
Mondu
Tro
China
Selection
Bagrot
Peshawar Skardu Mean
LSD0.05for Location=1.8; LSD0.05for Genotype=3.0; LSD0.05for G x L=3.0
1000-grain weight
35.27 36.67 35.97
40.92
39.17 40.04
35.57
30 32.78
28.77
35.83
32.3
36.42 35.83 36.13
31.08
37.5
34.29
41.67
38.33 40
34.48
40.83
37.66 39.17 40 39.58 40.58
37.5 39.04
43.45
40 41.73
33.2 35 34.1
17.07
32.5
24.78
21.83
40
30.92
13.35
30
recorded minimum (3665 kg ha ) at Peshawar location, while maximum (3850 kg ha ) was recorded at Skardu. Interaction means for grain yield revealed minimum value for genotype Bagrot (1719 kg ha ) while maximum were recorded by genotype Faisalabad 2008 (4904 kg ha ) at Peshawar (Fig. 8). Overall genotype 2S-3094 and Faisalabad 2008 showed maximum grain yield ha . Present results are in line with the earlier findings of Khan (2013) who found significant differences among g e n o t y p e s , e n v i r o n m e n t s a n d genotype × environment. Khalil et al. (2008) also reported highly significant differences among wheat genotypes for grain yield across environments.
Grain yield exhibited high heritability coupled with high genetic advance of 0.99 and 199.94 %, respectively (Table 3). Which directs the presence of Additive genes in controlling this trait and selection would be efficient in early generation. Present results are in conformity with the Ikramullah et al. (2011) and
-1
-1
-1
-1
-1
Kashif and Khaliq (2004), who observed high heritability and genetic advance in wheat population.
CONCLUSION
LITERATURE CITED
All the studied traits were under environmental influence except flag leaf area. Genotype Faisalabad-2008 and line from Tajikistan (2S-3094) performed superior for yield and associated traits than the rest of the studied genotypes across both e n v i r o n m e n t s a n d h e n c e a r e indicative of their potential to adapt to fluctuating environments. The high magnitude of heritability and genetic advance provide evidence that the traits were predominantly controlled by additive type of gene actions. Therefore, it is recommended that selection will be effective in early generations.
Ahmad. Z., M. Y. Mujahid, M. A. Khan, M. Qamar, N.S. Kisana and S. Z. Mustafa. 2009. Evaluation of promising bread
Figure 8. Mean values for grain yield across locations during 2011-12
3740.47
3485.19 3612.96
4904
4509.26 4706.63
3885.19
3357.41
3621.3
3192.59 3055.56 3124.07
4537.04
4251.85 4394.44
3670.37
4324.07
3997.22
3485.19 3746.3 3615.74
4509.26
4088.89 4299.07
4662.96
4509.26 4586.11
4142.59
3981.48 4062.04
4840.74 4709.26 4775 4892.59 4468.52 4680.55
1587.04
2614.08
2100.56
1822.22
4184.64
3003.43
974.07
2464.52
1719.3
5000
3000 4000 6000
2000
1000
0
Shafaq 2006
Faisalabad
2008
Chakwal
50
Bakhar
2002
Lasani 2008 Kohat 2010
Aas
2010 Meraj 2008 Sehar 2006 2S- 5066 2S- 3094 2S- 4178
Mondu
Tro
China
Selection
Bagrot
Peshawar Skardu Mean
LSD0.05for Location=1916; LSD0.05for Genotype=3234; LSD0.05for G x L=3234
wheat ( L.) lines under normal and late plantings. J. Agric. Res. 47(2): 127-135. Asif, M., S. Z. Mustafa, M. Asim, N. S.
Kisana, M.Y. Mujahid, I. Ahmad and Z. Ahmed. 2003. Stability of wheat genotypes for grain yield under diverse rainfed ecologies of Pakistan. Asian J. Plant Sci. 2 (4): 400-402.
Amin, M., T. Mohammad, A.J. Khan, M. Irfaq, A. Ali and G.R. Tahir. 2005. Yield stability of spring
wheat ( L.) in
the North West Frontier Province, Pakistan. Song-klanakarin J. Sci. Technol., 27(6): 1147-1150. Ali, Y., B. M. Atta, J. Akhtar, P.
Monneveux and Z. Lateef. 2008. Genetic variability, association and diversity studies in wheat
( L . )
germplasm. Pak. J. Bot. 40(5): 2087-2097.
Basford, K. E. and M. Cooper. 1998. G e n o t y p e x e n v i r o n m e n t i n t e r a c t i o n s a n d s o m e c o n s i d e r a t i o n o f t h e i r implications for wheat breeding in Australia. Aust. J. Agric. Res., 49: 153-174.
Chowdhry, M. A., S. Iqbal, G.M. Subhani and I. Khaliq. 1997. Heritability of some quantitative characteristics in bread wheat
( L.). JAPS. 7:
27-28.
Deswal, R. K., S. S. Grakh and K. K. Berwal, 1996. Genetic variability and characters association between grain yield and its components in wheat. Ann. Biol. 12: 221–24.
Eid, M. H. 2009. Estimation of heritability and genetic advance of yield traits in wheat (
L.) under drought
Triticum aestivum
Triticum aestivum
T r i t i c u m a e s t i v u m
Triticum aestivum
Triticum aestivum
condition. Internat. J of Genet. and Mol. Biol., 1 (7):115-120. Falconer, D. S. and T. F. C. Mackay.
1 9 9 6 . I n t r o d u c t i o n t o Quantitative Genetics (4th Ed.) Longman, Essex, UK. French, R. T. 1977. Oriental and brown m u s t a r d s e e d p r o d u c t i o n . Techniques Bulletin. 2: 1-2. Gupta, A. K., R. K. Mittal and A.
Ziauddin. 1999. Association and factor analysis in spring wheat. Ann. Agric. Res. 20: 481-485. Hussain, A. 1995. Wheat and barley
varieties of Pakistan. National Seed Registration Dept., Ministry of Food, Agric. and Livestock, Islamabad.
Haq, W. U., M. F. Malik, M. Rashid, M. Munir and Z. Akram. 2008. Evaluation and estimation of h e r i t a b i l i t y a n d g e n e t i c advancement for yield related attributes in wheat lines. Pak. J. Bot. 40(4): 1699- 1702.
Ikramullah, I.H. Khalil, H. Rahman, F. Mohammad, Hidayatullah and S.K. Khalil. 2011. Magnitude of h e r i t a b i l i t y a n d s e l e c t i o n response for yield traits in wheat u n d e r t w o d i f f e r e n t environments. Pak. J. Bot. 43(5): 2359-2363.
Inamullah, F. Khan and I.H. Khalil. 2011. Environmental effect on wheat phenology and yields. Sarhad. J. Agric. 27(3): 395-402. Ijaz, F., I. Khaliq, M.T. Shahzad and
B. Salam. 2013, Computation of Heritability of yield and some morphological traits in F2 population of spring wheat
( L) Intl. J.
Modern Agric. 2(3):102-107. Kaya, Y., C. Palta and S. Taner. 2002.
Additive main effects and m u l t i p l i c a t i v e i n t e r a c t i o n
analysis of yield performances in bread wheat genotypes across environments. Tur. J. Agric. For. 26: 275-279.
Kashif, M and I. Khaliq. 2004. Heritability, correlation and path coefficient analysis for some metric traits in wheat. Intl. J. Agric. Biol. 69(1):138-142.
Khalil, I.H., S.A. Jadoon and G. Hassan. 2006. Effect of forage clipping of grain yield and associated traits in winter wheat under agro climatic conditions of Abbottabad. Sarhad J. Agric. 22(4): 517-522.
Khan, M.A.U., T. Malik, S.J. Abbas, Z. Abbas, A. Khan, M. Malik and S. Asghar. 2011. Study of genetic variability and correlation among various traits of F wheat populations. Intl. Res. J. Agric. Sci., 5 1(8): 344-348.
Kalimullah, S., J. Khan, M. Irfaq and H.U. Rahman. 2012. Genetic variability, correlation, and diversity studies in bread wheat
( L . )
germplasm. JAPS. 22(2):330-333.
Khan, S. 2013. Genotype × location effects, heritability and selection response for maturity and yield related traits in wheat under rainfed conditions. M.Sc. (Hons) Agric. Thesis., PBG Deptt, The U n i v e r s i t y o f A g r i c u l t u r e Peshawar Pakistan.
L i t v i n e n k o , N . A a n d A . V . Abakumenko. 1989. Methods of selecting drought resistant forms and varieties of wheat. Plant Br. Absts. 59(10): 635.
Laghari, K.A., M.A. Sial, M.A. Arian, A.A. Mirbahari, A.J. Pirzada, M.U. Dahot and S.M. Mangrio. 2010. Heritability studies of yield
T r i t i c u m a e s t i v u m
and yield associated traits in bread wheat. Pak. J. Bot. 42(1): 111-115.
Mcneal, F.H and M.A. Berg. 1977. Flag leaf area in five spring wheat crosses and the relationship to grain yield. ; 26(3):739-744.
Rahim, M.A., A. Salam, A. Saeed, A. Shakeel and G. Abbass. 2006. Combining ability for flag leaf area, yield and yield components in bread wheat. J Agric. Res. 44(3): 175.
Steel, R.G.D and J.H. Torrie. 1984. Principles and Procedures of Statistics. McGraw Hill Book Co. Inc. New York USA.
Singh, M., S. Ceccarelli and J. Hamblin. 1993. "Estimation of heritability from varietal trials data." Theoretical and applied genetics 86.4: 437-441.
Slafer, G.A. 1996. Differences in phasic development rate amongst wheat cultivars independent of responses to photoperiod and vernalization. A viewpoint of the intrinsic earliness hypothesis. J. Agric. Sci. 126: 403-419.
Sardana, S., R. Mahjan, N. Gautam, B. Ram. 2007. Genetic variability
in pea ( L.)
germplasm for utilization. SABRAO J. Breed. Genet. 39(10):31-41.
Songsri, P., S. Jogloy, T. Kesmala, N. Vorasoot, C. Akkasaeng, A. Patanothai and C.C. Holbrook. 2008. Heritability of drought resistance traits and correlation of drought resistance and agronomic traits in peanut. Crop. Sci.48 (6): 2245-2253.
Singh, B.D., P.R, Majumda and K.K. Prassad 2009. Heritability studies in timely sown irrigated
Pisum sativum
wheat. J. Applied. Biol. 9(2): 105-107.
Uddin, F., F. Mohammad and S. A h m e d . 2 0 1 5 . G e n e t i c D i v e r g e n c e i n w h e a t Recombinant Inbred lines for yield and yield components. Am-Euras. J. Agric. & Environ. Sci., 15(9): 1854-1859.
Rafiullah, M. Zahir, I. H. Khalil and Asadullah. 2007. Heritability for heading, maturity, plant height,
s p i k e l e n g t h a n d t i l l e r s production in winter wheat
( ). Pak. J. Pl.
Sci. . 13(1): 67-73, 2007
Worland, A.J., M.L. Appendino and E . L . S a y e r s , 1 9 9 4 . T h e distribution, in European winter wheats, of genes that influence eco-climatic adaptability whilst d e t e r m i n i n g p h o t o p e r i o d i c insensitivity and plant height. Euphytica. 80: 219-228.