Printed in The Islamic Republic of Iran, 2018 © Shiraz University
Quantitative Analysis of Thermo-Mechanical Behavior in 414 Stainless
Steel Using Flow Curves and Processing Maps
M. Chegini
1, M.R. Aboutalebi
2*, S.H. Seyedein
2and G.R. Ebrahimi
31School of Metallurgy and Materials Science, Iran University of Science and Technology (IUST), Narmak, Tehran, Iran.
2Center of Excellence for Advanced Materials and Processing (CEAMP), School of Metallurgical and Materials Engineering, Iran University of Science and Technology (IUST), Narmak, Tehran, Iran.
3Materials and Polymers Engineering Department, Faculty of Engineering, Hakim Sabzevari University, Sabzevar, Iran.
Abstract: The hot deformation behavior of a typical martensitic stainless steel containing 2.1% Ni was investigated by means of the compression test in the strain rate range of 0.001-1 s-1 and temperature range of 950-1150 °C. The flow behavior of the steel was evaluated using the flow stress curves and flow-softening map as well as microstructural investigation. The Z and Q maps were plotted as a function of the strain rate and the strain taking into account the strain effect on the hot deformation behavior. In order to obtain the optimum hot deformation regime, the m-map was constructed. It was found out that all restoration mechanisms i.e. dynamic recovery and dynamic recrystallization phenomena take place at different hot working conditions. It was also found out that the dominant softening mechanism at different hot deformation domain depends upon Z parameter. According to the flow curves and also Z, Q, and m maps, the optimum hot deformation conditions have been obtained as: strain range of 0.25-0.5, temperature range of 1000-1100 °C, and strain rate of 0.01-0.1 s-1.
Keywords: Martensitic stainless steel, Flow curves, Processing maps, Strain effect.
1. Introduction
Martensitic stainless steel has been commonly used for a component with high strength and medium corrosion properties [1]. For many of these applications, the improvement of corrosion resistance can be made by adding several alloying elements like Ni which can be beneficial to improve the service life.
Generally, the hot deformation process is one of the most important industrialized methods to manufacture stainless steel components. It is possible to achieve various microstructures by changing hot deformation conditions i.e. temperature and strain rate [1, 2]. Hence the wide range of mechanical properties can be achievable but it is necessary to determine the optimum deformation conditions at an elevated temperature. Many researchers studied the hot deformation behavior of materials using the processing maps for a wide range of alloys such as Al [3], Zr [4], Fe [5], Ti [6], Ni [7] and Mg [8] in order to model the flow behavior of materials, while various studies were focused on the development of the constitutive equations [9-12]. However, the effect of strain was not taken into account in the processing maps and constitutive equation for materials[13].
In this study, the effect of strain on the Zener-Hollomon and the activation energy over wide and practicable temperatures and strain rates are studied using the experimental data obtained from hot compression test on 414 Martensitic steel samples. In the following, the strain rate sensitivity (m) map as one of the most important parameters is extracted in order to determine the hot workability of the
materials [14]. Finally, according to the microstructure of the studied stainless steel and other state variable maps, the optimum hot deformation conditions of studied materials are determined.
2. Experimental procedure
The chemical composition of the alloy used in this study is given in Table 1. The samples for the compression test were prepared in the diameter and height of 10 and 15 mm, respectively via electro-discharge machine from the ingot (wrought) with the dimension of 250*100*20 mm. The compression tests were performed by a Zwick/Roell 250 universal testing machine at a strain rate range of 0.001-1 s-1
and at a temperature ranging from 950 to 1150 °C. For the purpose of reserving the as-deformed microstructure, the specimens were quenched immediately after the compression test. All the specimens were ground and polished to prepare the proper surfaces for the etching. The polished samples were then electroetched using the solution of 65 ml nitric acid and 35 ml H2O to reveal the microstructure. The
microstructure of the steel samples was analyzed before and after the hot deformation by optical microscope of HUVITZ HR3-TRF-P.
Table 1. Chemical composition of the studied steel.
Elements Fe C Cr Si Mn Ni
Composition Bal. 0.1 12.5 0.54 0.83 2.1
3. Results and discussion
3.1. Flow stress analysis
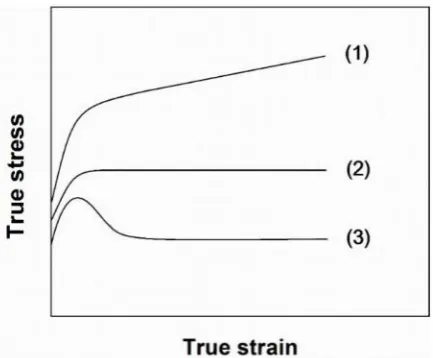
The true stress-strain curves can be basically divided into three types, as shown in Fig.1 where the type of curves is in a meaningful relation with the involved restoration mechanism. The first type shows the sharp rise at low strains and by increasing the strain, the rate of stress rising reduces since work hardening overcomes softening mechanism. The second type depicts the trending like the first type, but at high strain levels it shows the steady stress region. This trend indicates that at the final stage of deformation, the rate of work hardening is becoming equivalent to the rate of softening which is the typical feature of dynamic recovery. In the third kind of curves, the flow stress incessantly reaches to the peak stress and follows with the reduction of stress to the steady state stress which resulted into dynamic recrystallization. The kinetics and relative amount of decline in this type are associated with the amount of softening [15].
Fig. 1. Schematic illustration of various types of flow curves.
recrystallization, due to a longer time of deformation as the dominant mechanism of restoration. At the higher strain rate, i.e. 0.01 and 0.1 s-1at a given temperature, the amount of DRX grain increases. At the
strain rate of 1 s-1, the flow stress shows the steady state condition at the end of the deformation.
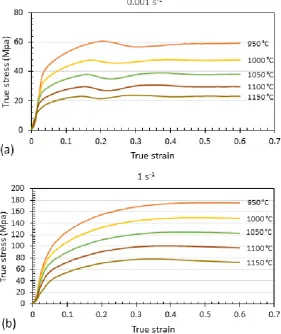
Consequently, at this condition, the DRV is the dominant softening mechanism. According to Fig. 2a and b, increasing the temperature at a constant strain rate leads to a reduction in the flow stress level. In addition, at higher temperatures, i.e. 1050-1150 °C at a given strain rate, the flow curves consist of the multi peaks at the same time, while at lower temperatures only one peak can be observed. This is because of the enhanced mobility of the dislocation as the temperature rises and the cycles of DRX occur simultaneously. On the other hand, at lower temperatures, subsequent cycles of DRX overlap with each other and just one peak can be observed.
Fig. 2. True stress-strain curves of 414 martensitic stainless steel at various temperatures and constant strain rates of (a) 0.001 s-1 and (b) 1 s-1.
3.2. Microstructure evolution
incipient DRX grains, and the percent of DRX is insignificant rather than higher strain rate of 0.01 s-1 at
Fig. 3. Optical microstructure of base and directly quenched specimens of 414 martensitic stainless steel right after the hot compression tests at various deformation conditions: (a) wrought base
(b) 950 °C, 0.01 s-1 (c) 1050 °C, 0.01 s-1 and (d) 1050 °C, 0.001 s-1.
3.3. Correction of the friction and deformation heating effects
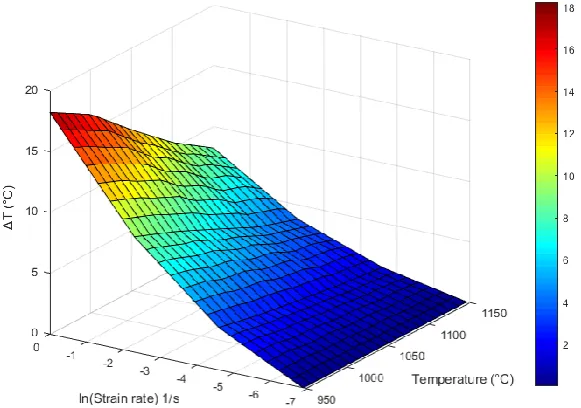
During the compression test, in order to minimize the friction between the surfaces of the samples and the tools, various kinds of lubricants can be used. However, it is not quite a practical process to eliminate the friction effectively and completely and so the flow stress curves shift to the higher level of stress. On the other hand, the increase in the strain rate leads to a decrease in the time of the deformation which reduces the heat loss to the surroundings. Therefore, the heat of deformation results in a considerable increase in the steel sample temperature and causes the shifting of the true stress-strain curves to lower stress levels. Therefore, in order to implement accurate values in mathematical formulas, the flow stress curves obtained from hot compression test are corrected considering the frictional and deformation heating effects [17, 18]. The computed temperature rise of the sample is shown in Fig. 4 in which the effects of the strain rate and hot deformation temperature on the average 5.56 °C temperature rise of the sample is illustrated. It is obviously understood from the figure that, increasing the strain rate and decreasing the temperature lead to increases in the rise of the temperature. By increasing the strain rate, the thermal state changes from isothermal to adiabatic and the temperature decreases by bolding the temperature rise. The change of the thermal state is related to the strain rate. At lower strain rates the sufficient time exists to eliminate the temperature rise, and therefore, by increasing the strain rate the time for the elimination of the temperature rise reduces.
3.4. Flow softening map
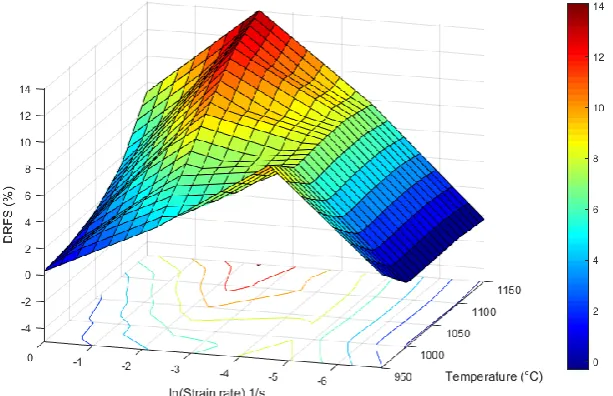
In order to investigate the variation of true stress-strain curves during the hot compression test, the restriction of the decline ratio of flow stress (DRFS), Rd, is used. Rd refers to the percent of the decline in
flow stress from the peak stress to the stress at the end of the deformation and it can be calculated from Eq. (1) [16].
(1)
where σp is the peak stress and σe is the flow stress associated with the highest value of strain.Figure 5
indicates the flow softening map of 414 steel obtained from flow curves obtained at different deformation conditions. According to this map, two distinct regions can be recognized:
Region I: at a higher strain rate of 0.0025 s-1 and all over the temperature range (according to Fig. 2), the
DRX is the dominant mechanism of restoration. In this region, at the intermediate strain rate, i.e. 0.135-0.018 s-1 and higher temperature of 1025 °C, the decline ratio is significant which shows that the DRX
has occurred all over the materials. Therefore, the hot deformation behavior of the studied material in this region leads to the achievement of uniform grain size, and as a consequence, good mechanical properties.
Region II: at a lower strain rate of 0.0025 s-1 and the temperature range of 950-1150 °C the amount of flow
softening is lower than 3%. According to Fig. 2, at this region, the DRV is the dominant mechanism of softening.
Fig. 5. Contour map of flow softening parameter as a function of strain rate and temperature at a strain of 0.6.
3.5. Zener-Hollomon parameter map
During the hot deformation of materials, the microstructure of the deformed sample is determined by the combination of the strain rate and the temperature. The Zener-Holloman parameter is often used to describe the relationship between strain rate, temperature, and flow stress [19] which is commonly described via Arrhenius type constitutive equation [20]:
(2)
where is the strain rate, Q is the activation energy for deformation (kJ/mol), R is the gas constant (8.314 J.mol-1.K-1), T is the absolute temperature (K), is the peak stress, A, and n are material constants.
attention in the related researches. In order to investigate the effect of strain on Z parameter, the map of Z parameter as a function of strain rate and strain at a constant temperature of 1050 °C is plotted and shown in Fig. 6. As it can be seen, at the middle of strain levels, 0.2-0.5, and lower strain rate of 0.1 s-1, the Z
parameter has lower values. It has been found that the DRX occurs at the lower Z. This means that the lower strain rate and higher temperature is the best hot deformation condition for the occurrence of the DRX. Following the variation trend of the Z at constant strain rate, it can be found that at the lower values of strain, the Z keeps the higher values and subsequently the increment of the strain leads to the decrease of the Z parameter. In other words, while performing hot deformation at a constant temperature and strain rate, the Z value is just a function of deformation activation energy (Q) regarding Eq. (2). In this case, it can be deduced from this variation trend that, strain dependency of Z parameter is a clear consequence of direct strain effect on activation energy.
Fig. 6. Z-value map as a function of strain rate and strain at a constant temperature of 1050 °C.
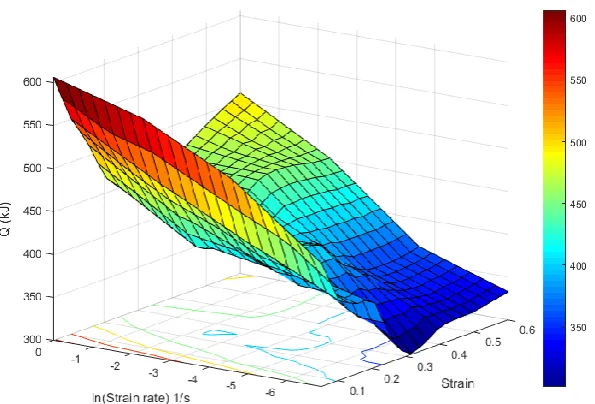
3.6. The Q-map
Generally, The Q factor is conventionally used to estimate the flow behavior. By using Eq. (2), the Q can be calculated by the following equation [22-24]:
(3)
Fig. 7. Q-value map as a function of strain rate and strain. 3.7. The m parameter map
One of the most important factors representing the hot workability of the materials is strain rate sensitivity (m) which is a function of strain rate and temperature. Generally, the relationship between the flow stress and strain rate is defined by the following equation [26, 27]:
(4)
where the σ is the flow stress, is the strain rate, m is the strain rate sensitivity, and k is the material constant. Taking the natural logarithm on sides of Eq. (5) yields [28]:
(5)
Then by using the curve slope of ln(σ)-ln( ) [29, 30], m can be calculated. Figure 8 shows the contour map of m with strain rate and temperature. As can be recognized from Eq. (4), the higher m value leads to an increase in the required flow stress for deformation with strain rate. Therefore, according to Fig. 8 which presents the m-value map as a function of strain rate and temperature at strain of 0.4, in the regions with higher m value, the work hardening rate is higher than that of other regions which leads to the rise of the flow stress required to resume deformation, thereby the local deformation is prevented [31]. Hence with the aim of attaining the suitable microstructure and higher uniform deformation, the hot deformation regime should be in the higher m value.
4. Conclusion
The hot deformation behavior of the 414 (Fe-0.1 C-2.1 Ni-12.5 Cr) martensitic stainless steel is investigated over the wide range of the temperature and strain rate. Based on the obtained results, the following conclusions can be made:
1. The true stress-true strain curves have shown that the flow stress level of the studied steel has a direct relationship with the strain rate and an inverse relationship with the temperature and these two influential parameters activate the restoration mechanisms during hot working.
2. The flow softening mechanism is intensively related to the deformation condition. The occurrence of the DRX is more significant at the lower strain rates i.e. 0.001 and 0.01 s-1, while the DRV is the
dominant softening mechanism at higher strain rate i.e. 1 s-1.
3. The Z-map showed that in the deformation within the range of 0.2-0.5 strain and lower strain rate of 0.1 s-1, the Z value is lower than other deformation regimes so the suitable microstructure is
achievable.
4. The activation energy for the strain range of 0.25-0.6 and lower strain rate of 0.1 s-1 is lower than 450
kJ.mol-1. This result confirms the lower value of the Z at this region.
5. The optimized deformation conditions for the studied alloy according to the obtained m-map can be proposed as the temperature range of 1000-1100 °C and the strain rate range of 0.01-0.1 s-1.
5. References
[1] G.R. Ebrahimi, A. Momeni, M. Jahazi, P. Bocher, Dynamic recrystallization and precipitation in 13Cr
super-martensitic stainless steels, Metallurgical and Materials Transactions A 45 (2014) 2219-2231.
[2] M. Zeinali, E. Shafiei, R. Hosseini, K. Farmanesh, A. Soltanipoor, E. Maghsodi, Hot Deformation Behavior of
17-7 PH Stainless Steel, Iranian Journal of Materials forming 4(1) (2017) 1-11.
[3] C.H. Fan, Y.B. Peng, H.T. Yang, Z. Wei, H.G. Yan, Hot deformation behavior of Al–9.0 Mg–0.5 Mn–0.1 Ti
alloy based on processing maps, Transactions of Nonferrous Metals Society of China 27 (2017) 289-297.
[4] K.K. Saxena, V. Pancholi, G.P. Chaudhari, D. Srivastava, G.K. Dey, S.K. Jha, N. Saibaba, Hot Deformation
Behaviour and Microstructural Evaluation of Zr-1Nb Alloy, Materials Science Forum, Trans Tech Publ (2017)
319-322.
[5] M. Mishra, I. Balasundar, A. Rao, B. Kashyap, N. Prabhu, On the High Temperature Deformation Behaviour of
2507 Super Duplex Stainless Steel, Journal of Materials Engineering and Performance 26 (2017) 802-812.
[6] I. Balasundar, K. Ravi, T. Raghu, On the high temperature deformation behaviour of titanium alloy BT3-1,
Materials Science and Engineering: A 684 (2017) 135-145.
[7] D. Cai, L. Xiong, W. Liu, G. Sun, M. Yao, Characterization of hot deformation behavior of a Ni-base superalloy
using processing map, Materials & Design 30 (2009) 921-925.
[8] O. Sivakesavam, Y. Prasad, Hot deformation behaviour of as-cast Mg–2Zn–1Mn alloy in compression: a study
with processing map, Materials Science and Engineering: A 362 (2003) 118-124.
[9] Z. Du, S. Jiang, K. Zhang, The hot deformation behavior and processing map of Ti–47.5 Al–Cr–V alloy,
Materials & Design 86 (2015) 464-473.
[10]Y. Zhang, Z. Chai, A.A. Volinsky, B. Tian, H. Sun, P. Liu, Y. Liu, Processing maps for the Cu-Cr-Zr-Y alloy
hot deformation behavior, Materials Science and Engineering: A 662 (2016) 320-329.
[11]T. Xi, C. Yang, M.B. Shahzad, K. Yang, Study of the processing map and hot deformation behavior of a
Cu-bearing 317LN austenitic stainless steel, Materials & Design 87 (2015) 303-312.
[12]Q. Yang, X. Wang, X. Li, Z. Deng, Z. Jia, Z. Zhang, G. Huang, Q. Liu, Hot deformation behavior and
[13]H. Wu, S. Wen, H. Huang, X. Wu, K. Gao, W. Wang, Z. Nie, Hot deformation behavior and constitutive
equation of a new type Al–Zn–Mg–Er–Zr alloy during isothermal compression, Materials Science and
Engineering: A 651 (2016) 415-424.
[14]P. Zhou, Q. Ma, J. Luo, Hot deformation behavior of as-cast 30Cr2Ni4MoV steel using processing maps, Metals
7 (2017) 50.
[15]F.J. Humphreys, M. Hatherly, Recrystallization and related annealing phenomena, Elsevier (2012).
[16]C. Shi, J. Lai, X. Chen, Microstructural evolution and dynamic softening mechanisms of Al-Zn-Mg-Cu alloy
during hot compressive deformation, Materials 7 (2014) 244-264.
[17]J. Castellanos, I. Rieiro, M. Carsí, J. Muñoz, M. El Mehtedi, O.A. Ruano, Analysis of adiabatic heating and its
influence on the Garofalo equation parameters of a high nitrogen steel, Materials Science and Engineering: A
517 (2009) 191-196.
[18]P. Wanjara, M. Jahazi, H. Monajati, S. Yue, J. P. Immarigeon, Hot working behavior of near-α alloy IMI834,
Materials Science and Engineering: A 396 (2005) 50-60.
[19]C. Zener, J.H. Hollomon, Effect of strain rate upon plastic flow of steel, Journal of Applied physics 15 (1944)
22-32.
[20]C. Sellars, W.M. Tegart, Hot workability, International Metallurgical Reviews, 17 (1972) 1-24.
[21]K.A. Babu, S. Mandal, A. Kumar, C. Athreya, B. De Boer, V.S. Sarma, Characterization of hot deformation
behavior of alloy 617 through kinetic analysis, dynamic material modeling and microstructural studies,
Materials Science and Engineering: A 664 (2016) 177-187.
[22]S. Samal, M. Rahul, R.S. Kottada, G. Phanikumar, Hot deformation behaviour and processing map of
Co-Cu-Fe-Ni-Ti eutectic high entropy alloy, Materials Science and Engineering: A 664 (2016) 227-235.
[23]X. Xin, L.M. Dong, Z.Q. Zhang, Y. Rui, Hot deformation behavior and microstructural evolution of beta C titanium alloy in β phase field, Transactions of Nonferrous Metals Society of China 26 (2016) 2874-2882. [24]D. Trimble, G. O'donnell, Flow stress prediction for hot deformation processing of 2024Al-T3 alloy,
Transactions of Nonferrous Metals Society of China 26 (2016) 1232-1250.
[25]A. Mohamadizadeh, A. Zarei-Hanzaki, H.R. Abedi, Modified constitutive analysis and activation energy
evolution of a low-density steel considering the effects of deformation parameters, Mechanics of Materials 95
(2016) 60-70.
[26]Y. Lin, L.-T. Li, Y.-C. Xia, Y.-Q. Jiang, Hot deformation and processing map of a typical Al–Zn–Mg–Cu alloy,
Journal of Alloys and Compounds 550 (2013) 438-445.
[27]P. Zhang, C. Hu, C.-g. Ding, Q. Zhu, H.-y. Qin, Plastic deformation behavior and processing maps of a Ni-based
superalloy, Materials & Design (1980-2015) 65 (2015) 575-584.
[28]Y. Prasad, S. Sasidhara, Hot Working Guide (ASM International, Materials Park, Ohio), (1997).
[29]D. X. Wen, Y. Lin, H.B. Li, X. M. Chen, J. Deng, L. T. Li, Hot deformation behavior and processing map of a
typical Ni-based superalloy, Materials Science and Engineering: A, 591 (2014) 183-192.
[30]G. Ji, F. Li, Q. Li, H. Li, Z. Li, Development and validation of a processing map for Aermet100 steel, Materials
Science and Engineering: A 527 (2010) 1165-1171.
[31]A. Momeni, K. Dehghani, Characterization of hot deformation behavior of 410 martensitic stainless steel using