Received July 26, 2011; revised September 22, 2011; accepted October 18, 2011
ABSTRACT
We present ultra low energy results taken with the novel Spherical Proportional Counter. The energy threshold has been pushed down to about 25 eV and single electrons are clearly collected and detected. To reach such a performance two low energy calibration systems have been successfully developed: a pulsed UV lamp extracting photoelectrons from the inner surface of the detector and various radioactive sources allowing low energy peaks through fluorescence processes. The bench mark result is the observation of a well resolved peak at 270 eV due to carbon fluorescence, which is a unique performance for such large massive detector. It opens up a new window in dark matter and low energy neutrino searches and it may allow the detection of neutrinos from a nuclear reactor or from supernova via neutrino-nucleus elas- tic scattering.
Keywords: Low Energy Neutrino; Dark Matter; Spherical Detector
1. Introduction
The development of massive low-background, low-energy threshold detectors is a challenge in contemporary physics.
The search of dark matter in the form of hypothetical Weakly Interacting Massive Particles (WIMP’s) is under intense development and relies on the detection of low energy (keV scale) recoils produced by the elastic inter- action of WIMP’s with the nuclei of the detector [1-4]. The need to go to very low energies may become even more crucial, if the WIMP’s turn out to be very light [5], since then, the energy transfer to the nucleus is expected to be smaller.
New generation of directional detection of dark matter is under development to perhaps allow for an unambigu- ous observation even in the presence of backgrounds by observing directional anisotropy of the recoils [6-9].
The scattering off nuclei of low-energy neutrinos (few MeV) via the neutral current interaction remains unde- tected thirty five years after its first description [10,11], a great challenge in neutrino physics. The resulting cross section is expected to be very large compared to other low- energy neutrino interaction channels. The reason is that all neutrons in the nucleus contribute coherently. Again the detection consists in observing the recoiling nucleus. Because the neutrino is light, the nuclear recoil energy is
extremely small and the challenge is to achieve a very low energy threshold (typically below 100 eV).
2. Brief Description of Some Low Energy
Process Requiring a Low Energy Threshold
We will now consider some cases with desired low thre- shold, which are of special interest:
1) Supernova Neutrinos. Development of large mass de- tectors for low-energy neutrinos and dark matter may allow supernova detection via neutrino-nucleus elastic scat- tering [12]. In this case the emitted neutrinos have a spec- trum, which for each flavor is characterized by a Fermi- Dirac distribution with essentially two parameters a tem- perature and a chemical potential [13]. The peak energies are approximately 15, 25 and 35 MeV for electron neu- trinos, electron antineutrinos and all other flavors respec- tively. The distribution becomes negligible for energies above 70 MeV. For a detector of radius 4 m with a gas un- der 10 atm and a typical supernova in our galaxy, i.e. 10 kpc away, one finds 1, 30, 150, 600 and 1900 events for He, Ne, Ar, Kr and Xe respectively [13]. The threshold effect is shown in Figure 1.
Figure 1. For neutrinos from a Supernova, the ratio of the total rate with a given energy threshold divided by that with zero threshold as a function of the threshold energy. The quen- ching factor has not been included. From top to bottom for He, Ne, Ar, Kr and Xe respectively.
spectrum with a peak energy at 35 MeV and a maximum at 50 MeV; b) a muon antineutrino spectrum that extends from zero to 50 MeV, which then falls abruptly to zero; and c) a discreet muon neutrino with an energy of 30 MeV. Thus this source may be the best place to test the coherent neutrino nucleus cross section mediated by the neutral cur- rent [15]. The total rate for a spherical detector filled with Xe and placed 50 m away from the source, assuming zero threshold is 18 events per ton per year. The effect of thresh- old is shown in Figure 2 in the case of the electron neutrino.
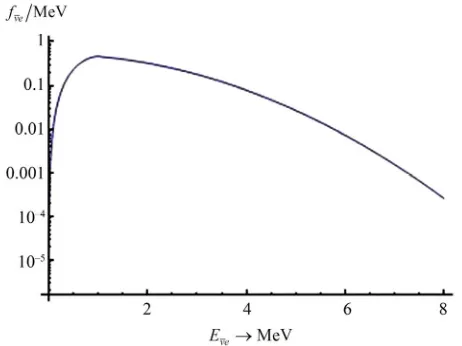
3) Reactor Neutrinos. The spectrum of these neutrinos depends on the reactor and its mode of operation. This is known quite well for some reactors, e.g. that at Bugey. A reasonable approximation to a typical reactor spectrum can be found in the literature [16]. The normalized spectrum is given in Figure 3. We see that the peak energy (~1
MeV) and the average energy (~2.1 MeV) are quite low. So such neutrinos can be used to check the coherent neu-trino nucleus scattering, if a low threshold (less than 0.1 keV) and high resolution are achieved.
4) Geoneutrinos. Neutrinos offer a good prospect for an accurate and detailed study of the Earth’s interior [17]. Neutrinos of this origin have an energy distribution with a maximum of around 3 MeV and an average of 3.3 MeV. The shape [18,19], can be approximated by an analytic func- tion shown on Figure 4. Up to now the detectors utilize
[image:2.595.309.535.87.241.2]the interaction of electronic antineutrinos with a proton to produce via charged current exchange a positron and a neutron. The kinematical neutrino threshold energy is 1.4 MeV. But experimental thresholds are higher (typical 1.8 MeV) such as LENA’s [20]. A neutral current experiment can improve such threshold at lower value as long as the nuclear target is relatively light and the threshold of the recoil nucleus very low (less than 0.1 keV). Admittedly the charged reaction has the advantage that by observing both
Figure 2. For electron-neutrinos from neutron spallation source, the ratio of the total rate with a given energy threshold divided by that with zero threshold as a function of the threshold en- ergy for a Xe target. The solid (dashed) curves correspond to no nuclear form factor (nuclear form factor) respectively. The two lower curves take into account the effect of quenching.
Figure 3. A typical reactor electron antineutrino spectrum.
[image:2.595.309.540.321.494.2] [image:2.595.312.536.519.698.2]3. Detector Description
The detector consists of a large spherical copper vessel 1.3 m in diameter and a small metallic ball 16 mm in dia- meter located at the center of the drift vessel, which is the proportional counter. The ball is maintained in the center of the sphere by a stainless steel rod and is set at high vol- tage. A second electrode (umbrella-shaped) that is placed 24 mm away from the ball, is powered with an indepen- dent but lower high voltage, serving as electric field cor- rector. The detector operates in a seal mode: the spherical vessel is first pumped out and then filled with an appro- priate gas at a pressure from few tens of mbar up to 5 bar. Electrons originating from ionization of the gas in the volume drift to the region of the central ball where the in- tense electric field allows gas amplification to occur. The produced signal is amplified through a charge amplifier and a shaper and is read-out by a 14 bit ADC. Detailed de-scription of the detector, its electronics, its operation and its performance could be found in references [23-25].
In a previous paper [25] we reported results obtained at higher energy and we pointed out the excellent energy resolution obtained with radon nuclide and its daughters. In this work we will focus our studies to detect very-low energy gamma or X-rays emitted by radioactive sources or fluorescence process.
4. Low Energy Calibration and Results
4.1. Results with Radioactive Sources and Fluorescence X-Rays
For this study we are using a gas filling of Argon with 2% admixture of CH4 at various pressures. The pressure (P
in mb), the high voltage of the ball (HV1 in V), the high voltage of the umbrella field corrector (HV2 in V) and the gain (G) of the amplifier-shaper in all measurements in the section, are written in the top-right box on each of the following figures.
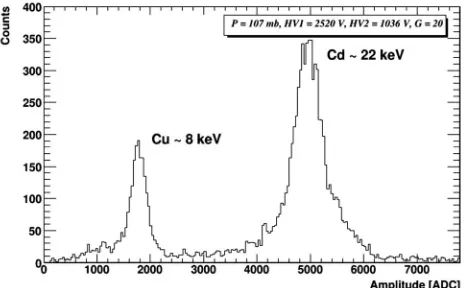
Calibration of the counter was initially performed us- ing a 109Cd source by irradiating the gaseous volume through
a thin 200 m aluminum window.
are used to fluoresce the elements. The source was evapo- rated to a stainless steel holder and attached to the sensor rod at middle distance; the source then is covered by thin foils with adequate thickness to totally absorb the 5.6 MeV alpha emitted, leaving only gamma rays and fluorescence induced X-rays to pass into the gas volume.
Covering the source with a 20 m thick aluminum foil we were able to fluoresce the K X-rays ranging from Al- uminum whose K electron has a binding energy of 1.56 keV, to Cu whose K electron has a binding energy of 8.98 keV.
Figure 6 shows the obtained low energy spectrum. From
left to right we observe the aluminum line (1.45 keV), the iron line (6.4 keV), the copper line (8.0 keV) and two lines emitted by 237N
p nucleus at 13.93 keV (X-ray L) and 17.61
keV (X-ray L).
By increasing the gain of the amplifier 5 times and ad- justing its settings, we were able to push the higher part of the spectrum outside the ADC range and keep in the ADC acceptance only the aluminum 1.45 keV peak as shown in Figure 7. The energy threshold is clearly below 100 eV
and the low energy background level is flat.
[image:3.595.308.541.564.708.2]In order to obtain even lower energy calibration lines we replaced the aluminum foil by a thinner 10 m one and we attached a 20 m polypropylene foil. Therefore, the alpha particle that is crossing the aluminum foil, is fully
Figure 6. Peaks observed from the 241Am radioactive source. From left to right we observe the Aluminium, Iron and Cop- per peaks followed by the Neptunium peaks.
Figure 7. An X-ray spectrum showing its characteristic Alu- minum K X-ray energy peak.
absorbed by the polypropylene foil and induces both alu- minum and carbon fluorescence as shown in Figure 8.
By increasing the gain of the amplifier by a factor of 5, we are able to push the higher part of the spectrum outside the ADC range and keep in the ADC acceptance only the Carbon 270 eV peak as well as the Aluminum (1.45 keV) as shown in Figure 9.
High gain combined with low electronic noise can provide energy thresholds clearly below 100 eV. Figure 10
shows the energy spectra at different gains of the ampli- fier when no source is used. By applying a cut at the rise time of the signal (which actually provides the depth of the ionized electrons produced in the gas) we can exclude the signal induced by cosmic rays and measure only the Copper energy line of 8 keV (plotted with dashed line in
Figure 10). Then, by increasing the gain of the amplifier
20 times (from Gain = 10 to Gain = 200), we keep in the ADC acceptance only the ultra low energy region (plot- ted with full line in Figuew 10). The value of 1000 ADC
[image:4.595.57.291.288.427.2]corresponds to ~150 eV and the peak at ~50 eV is com- patible with single electrons (see Section 2). Thus, the de-tection threshold of the Spherical Proportional Counter is
[image:4.595.310.540.329.491.2]Figure 8. Peaks observed from the 241Am radioactive source through aluminium and polypropylene foil. On the left the Carbon (270 eV) peak is shown, followed by the Aluminium peak (1.45 keV), the escape peak (E.P.) of Iron in Argon (3.3 keV), the escape peak of Copper in Argon (5 keV), the Iron peak (6.4 keV), the Copper peak (8 keV) and the Neptunium peak (13.93 keV).
Figure 9. From left the Carbon (270 eV) peak followed by the Aluminum peak (1.45 keV).
[image:4.595.307.539.526.700.2]charge is also producing a fast signal which is observed through a capacitor and after adequate attenuation can serve as a fast trigger. For the present study, all results have been obtained without trigger. Photons are crossing the UV en- trance window and hitting copper of the internal vessel producing photoelectrons by photoelectric effect. Elec- trons are being extracted and drifting through the radial field to the central ball where they are amplified and col- lected. The energy calibration has been done using the 22 keV photon X decay of 109Cd source and the 8 keV Cu fluorescence.
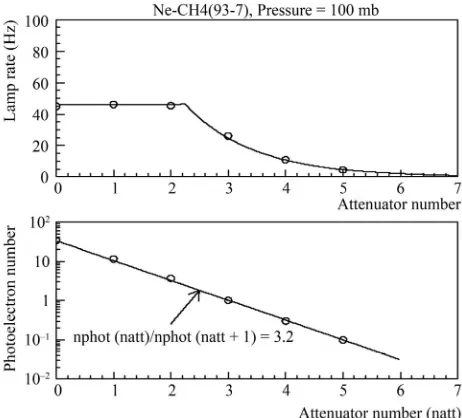
The UV light flux of the lamp was adjusted by intro- ducing adequate light attenuators down to the single pho- to-electron extraction on the Copper. Each data sample was acquired without trigger during the same running time. The subtraction of the amplitude spectrum of the sample lamp off from that of lamp on suppresses the huge background due to cosmic rays. The gas used was a mixture of Ne with 7% CH4 at a pressure of 100 mbar.
Results are shown on Figure 11 without light attenuator.
The amplitude spectrum of the lamp signal is fitted with a Gaussian function. The mean energy value divided by 36 eV, the photon energy for ionization of gas, gives a mean value of 32.8 photoelectrons extracted by each flash of the lamp.
The lamp light was then gradually attenuated by 1, 2, up to 5 identical attenuators. Each distribution is well fit- ted by a Polya function with an offset. With less than 3 at- tenuators, the number of events is stable, which means for those sample all the flashes are detected with a mean fre- quency close to 45 Hz (27,000 events divided by 600 s the run time). In fact the probability not to detect the flash is very low, 2.5% with 2 attenuators, as expected by the Poisson distribution with the mean value given by the fit. With more attenuators the mean frequency is decreasing because the probability of producing zero photoelectrons per flash is increasing exponentially (Figure 12—top).
The number of photoelectrons per flash given by the fit decreases asymptotically to one as expected. The mean number of extracted electron per flash decrease exponen-tially with a reduction factor close to 3 as expected (
Fig-Figure 11. Energy spectrum due to photelectron extraction from the copper by the UV lamp without attenuation.
[image:5.595.308.536.229.449.2] [image:5.595.307.538.487.696.2]Figure 13. Energy distribution in the case of 3 attenuators.
Figure 14. Fitted energy spectrum for several attenuators.
5. Future Developments and Applications
The counter can be applied for low-background experi- ments, which require a low energy threshold. An example is the detection of the coherent neutrino-nucleus scatter- ing producing sub keV ion recoils. A spherical detector of radius 4 m and employing Xe gas at a pressure of 10 Atm will detect about 1000 events for a typical supernova explosion at 10 kpc. A world wide network of several such simple, stable and low cost supernova detectors is proposed. All results that are shown here were taken in the lab using the spherical detector of 1.3 m diameter that is made by raw materials. For underground tests another similar de- tector of the same diameter has been installed in the LSM laboratory in Modane (Frejus) under 1700 m of rock (4800
meters water equivalent) providing protection from cos- mic rays. Comparisons between measurements in the sub- keV energy region taken with both detectors are carried out in order to understand the background level and optimize the detector in terms of sensitivity and noise background. The development of a new spherical prototype 70 cm in diameter made of low radioactivity materials is in pro- gress and will be installed in the LSM laboratory. By using a mixture of gas containing 3He, it will be possible to mea-
sure not only the thermal neutron component [26] but also the fast neutron energy spectrum by taking profit of the 1 to few barn cross section of capture above 100 keV neu- tron energy. By adding a lead and Polyethylene shields, it will also be possible to measure the residual background at low energy and assess potential sensitivity to dark matter particle search and coherent neutrino-nucleus scattering.
6. Conclusion
We have developed a new detector with large mass and low sub-keV energy threshold. This is a new type of ra- diation detector based on the radial geometry with spherical proportional amplification read-out that combines simpli- city, robustness and low cost. Several applications are open arising from low energy neutrino physics, dark matter search, Supernova detection to neutron background measurement.
7. Acknowledgements
We would like to thank Dr. T. Papaevangelou for exciting discussions.
REFERENCES
[1] K. Nakamura, et al., “Review of Particle Physics,” Jour-nal of Physics G: Nuclear and Particle Physics, Vol. 37,
No. 7A, 2010, pp. 1-1422.
doi:10.1088/0954-3899/37/7A/075021
[2] I. Giomataris and J. D. Vergados, “Neutrino Properties studied with a Triton Source and a Large Spherical TPC,”
Nuclear Instruments and Methods in Physics Research Section A, Vol. 530, No. 3, 2004, pp. 330-358.
doi:10.1016/j.nima.2004.04.223
[3] J. I. Collar and Y. Giomataris, “Possible Low-Back- ground Applications of Micromegas Detector Technology,
Nuclear Instruments and Methods in Physics Research Section A, Vol. 471, No. 1-2, 2001, pp. 254-259.
doi:10.1016/S0168-9002(01)00986-X
[4] R. Bernabei, et al., “New Results from DAMA/LIBRA,”
The European Physical Journal C, Vol. 67, No. 1-2, 2010,
pp. 39-49. doi:10.1140/epjc/s10052-010-1303-9
[5] A. Dedes, I. Giomataris, K. Suxho and J. D. Vergados, “Searching for Secluded Dark Matter via Direct Detection of Recoiling Nuclei as Well as Low Energy Electrons,”
Nuclear Physics B, Vol. 826, No. 1-2, 2010, pp.148-173.
[image:6.595.57.289.319.531.2]Its Effects in Stellar Collapse,” Annual Review of Nuclear and Particle Science, Vol. 27, 1977, pp. 167-207.
doi:10.1146/annurev.ns.27.120177.001123
[11] A. Drukier and L. Stodolsky, “Principles and Applica-tions of a Neutral-Current Detector for Neutrino Physics and Astronomy,” Physical Review D, Vol. 30, No. 11,
1984, pp. 2295-2309. doi:10.1103/PhysRevD.30.2295 [12] C. J. Horowitz, K. J. Coakley and D. N. McKinsey,
“Su-pernova Observation via Neutrino-Nucleus Elastic Scat-tering in the CLEAN Detector,” Physical Review D, Vol.
68, No. 2, 2003, p. 023005. doi:10.1103/PhysRevD.68.023005
[13] Y. Giomataris and J. D. Vergados, “A Network of Neutral Current Spherical TPCs for Dedicated Supernova Detec-tion,” Physics Letters B, Vol. 634, No. 1, 2006, pp. 23-29.
doi:10.1016/j.physletb.2006.01.040
[14] J. D. Vergados, F. T. Avignone III and I. Giomataris, “Coherent Neutral Current Neutrino-Nucleus Scattering at a Spallation Source: A Valuable Experimental Probe,”
Physical Review D, Vol. 79, No. 11, 2009, Article No: 113001. doi:10.1103/PhysRevD.79.113001
[15] K. Scholberg, “Prospects for Measuring Coherent trino-Nucleus Elastic Scattering at a Stopped-Pion Neu-trino Source,” Physical Review D, Vol. 73, No. 3, 2006,
Article No: 033005. doi:10.1103/PhysRevD.73.033005
[physics.ins-det].
[20] K. A. Hochmuth, et al., “Probing the Earth’s Interior with
the LENA Detector,” Earth Moon Planets, No. 99, No.
1-4, 2006, pp. 253-264. doi:10.1007/s11038-006-9111-9 [21] H. T. Wong, “Ultra-Low-Energy Germanium Detector for
Neutrino-Nucleus Coherent Scattering and Dark Matter Searches,” Modern Physics Letters A, Vol. 23, No. 17-20,
2008, pp. 1431-1442. doi:10.1142/S0217732308027801 [22] C. E. Aalseth, et al., “Results from a Search for Light-
Mass Dark Matter with a P-Type Point Contact Germa-nium Detector,” 2010. arXiv:1002.4703 [astro-ph.CO]. [23] S. Aune, et al., “NOSTOS: A Spherical TPC to Detect
Low Energy Neutrinos,” AIP Conference Proceedings,
Vol. 785, 2005, pp. 110-118. doi:10.1063/1.2060461 [24] I. Giomataris, et al., “NOSTOS Experiment and New
Trends in Rare Event Detection,” Nuclear Physics B— Proceedings Supplements, Vol. 150, 2006, pp. 208-213.
doi:10.1016/j.nuclphysbps.2005.01.245
[25] I. Giomataris, et al., “A Novel Large-Volume Spherical
Detector with Proportional Amplification Read-Out,”
JINST, Vol. 3, 2008, Article No: P090007.
[26] I. Giomataris, et al., “Spherical TPC Development and Trends,” Journal of Physics: Conference Series, Vol. 179,