COMPARATIVE PHYSICO-CHEMICAL ANALYSIS OF RESTORED AND UNRESTORED SOILS OF
VILLAGE THOONI RAM LAXMANPURA OF CHAKSU BLOCK, JAIPUR, RAJASTHAN
1,
*Sonal Jain,
1Ruchi Middha,
2
University of Rajasthan, Jaipur
ARTICLE INFO ABSTRACT
Heavy rainfall generally results in flooding of rivers which outflow; and submerges the land which is usually dry, although this is not a usual phenomenon in the arid regions of Rajasthan, India. In 1981, the Chaksu block of Jaipur district, Rajasthan suff
erosion of the soil. This region was then restored by Joint Forest Management (JFM) in 1984. This effort of Government and community has resulted in increased green cover on land and has led to improved soil qua
characteristics of soil samples, which were collected Chaksu Block, Jaipur. The
matter, calcium, magnesium, sodium and potassium, phosphorous and total nitrogen were analysed. Water holding capacity and moisture content of the soil were also estimated. Upon the statistical comparison using student’s t
unrestored samples significant difference was found, therefore, it can be concluded from the results that the restoration measures adopted by community and forest department were quite effective in improving the quali
Copyright © 2015 Sonal Jainet al. This is an open access article distributed under the Creative Commons Att
distribution, and reproduction in any medium, provided the original work is properly cited.
INTRODUCTION
Many of the world’s ecosystems have undergone significant degradation with negative impacts on biological diversity and human livelihoods. There is now a growing realisation to sustain the earth’s biological diversity through the protection of the degraded areas. In this way ecological restoration becomes a fundamental element of ecosystem management.
Ecological restoration improves biodiversity, human
livelihood, empowers local people and improves ecosystem productivity. This means ecological restoration can be a
primary component of conservation and sustainable
development programmes throughout the world. Restoration can be defined as re-establishing the presumed structure, productivity and species diversity that was originally present at a site that has been degraded, damaged or destroyed (SER, 2004). Restoration of degraded land can be achieved by joint efforts of community as well as the government. In the present study, an analysis of restored and unrestored area was undertaken for evaluation of soil quality enhancement in village of Chaksu block Rajasthan which suffered severe floods during 1981 in Dhund River resulting in massive erosion of soil, leaving it unproductive. The local community and government undertook certain regions in this area and started restoration practices like Joint Forest Management
*Corresponding author: Sonal Jain, The IIS University, Jaipur, India.
ISSN: 0975-833X
Vol.
Article History:
Received 10th February, 2015 Received in revised form 21st March, 2015 Accepted 16th April, 2015 Published online 25th May,2015
Key words:
Flood, Restoration,
Joint Forest Management, Physico-chemical characteristic, Soil quality.
RESEARCH ARTICLE
CHEMICAL ANALYSIS OF RESTORED AND UNRESTORED SOILS OF
VILLAGE THOONI RAM LAXMANPURA OF CHAKSU BLOCK, JAIPUR, RAJASTHAN
Ruchi Middha,
1Shelja K. Juneja and
2Pallavi Kaushik
1
The IIS University, Jaipur, India
University of Rajasthan, Jaipur, India
ABSTRACT
Heavy rainfall generally results in flooding of rivers which outflow; and submerges the land which is usually dry, although this is not a usual phenomenon in the arid regions of Rajasthan, India. In 1981, the Chaksu block of Jaipur district, Rajasthan suffered from severe flood, which caused massive erosion of the soil. This region was then restored by Joint Forest Management (JFM) in 1984. This effort of Government and community has resulted in increased green cover on land and has led to improved soil quality. The present study was conducted to analyse the physico
characteristics of soil samples, which were collected from the Thooni Ram Laxmanpura of the Chaksu Block, Jaipur. Thesoil parameters like pH, electrical conductivity,
matter, calcium, magnesium, sodium and potassium, phosphorous and total nitrogen were analysed. Water holding capacity and moisture content of the soil were also estimated. Upon the statistical comparison using student’s t-test between the physico-chemical characteristics of restored and unrestored samples significant difference was found, therefore, it can be concluded from the results that the restoration measures adopted by community and forest department were quite effective in improving the quality of soil.
is an open access article distributed under the Creative Commons Attribution License, which distribution, and reproduction in any medium, provided the original work is properly cited.
ecosystems have undergone significant degradation with negative impacts on biological diversity and human livelihoods. There is now a growing realisation to sustain the earth’s biological diversity through the protection ecological restoration becomes a fundamental element of ecosystem management.
Ecological restoration improves biodiversity, human
livelihood, empowers local people and improves ecosystem productivity. This means ecological restoration can be a
onent of conservation and sustainable
development programmes throughout the world. Restoration establishing the presumed structure, productivity and species diversity that was originally present at d or destroyed (SER, Restoration of degraded land can be achieved by joint efforts of community as well as the government. In the present study, an analysis of restored and unrestored area was undertaken for evaluation of soil quality enhancement in the village of Chaksu block Rajasthan which suffered severe floods during 1981 in Dhund River resulting in massive erosion of soil, leaving it unproductive. The local community and government undertook certain regions in this area and
Joint Forest Management
(JFM) and Social Forestry which provide a visible role of the local communities in planning, management and protection of forests. The area has been planted with
myxa, Alianthus excelesa, Emblica officianalis and Zizyphus jujuba. Analysis of soil for various soil parameters was carried
out that provided useful information regarding soil fertility.
MATERIALS AND METHODS
Collection of soil samples
The soil samples were collected from restored (Experimental) and unrestored (Control) region by random sampling. Thooni Ram Laxmanpura village of Chaksu Block was selected for the comparative study of restored and
samples were collected at a depth of polypropylene zip lock bags.
labeled, packaged and taken to the laboratory and stored at in refrigerator. The soil samples were ground and p through 0.2 mm sieve for further analysis.
Physico-chemical Analysis of soil
Collected soil samples were analyzed for physico
characteristics like pH, Electrical Conductivity, Organic Carbon, Organic Matter, Available Calcium and Magnesium, Sodium and Potassium, available Phosphorous, Total Nitrogen International Journal of Current Research
Vol. 7, Issue, 05, pp.15706-15710, May, 2015
CHEMICAL ANALYSIS OF RESTORED AND UNRESTORED SOILS OF
VILLAGE THOONI RAM LAXMANPURA OF CHAKSU BLOCK, JAIPUR, RAJASTHAN
Pallavi Kaushik
Heavy rainfall generally results in flooding of rivers which outflow; and submerges the land which is usually dry, although this is not a usual phenomenon in the arid regions of Rajasthan, India. In 1981, ered from severe flood, which caused massive erosion of the soil. This region was then restored by Joint Forest Management (JFM) in 1984. This effort of Government and community has resulted in increased green cover on land and has led to lity. The present study was conducted to analyse the physico-chemical from the Thooni Ram Laxmanpura of the soil parameters like pH, electrical conductivity, organic carbon, organic matter, calcium, magnesium, sodium and potassium, phosphorous and total nitrogen were analysed. Water holding capacity and moisture content of the soil were also estimated. Upon the statistical emical characteristics of restored and unrestored samples significant difference was found, therefore, it can be concluded from the results that the restoration measures adopted by community and forest department were quite effective in
ribution License, which permits unrestricted use,
(JFM) and Social Forestry which provide a visible role of the local communities in planning, management and protection of The area has been planted with Acacia tortalis, Cordia
myxa, Alianthus excelesa, Emblica officianalis and Zizyphus
Analysis of soil for various soil parameters was carried out that provided useful information regarding soil fertility.
ND METHODS
The soil samples were collected from restored (Experimental) and unrestored (Control) region by random sampling. Thooni Ram Laxmanpura village of Chaksu Block was selected for the comparative study of restored and unrestored area. Soil samples were collected at a depth of 5-10cm in pre-sterilized . The samples were carefully packaged and taken to the laboratory and stored at 4̊ C in refrigerator. The soil samples were ground and passed through 0.2 mm sieve for further analysis.
chemical Analysis of soil
Collected soil samples were analyzed for physico-chemical Electrical Conductivity, Organic Carbon, Organic Matter, Available Calcium and Magnesium, Sodium and Potassium, available Phosphorous, Total Nitrogen
and Physical parameters like Water Holding Capacity and Moisture Content were also analyzed.
pH
pH of the soil is the measure of H+ ion activity of the soil
water system. pH can be defined as negative logarithm of hydrogen ion concentration and express the degree of acidity
and alkalinity. It is expressed as pH = log 10 (H+). For pH
below 7, the H concentration exceeds OH and the range is acidic. When the OH concentration is more than H, pH lies between 7 and 14 and the range is alkaline. Soil pH was determined by pH meter (Elico-EI-111) by preparing 1:2.5 soil: water suspension and stirring by means of a glass rod (Jackson, 1973).
Electrical Conductivity (EC)
Soil EC is an easily measured yet reliable indicator of soil quality, crop performance, nutrient cycling and biological activity and can serve as a quick indicator of plant-available nitrate-N (Doran 2005; Johnson et al. 2005; Eigenberg et al., 2002; Patriquin et al., 1993). Electrical conductivity was determined in supernatant liquid suspension of 1:2.5 soil water ratio using conductivity meter (Elico-CM-180). ECs of all the samples were reported in milli Siemens (mS) (Jackson, 1973).
Organic Carbon
Organic carbon content was estimated by the following wet digestion method of Walkley and Black (1934). Half a gm of soil sample was transferred in a 500ml conical flask to which
10 ml of 1N K2Cr2O7 and 20 ml of concentrated H2SO4 was
added and allow to stand for 30 minutes. After 30 minutes 200 ml of distilled water was added to dilute the suspension. After that 10 ml of ortho-phosphoric acid and 1 ml of diphenylamine indicator was added. A deep violet color was appeared. Solution was then titrated with ferrous ammonium (0.5N) sulfate till the colour changed from violet to blue and finally green. A blank without soil was run simultaneously. Organic carbon in the soil was calculated as per the following formula.
Organic Carbon (%) = 10 (B-T)/B x 0.003 x 100/S
Where,
B = Volume of ferrous ammonium sulphate required for titration of blank in ml.
T = Volume of ferrous ammonium sulphate needed for soil sample in ml.
S = Weight of soil in g
Organic matter (%) = % Organic carbon × 1.724
Total Calcium and Magnesium
Calcium and Magnesium are essential nutrient to and is widely
distributed and generally abundant elements in soil. Total Ca2+
and Mg2+ was determined by preparing soil suspension in 1:2.5
soil water ratio. 10 mL of the filtered aliquot was mixed with 5 mL of ammonium chloride-ammonium hydroxide buffer solution. Further Eriochrome Black T was added as an indicator and the solution was titrated with 0.01N EDTA and the end point was observed as colour changed from purple to pure blue (Maiti, 2003).
Calcium: For estimation of Ca2+, another 10 mL aliquot was
mixed with 5 mL of 4N NaOH to precipitate Mg2+ as Mg
(OH)2. This solution was titrated with 0.01N EDTA and a
pinch of Murexide indicator was added. Endpoint was observed as colour changed from pink to purple-violet.
Magnesium: The titrant volume of Ca2+ was subtracted from
total Ca2+ and Mg2+ titrant volume to obtain the Mg2+ content
in the soil.
Mg2+ = (Total Ca2+ & Mg2+) – (Ca2+)
Calculation
1ml of 0.01N EDTA = 0.4008g Ca2+
1ml of 0.01N EDTA = 0.2342g Mg2+
Sodium (Na) and Potassium (K)
The estimation of Sodium and Potassium is based on the flame photometric method. Soil suspension was prepared in 1:5 for determination of sodium and potassium concentration. Na and K concentrations in the extract were determined by Flame photometer by using Na filter and K filter respectively.
Preparation of standard curve
10 to 60 ppm Na solution and K solution was prepared from the stock solution by adding ammonium acetate solution. After attaching the appropriate filter, gas and air pressure were adjusted in the flame photometer and reading was adjusted to zero for the blank (ammonium acetate). Flame photometer reading was noted at different concentration for Na solution and K solution (10-60 ppm). The curve was obtained by plotting the flame photometer readings against the different concentration of Na and K (Maiti, 2003). Available sodium and Potassium in soil was calculated as per the following formula.
Available sodium or Potassium (Na or K mg /g of soil) = A×V/ W × 100
Where
A= Na or K content of soil extract from standard curve, mg/L V= Volume of soil extract, ml
W= Weight of air dry samples taken for extraction in g
Total Nitrogen
Total nitrogen was estimated by the Micro-Kjeldahl method as per procedure suggested by AOAC (1995). Nitrogen in samples like plant and soil exists in a very complicated bonding structure
The micro-Kjeldahl method consist of the three steps:
Digestion
Distillation
Titration
Procedure
Digestion
catalyst mixture was added to the sample. Digestion tubes were loaded in to the digester and digestion block was heated. Digestion unit was switched on and initial temperature was set 100̊ C till frothing was over. The block temperature was raised to 400̊ C. The effective digestion starts only at 360̊ C and beyond 410̊ C. The sample turned light green colour or colourless at the end of digestion process.
Distillation
After cooling the digestion tube, tube was loaded in the distillation unit and other side of hose 20 ml of 4% boric acid with mixed indicator was kept in 250 ml conical flask. 40 ml NaOH (40%) was automatically added by distillation unit programme. The digested sample was heated by passing steam at a steady rate and the liberated ammonia absorbed in 20 ml of 4% boric acid containing mixed indicator solution kept in a 250 ml conical flask. With the absorption of ammonia, the pinkinsh colour turned to green. Nearly 150 ml of distillate was collected in about 8 minutes. Simultaneously, blank sample (without soil) was run.
Titration
The green colour distillate was titrated with 0.02N sulphuric acid and the colour changed to original shade (pinkish colour). Blank and sample titer reading (ml) was noted down and total nitrogen content present in soil samples was calculated.
Calculation
Nitrogen content in soil (%) =
R (sample titer-blank titer) × Normality of acid × Atomic weight of nitrogen × 100/ Sample weight (g) × 1000
= R × 0.1 × 14 × 100/ 1 × 1000 Factor = R × 0.14
Available Phosphorus (Olsen’s Method)
(Phosphorous soluble in sodium bicarbonate)
Phosphorous is a second key nutrient found in soil. The amount of phosphorous available to plants is generally not exceeded 0.01% of the total P. The total P in soil found between 0.02 to 0.10% by weight. Phosphorous is extracted
from soil with 0.5M NaHCO3 at a nearly constant pH of 8.5.
2.5g of soil was added to 50ml of extracting solution
(NaHCO3) in 100ml conical flask. Then suspension was
filtered through the whatman paper. 5 ml of soil extract was taken in 25ml volumetric flask to which 5ml of Dickman’s and Bray reagent was added. The neck of the flask was washed down and the content were diluted to about 22 ml. Then 1ml of dilute stannous chloride solution was added and volume was made upto the mark. The intensity of blue colour was measured (using 660nm filter) just after 10 minutes and the concentration of phosphorous was determined from the standard curve. This is very important as the color starts fading down after some time. With each set of samples, a blank (without soil) was also run.
Development of standard curve for phosphorous
For preparation of the standard curve different concentration of phosphorous (1, 2, 3, 4, 5 and 10ml of 2 ppm phosphorous
solution) were taken in 25ml volumetric flask. Standard concentration of phosphorous in the range of 0.08 µg/mL to 0.80 µg/L was prepared. The curve was plotted taking the colorimeter reading on the vertical axis and the amount of phosphorous (µg/mL) in the horizontal axis (Maiti, 2003)
Calculation
Olsen’s P (Kg/ha) = R X V/v X 1/S X 2.24 X 10⁶/106
= µg P X 8.96 Where
V= Total volume of extractant (50 ml)
V= Volume of aliquot taken for analysis (5 ml) S= Wt of soil (2.5 gm)
R= Wt of P in the aliquot in µg (from standard curve)
Moisture content (Oven method)
Moisture content is the amount of water lost from sample upon drying to a constant weight, and expressed as the weight per unit of dry sample or as the volume of water per unit bulk volume of the sample. The samples were weighed immediately after collection and recorded as “wet weight of sample”. The wet sample was dried at a temperature not exceeding 239 F (115º C) for 24 hours using the suitable drying equipment. The samples were kept in desiccators for 4 to 5 hours to allow the sample to cool. The cooled sample was weighed again, and recorded as the “dry weight of sample.”
The moisture content of the sample was calculated using the following equation:
Moisture Content (%) = [(W2 – W3)/W2–W1] X 100
Where:
W1 =Weight of empty box (grams)
W2 =Weight of empty box (grams) + Weight of fresh sample
(grams)
W3 =Weight of empty box (grams) + Weight of dry sample
(grams)
Water Holding Capacity (WHC)
Water holding capacity of soil refers to amount of maximum water, which can be held by the saturated soil. 50 g of oven dried (105ºC) soil was taken in previously weighed bottom perforated circular aluminium box with Whatman No. 1 at the base of it to prevent the leakage of soil through the perforations. The box was placed in a water filled glass container. The box was wiped and allowed to drain excess water. The weight of the box was measured after 24 hours (Maiti, 2003).
Water holding capacity in the soil was calculated as per the following formula.
WHC (%) = (W3 – W2)/ (W2 – W1) x 100
Where,
W1 = Weight of box + filter paper (grams)
W2 = Weight of box + filter paper + soil (grams)
(W2 – W1) = Weight of soil (grams)
Statistical Analysis
Each of the analysis was performed in triplicates and results are expressed as mean ± S.E. The significance of results were drawn by comparison of restored and unrestored soil samples by using Students t-test at significance level (p< 0.05, 0.005, 0.001).
RESULTS AND DISCUSSION
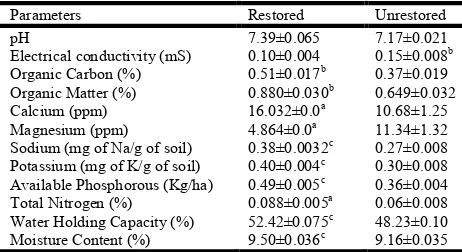
[image:4.595.47.278.241.367.2]The results of physico-chemical properties of the Restored (Experimental) and Unrestored (Control) soil samples are shown in table.
Table 1. Physico-chemical characteristic of restored and unrestored soil samples of Chaksu block, Jaipur district
Parameters Restored Unrestored pH 7.39±0.065 7.17±0.021 Electrical conductivity (mS) 0.10±0.004 0.15±0.008b Organic Carbon (%) 0.51±0.017b 0.37±0.019 Organic Matter (%) 0.880±0.030b 0.649±0.032 Calcium (ppm) 16.032±0.0a 10.68±1.25 Magnesium (ppm) 4.864±0.0a 11.34±1.32 Sodium (mg of Na/g of soil) 0.38±0.0032c 0.27±0.008 Potassium (mg of K/g of soil) 0.40±0.004c 0.30±0.008 Available Phosphorous (Kg/ha) 0.49±0.005c 0.36±0.004 Total Nitrogen (%) 0.088±0.005a 0.06±0.008 Water Holding Capacity (%) 52.42±0.075c 48.23±0.10 Moisture Content (%) 9.50±0.036c 9.16±0.035 Where ap < 0.05, bp < 0.005, cp < 0.001
The pH of soil is one of the most important physico-chemical parameter. It affects mineral nutrient soil quality as well as much microorganism activity. The pH range of 6.8 to 8.0 has been recommended optimum for plants growth.The pH of all the restored soil samples ranged from neutral to mildly alkaline. Although there is minor difference in pH values on comparison between restored and unrestored samples and the difference was found to be non-significant.
Soil electrical conductivity is an indirect measurement that correlates very well with several soil physical and chemical properties. The measurement of electrical conductivity gives a clear idea of soluble salts present in the soil. High Electrical conductivity and pH also make soil unsuitable for plant growth as decrease in these parameters ultimately increase the soil fertility (Rai et al., 2011). Thus the low level of EC in restored soil is suitable for plant growth indicating higher fertility. Soil organic matter is the fundamental source of fertility in organic systems (MOSES, 2012). Organic Carbon and Organic Matter were found to be significantly (p<0.005) higher in the restored soil as compared to unrestored soil. In the present study improved soil organic matter support the growing tree cover in the restored area. This is mainly because of the presence of many organic waste residues which add more organic matter after their decay.
Calcium and Magnesium are the most abundant minerals found in soil. These are, however, required in comparatively smaller amounts and are known as secondary nutrients (Iwai, 1961). Values of Calcium and Magnesium were found to be significantly (p<0.05) higher in the restored soil as compared to unrestored soil. These nutrients improve the soil structure thereby increasing the water penetration and providing a more
favorable soil environment for growth of a plant root and soil microorganisms. Sodium and potassium are essential nutrients and play an important role in the growth of plants, the synthesis of amino acids and proteins (Velmurugan et al; 2012). Results showed significantly (p< 0.001) higher amount of sodium and potassium content in the soil samples of the restored site as compared to that of the unrestored site.
Phosphorous is one of the key macronutrients required for plant growth and metabolism; it is also necessary for maintaining a balance between the other plant nutrients (Wagh
et al., 2013). The amount of phosphorus was found to be
significantly ((p< 0.001) high in restored soil as compared to unrestored soil. Nitrogen is an important soil parameter which enhances soil quality, fertility and productivity. It was found that restored soil contain significantly (p<0.05) high nitrogen content as compared to unrestored soil. Reduced levels of nitrogen were also observed by Kalshetty et al (2012) on flooding of cultivated areas from river Krishna in Southern India
The water holding capacity is an index of a number of physical properties of soil. Good Water holding capacity reflects good physical condition of any soil (Soffe, 1995). The results showed that the restored soil have the ability to absorb more water as compared to unrestored soil. Moisture content in the restored soil was also found to be significantly (p< 0.001) higher as compared to the unrestored soil. Thus, the findings of our study reveal that there is a significant difference (p<0.05, 0.005, 0.001) between all the physico-chemical parameters (except pH) of the soils of restored and unrestored areas. The results obtained are in consensus with our opinion that the restoration strategies adopted in this region would result in improvement of the soil fertility. Other workers have also reported improvement of soil fertility after adoption of restoration strategies (Yadav 2012; Kremer and Hezel 2012; Lil et al. 2012; and Tian et al. 2001). Such strategies can be successfully applied to the eco-systems suffering from natural or anthropogenic modes of degradation.
REFERENCES
AOAC, 1995. Official methods of analysis. 16th edn.
Association of Official Analytical Chemists, Washington, DC
Doran, J. W. 2005. In-Field Measurement of Soil Quality and Sustainable Management. In 2005. Wisconsin Fertilizer, Aglime, and Pest Management Conference, Alliant Energy Center, Madison, Wisconsin, January 18–20, Laboski, C. and Boerdoom, C., eds.; University of Wisconsin Extension: Madison, Wisconsin, 44: 27–31
Eigenberg, R. A., Doran, J.W., Nienaber, J.A., Ferguson, R. B., and Woodbury, B. L. 2002. Electrical Conductivity Monitoring of Soil Condition and Available N with Animal Manure and a Cover Crop. Ecosyst. Environ. With Agriculture Ecosystems and Environment, 88: 183–193 Iwai, I. 1961. Australian Journal Soil Resources, 11: 153 Jackson, M. L., 1973. Soil chemical analysis. Prentice Hall of
India Pvt. Ltd., New Delhi.
Electrical Conductivity Studies by Central States Researchers. Transactions of the American Society of
Agricultural Engineering.
Kalshetty, B. M., Giraddi, T. P., Sheth, R. C., and Kalashetti, M. B., 2012. “River Krishna Flood Effects on Soil Properties of Cultivated Areas in Bagalkot District, Karnataka State,” Global Journal of Science Frontier
Research Chemistry, 12 (6-B), Version 1.0.
Kremer, R. J., and Hezel, L.F. 2012. Soil quality improvement under an ecologically based farming system in northwest Missouri. Renewable Agriculture and Food Systems, 28(3): 245–254
Li1, W., Yan, M., Qingfeng, Z., and Zhikau, J. 2012. Effects of Vegetation Restoration on Soil Physical Properties in the Wind–Water Erosion Region of the Northern Loess Plateau of China. Clean – Soil, Air, Water, 40 (1): 7–15
Maiti S. K. 2003. Analysis of Physical Parameters of Soil (Chapter 10) in book: Handbook of Methods in Environmental Studies: Air, Noise, Soil and Overburden analysis. ABD Publishers, Jaipur, India. 2:142-161. Maiti, S. K. 2003. Analysis of Chemical Parameters of Soil
(Chapter 11) in book: Handbook of Methods in Environmental Studies: Air, Noise, Soil and Overburden analysis. ABD Publishers, Jaipur, India. 2:162-209. Midwest Organic and Sustainable Education Service (MOSES)
2012. Organic fact sheet, managing soil fertility and organic matter. Soil fertility and crop nutrient management practice standard (National Organic Standards).
Patriquin, D.G. Blaikie, H; Patriquin, M. J; and Yang, C; 1993. On-farm Measurements of pH, Electrical Conductivity and Nitrate in Soil Extracts for Monitoring Coupling and Decoupling of Nutrient Cycles. Biological and Agricultural
Horticulture, 9: 231–272.
Rai, S. Chopra, A. K; Pathak, C; Sharma, D.K; Sharma, R; and Gupta P. M; 2011. Comparative study of some physicochemical parameters of soil irrigated with sewage water and canal water of Dehradun city. India Archives of
Applied Science Research, 3 (2): 318-325.
SER, 2004. The SER Primer on Ecological Restoration, Version 2. Society for Ecological Restoration Science and Policy Working Group.
Soffe, R.E. 1995. In: The agricultural Notebook, 19th Edition. Black well Science, Oxford.
Tian, J., Salako, F. K., Ishida, F., and Zhang, J., 2001. Biological restoration of a degraded alfisol in the humid trophic using planted woody fallow: synthesis of 8 years result. In D.E. Stott, R. H. Mohtar and G.C. Steinhardt (eds), 333-337.
Velmurugan, S., Govindaraj, R., Gokulakumar, B., and Ravi1, S. 2012. Physico-chemical parameters and elemental analysis of the soils of sunflower (Helianthus annus. L) Growing field with different manure treatment. Asian
Journal of Plant Science and Research, 2 (4): 473-477.
Wagh, G. S., Chavhan, D. M., and Sayyed, M. R. G; 2013. Physicochemical Analysis of Soils from Eastern Part of Pune City. Universal Journal of Environmental Research
and Technology. 3(1): 93-99.
Walkley, L.P., and Black, J. A., 1934. An examination of the Detjareff method for determining soil organic matter and a proposed modification of the chromic acid titration method. Soil Sci, 37:29-38.
Yadav, R. 2002. Soil organic carbon and soil microbial biomass as affected by restoration measures after 26 years of restoration in mined areas of Doon Valley. International
Journal of Environmental Sciences, 2 (3): 1380-85.