MOLECULAR CONFORMATIONAL STABILITY AND SPECTROSCOPIC ANALYSIS OF N
1-(PHENYLSULFONYL)-1H-INDOL
QUANTUM CHEMICAL CALCULATIONS
1
Srinivasaraghavan, R.,
*,21
Department of Physics, SCSVMV University, Enathur, Kanchipuram 631 561, India
2
Department of Physics, L.N. Govt. College,
3
Department of Physics, Pallavan College of Engineering, Kanchipuram
4
Department of Physics, Govt. College for Men, Nandanam, Chennai, India
ARTICLE INFO ABSTRACT
The complete vibration analysis of the fundamental modes of indol-2
Raman data and quantum chemical studies. The observed vibrational dat
wavenumbers derived theoretically from the optimized geometry of the compound from the DFT B3LYP gradient calculations employing 6
Thermodynamic properties like entropy, heat capacity and the HOMO
using natural bond orbital (NBO) and natural localized molecular orbital (NLMO) analysis. Important non-linear pro
computed using B3LYP quantum chemical calculations. Finally, the Mulliken population analysis on atomic charges of the title compound were calculated.
Copyright © 2015 Srinivasaraghavan et al. This is an open access article distributed under the Creative Commons Att use, distribution, and reproduction in any medium, provided the original work is properly cited.
INTRODUCTION
N-((3-Bromo-1-(phenylsulfonyl)-1H-indol-2-acetamide is otherwise called (N3BP2MA). exhibit antibacterial, antifungal (Singh et al
antitumor activities (Andreani et al., 2001). These derivatives also exhibit antimicrobial, antibiotic, analgesic, anticancer and anti-HIV (Pomarnacka and Kozlarska-Kedra, 2003;
and Pandeya, 2011) activities. The Compound was synthesized by A.K. Mohanakrishnan et al. (2013) and no further studies have been carried out for the title compound yet. Especially, Studies related to vibrational spectroscopic investigation an assignments using ab initio and dft techniques for the title compound are not reported and analyzed in the literature. Hence, in this study, we set out experimental and theoretical investigation of the vibrational and electronic transitions of N3BP2MA. In the ground state theoretical geometrical parameters, IR and Raman spectra, HOMO and LUMO energies of title molecule were calculated by using Gaussian 03W program.
*Corresponding author: Seshadri
Department of Physics, L.N. Govt. College, Ponneri 601 204, India
ISSN: 0975-833X
Article History: Received 12th April, 2015
Received in revised form 26th May, 2015
Accepted 30th June, 2015 Published online 31st July,2015
Key words:
N3BP2MA, PED, NBO, NLMO, MEP
Citation: Srinivasaraghavan, R., Seshadri, S.,
spectroscopic analysis of n-((3-bromo-1-(phenylsulfonyl) calculations”, International Journal of Current Research
RESEARCH ARTICLE
MOLECULAR CONFORMATIONAL STABILITY AND SPECTROSCOPIC ANALYSIS OF N
INDOL-2-YL) METHYL)ACETAMIDE WITH EXPERIMENTAL AND
QUANTUM CHEMICAL CALCULATIONS
*,2
Seshadri, S.,
3Gnanasambandan, T. and
Department of Physics, SCSVMV University, Enathur, Kanchipuram 631 561, India
Department of Physics, L.N. Govt. College, Ponneri 601 204, India
Department of Physics, Pallavan College of Engineering,
Kanchipuram-Department of Physics, Govt. College for Men, Nandanam, Chennai, India
ABSTRACT
The complete vibration analysis of the fundamental modes of
N-2-yl) methyl) acetamide (N3BP2MA) was carried out using the experimental FTIR and FT Raman data and quantum chemical studies. The observed vibrational dat
wavenumbers derived theoretically from the optimized geometry of the compound from the DFT B3LYP gradient calculations employing 6-31G (2d, 3p) and 6
Thermodynamic properties like entropy, heat capacity and enthalpy were calculated for the molecule and the HOMO–LUMO energy gap was calculated. The intramolecular contacts had been interpreted using natural bond orbital (NBO) and natural localized molecular orbital (NLMO) analysis. Important linear properties such as electric dipole moment and first hyperpolarizability of N3BP2MA were computed using B3LYP quantum chemical calculations. Finally, the Mulliken population analysis on atomic charges of the title compound were calculated.
is an open access article distributed under the Creative Commons Attribution License, which use, distribution, and reproduction in any medium, provided the original work is properly cited.
-yl) methyl) . Indole derivatives et al., 2000) and . These derivatives also exhibit antimicrobial, antibiotic, analgesic, anticancer and Kedra, 2003; Srivastava, The Compound was synthesized and no further studies have been carried out for the title compound yet. Especially, Studies related to vibrational spectroscopic investigation and assignments using ab initio and dft techniques for the title compound are not reported and analyzed in the literature.
this study, we set out experimental and theoretical investigation of the vibrational and electronic transitions of N3BP2MA. In the ground state theoretical geometrical parameters, IR and Raman spectra, HOMO and LUMO energies of title molecule were calculated by using Gaussian
Ponneri 601 204, India.
Detailed interpretations of the vibrational spectra of the N3BP2MA have been made on the basis of the calculated potential energy distribution (PED). The experimental results (IR and Raman spectra) were supported by the computed results, comparing with experimental characterization data; vibrational wave numbers are in fairly good agreement with the experimental results. The redistribution of electron density (ED) in various bonding, antibonding orbitals and E (2) energies have been calculated by natural bond orbital (NBO) / Natural Localized Molecular Orbital (NLMO) analysis to give clear evidence of stabilization originating from the hyper conjugation of various intra
analyzing the density of states, the
compositions and their contributions to the chemical bonding were studied. The study of HOMO, LUMO analysis has been used to elucidate information regarding charge transfer within the molecule. Moreover, the Mulliken population analyses the title compound have been calculated and the results have been reported. The experimental and theoretical results supported each other, and the calculations are valuable for providing a reliable insight into the vibrational spectra and molecular properties.
Available online at http://www.journalcra.com
International Journal of Current Research
Vol. 7, Issue, 07, pp.18383-18400, July, 2015
INTERNATIONAL
Srinivasaraghavan, R., Seshadri, S.,Gnanasambandan, T. and Srinivasan, G. 2015. “Molecular conformational stability and (phenylsulfonyl)-1h-indol-2-yl)methyl)acetamide with experimental and quantum chemical
International Journal of Current Research, 7, (7), 18383-18400.
z
MOLECULAR CONFORMATIONAL STABILITY AND SPECTROSCOPIC ANALYSIS OF
N-((3-BROMO-EXPERIMENTAL AND
Gnanasambandan, T. and
4Srinivasan, G.
Department of Physics, SCSVMV University, Enathur, Kanchipuram 631 561, India
Ponneri 601 204, India
-631502, India
Department of Physics, Govt. College for Men, Nandanam, Chennai, India
-((3-Bromo-1-(phenylsulfonyl) -1H-was carried out using the experimental FTIR and FT-Raman data and quantum chemical studies. The observed vibrational data were compared with the wavenumbers derived theoretically from the optimized geometry of the compound from the DFT–
31G (2d, 3p) and 6-311++G (2d, 3p) basis sets. and enthalpy were calculated for the molecule LUMO energy gap was calculated. The intramolecular contacts had been interpreted using natural bond orbital (NBO) and natural localized molecular orbital (NLMO) analysis. Important perties such as electric dipole moment and first hyperpolarizability of N3BP2MA were computed using B3LYP quantum chemical calculations. Finally, the Mulliken population analysis on
ribution License, which permits unrestricted
Detailed interpretations of the vibrational spectra of the N3BP2MA have been made on the basis of the calculated potential energy distribution (PED). The experimental results (IR and Raman spectra) were supported by the computed esults, comparing with experimental characterization data; numbers are in fairly good agreement with the experimental results. The redistribution of electron density (ED) in various bonding, antibonding orbitals and E (2) n calculated by natural bond orbital (NBO) / Natural Localized Molecular Orbital (NLMO) analysis to give clear evidence of stabilization originating from the hyper conjugation of various intra-molecular interactions. By analyzing the density of states, the molecular orbital compositions and their contributions to the chemical bonding were studied. The study of HOMO, LUMO analysis has been used to elucidate information regarding charge transfer within the molecule. Moreover, the Mulliken population analyses of the title compound have been calculated and the results have been reported. The experimental and theoretical results supported each other, and the calculations are valuable for providing a reliable insight into the vibrational spectra and
INTERNATIONAL JOURNAL OF CURRENT RESEARCH
Experimental
The compound N-((3-Bromo-1-(phenylsulfonyl)-1H-indol-2-yl)methyl)acetamide (N3BP2MA) was a synthesized one and reported in Literature (Umadevi et al., 2013) and used as such without further purification to record FTIR and FT Raman spectra. The FTIR spectrum of the compounds is recorded in the region 4000 – 400 cm-1 in evacuation mode on Bruker IFS 66V spectrophotometer using KBr pellet technique (solid phase) with 4.0 cm-1 resolutions. The FT-Raman spectra of these compounds are also recorded in the same instrument with FRA 106 Raman module equipped with Nd: YAG laser source operating at 1.064 m line widths with 200 mW power. The spectra are recorded in the range of 3500–100 cm−1 with scanning speed of 30 cm−1 min−1 of spectral width 2 cm−1. The frequencies of all sharp bands are accurate to ±1 cm−1. The spectral measurements were carried out at Sophisticated Analytical Instrumentation Facility, IIT, Chennai, India.
Computational details
A complete information regarding the structural characteristics and the fundamental vibrational modes of N-((3-Bromo-1-(phenylsulfonyl)-1H-indol-2-yl)methyl)acetamide(N3BP2MA), has been carried out using the B3LYP correlation functional calculations. The calculations of geometrical parameters in the ground state were performed using the Gaussian 09 (Frisch et al., 2004) program. DFT calculations were carried out with Becke’s three-parameter hybrid model (Becke, 1993) using the Lee–Yang–Parr correlation (Lee et al., 1988) functional (B3LYP) method. The geometry optimization was carried out using the initial geometry generated from standard geometrical parameters of the B3LYP method with 31G (2d, 3p) and 6-311++G (2d, 3p) basis sets. The optimized geometry was determined by minimizing the energy with respect to all geometrical parameters without imposing molecular symmetry constraints. Harmonic vibrational wavenumbers were calculated using analytic second derivatives to confirm the convergence to minima in the potential surface. At the optimized structure of the examined species, no imaginary wavenumber modes were obtained, proving that a true minimum on the potential surface was found. The calculated frequencies are scaled according to the work of Rauhut and Pulay (Pulay et al., 1983; Rauhut and Pulay, 1995), a scaling factor of 0.9613 was used for both basis sets. According to Scaled Quantum Mechanics (SQM) procedure using selectively scaling in the natural internal coordinate representation (Fogarasi et al., 1985; Fogarasi et al., 1992), the transformation of force field; subsequent normal coordinates analysis and calculation of the Potential Energy Distribution (PED) were done on a PC with the MOLVIB program (version V7.0-G77) written by Sundius (Sundius, 1990; Sundius, 2002; MOLVIB, 2002). By the use of the GAUSSVIEW molecular visualization program (Frisch et al., 2000) along with available related molecules; the vibrational frequency assignments were made by their PED with a high degree of confidence. The PED elements provide a measure of each internal coordinate’s contributionto the normal coordinates.
Prediction of Raman intensities
The Raman activities (Si), calculated by the Gaussian 03 programs, were converted to relative Raman intensities (Ii) using the following relationship
f (o - i)4Si Ii =
i(1-exp(-hci /kT))
where o is the exciting frequency (in cm-1 units); i is the vibrational wave number of the ith normal mode; h, c, k are the universal constants and f is the suitably chosen common scaling factor for all the peak intensities.
RESULTS AND DISCUSSION
Molecular geometries
[image:2.595.333.539.352.479.2]In order to find the most optimized geometry, the energies were carried out for N3BP2MA, using B3LYP/6-311G(2d,3f) method and basis set for various possible conformers. There are Twelve conformers for N-((3-Bromo-1-(phenylsulfonyl)-1H-indol-2-yl)methyl)acetamide (N3BP2MA). The computationally predicted various possible conformers obtained for the compound N3BP2MA is shown in Fig. 1. The total energies obtained for these conformers were listed in Table 1.
It is clear in Table 1, the structure optimizations have shown that the conformer C1 have produced the global minimum energy of 327.7877KJ/Cal. Therefore, C1 form is the most stable conformer than the other conformers. The optimized molecular structure with the numbering of atoms of the N3BP2MA is shown in Fig. 2. The most optimized structure parameters of N3BP2MA calculated by DFT-B3LYP levels with the 6-31G(2d,3p) and 6-311++G(2d,3p) basis set are listed in the Table 2 in accordance with the atom numbering scheme given in Fig. 2. The optimized molecular structure of N3BP2MA belongs to C1 point group symmetry. Table 2 compares the calculated bond lengths and angles for N3BP2MA with those experimentally available from literature value (Ramathilagam et al., 2014).
From the theoretical values, we can find that most of the optimized bond angles slightly differ from the experimental values, due to the theoretical calculations belong to isolated molecules in the gaseous phase and the experimental results belong to molecules in the solid state. The theoretical values for the N3BP2MA molecule were compared with the experimental values by means of the root mean square deviation values.
Table 1. Total energies of different conformations of N3BP2MA calculated at the B3LYP/6-311++G(2d,3p) level of theory
S. No Conformers Energy (kJ/Mol)
1 C1 327.7877
2 C2 344.4413
3 C3 930.7399
4 C4 393.3612
5 C5 449.6941
6 C6 364.1442
7 C7 416.9442
8 C8 327.5515
9 C9 1743.7506
Table 2. Molecular parameters of N3BP2MA
Molecular parameter ( Å ) Expt. 6-31g(2d,3p) 6-311++g(2d,3p)
C1-C2 1.387 1.410 1.401
C1-O3 1.216 1.229 1.218
C1-N4 1.420 1.393 1.415
C2-H25 0.930 1.093 0.987
C2-H26 0.930 1.093 0.987
C2-H27 0.930 1.093 0.987
N4-C5 1.396 1.428 1.412
N4-H28 0.980 1.009 0.994
C5-C7 1.389 1.413 1.408
C5-H29 0.930 1.086 0.988
C5-H30 0.930 1.097 0.988
N6-C7 1.396 1.419 1.412
N6-C14 1.396 1.413 1.412
C7-C8 1.388 1.367 1.393
C8-C9 1.450 1.438 1.452
C8-Br24 1.843 1.893 1.839
C9-C10 1.392 1.401 1.393
C9-C14 1.392 1.415 1.397
C10-C11 1.388 1.387 1.390
C10-H31 0.930 1.085 0.992
C11-C12 1.392 1.407 1.402
C11-H32 0.930 1.086 0.992
C12-C13 1.392 1.391 1.390
C12-H33 0.980 1.086 0.992
C13-C14 1.384 1.401 1.402
C13-H34 0.980 1.081 0.992
N6-S15 1.669 1.741 1.753
S15-O16 1.422 1.429 1.426
S15-O17 1.422 1.428 1.425
S15-C18 1.743 1.790 1.746
C18-C19 1.392 1.397 1.395
C18-C23 1.392 1.397 1.392
C19-C20 1.388 1.394 1.390
C19-H35 0.980 1.083 1.105
C20-C21 1.388 1.397 1.397
C20-H36 0.980 1.085 0.992
C21-C22 1.388 1.396 1.394
C21-H37 0.960 1.086 0.992
C22-C23 1.386 1.395 1.394
C22-H38 0.960 1.085 0.992
C23-H39 0.960 1.086 0.992
Bond Angle ( )
C2-C1-O3 121.800 121.300 121.500
C2-C1-N4 110.600 113.300 113.200
C1-C2-H25 109.500 111.900 110.300
C1-C2-H26 109.500 108.600 110.600
C1-C2-H27 109.500 108.700 108.700
O3-C1-N4 121.100 121.400 121.300
C1-N4-C5 122.020 123.300 122.700
C1-N4-H28 118.080 119.100 118.300
H25-C2-H26 109.500 109.000 109.100
H25-C2-H27 109.500 109.100 109.000
H26-C2-H27 109.500 109.700 109.100
C5-N4-H28 118.080 117.500 117.300
N4-C5-C7 117.000 115.800 116.100
N4-C5-H29 107.400 107.400 107.400
N4-C5-H30 107.400 107.900 107.300
C7-C5-H29 109.500 110.000 109.400
C7-C5-H30 109.500 110.000 109.300
C5-C7-N6 126.500 126.900 126.900
C5-C7-C8 126.500 126.300 126.500
H29-C5-H30 109.500 109.500 109.700
C7-N6-C14 107.600 107.900 107.400
N6-C7-C8 110.600 110.800 110.500
N6-C14-C9 110.600 110.500 110.400
N6-C14-C13 129.700 130.700 130.200
C7-C8-C9 112.300 110.700 111.600
C7-C8-Br24 113.800 115.400 112.800
C9-C8-Br24 112.900 112.900 112.900
C8-C9-C10 123.300 123.200 123.500
C8-C9-C14 115.900 116.100 116.100
C10-C9-C14 119.400 120.700 120.400
C9-C10-C11 117.100 118.500 118.600
C9-C10-H31 119.400 119.800 119.400
Continue………..
C9-C14-C13 119.100 119.800 119.400
C11-C10-H31 120.500 121.700 121.000
C10-C11-C12 120.500 120.500 121.000
C10-C11-H32 119.400 119.900 119.700
C12-C11-H32 119.400 119.600 119.300
C11-C12-C13 121.900 121.900 121.800
C11-C12-H33 119.400 119.400 119.200
C13-C12-H33 119.000 118.700 119.000
C12-C13-C14 119.000 117.700 117.900
C12-C13-H34 122.000 121.800 121.700
C14-C13-H34 122.000 121.500 121.400
C7-N6-S15 122.020 122.363 122.135
C14-N6-S15 127.030 127.758 127.282
O16-S15-O17 120.110 120.300 120.100
O16-S15-C18 108.500 108.600 108.300
O17-S15-C18 108.500 108.600 108.500
S15-C18-C19 118.700 118.700 118.600
S15-C18-C23 120.300 119.800 120.300
C19-C18-C23 120.700 121.200 120.400
C18-C19-C20 120.400 119.900 120.000
C18-C19-H35 119.800 120.200 119.900
C18-C23-C22 118.300 118.300 118.500
C18-C23-H39 120.700 121.600 120.900
C20-C19-H35 120.700 121.100 120.900
C19-C20-C21 120.400 120.100 120.600
C19-C20-H36 119.600 119.600 120.000
C21-C20-H36 119.600 120.300 120.100
C20-C21-C22 120.400 120.400 120.400
C20-C21-H37 119.600 119.800 119.600
C22-C21-H37 119.600 119.900 119.700
C21-C22-C23 120.700 120.500 120.500
C21-C22-H38 120.000 120.500 120.500
C23-C22-H38 120.000 119.100 119.500
Fig. 1. Molecular Conformers of N-((3-Bromo-1-(phenylsulfonyl)-1H-indol-2-yl)methyl)acetamide
Fig. 2. Optimised Structure of N-((3-Bromo-1-(phenylsulfonyl)-1H-indol-2-yl)methyl)acetamide
[image:6.595.73.532.438.713.2]Comparing the B3LYP/6-31G(2d,3p) and B3LYP/6-311++G(2d,3p) methods, most of the bond lengths and bond angles are the same in both the methods. The inclusion of diffusion and polarization functions is important to have a better agreement with experimental geometry.
Vibrational assignments
The molecular structure of N3BP2MA belongs to C1 point group symmetry. For C1 symmetry there would not be any relevant distribution. The molecule N3BP2MA consists of 39 atoms and expected to have 111 normal modes of vibrations of the same A species under C1 symmetry. These modes are found to be IR and Raman active, suggesting that the molecule possesses a non-Centro symmetric structure, which recommends the title compound for nonlinear optical applications.
[image:7.595.46.554.278.738.2]The harmonic vibration modes calculated for N3BP2MA at B3LYP level using the 6-31G (2d, 3p) and 6-311++G (2d, 3p) basis set along with Potential energy distribution has been summarized in Tables 3. The observed FTIR and FT Raman bands for various modes of vibrations of N3BP2MA are assigned and are presented in the Table 3 along with the DFT data. The force fields, thus determined were used to calculate the vibrational potential energy distribution (PED) using the latest version of the MOLVIB program (Sundius, 1990; Sundius, 2002; MOLVIB, 2002). The experimental FT-IR and FT-Raman spectra with corresponding theoretically simulated IR and Raman spectra of N3BP2MA as shown in the Figs. 3 and 4 respectively, where the calculated infrared intensities and Raman intensities are plotted against the vibrational frequencies.
Table 3. Vibrational assignments of N3BP2MA using B3LYP/ 6-31 G(2d,3p) and B3LYP/6-311++G(2d,3p)
IR cm-1 Raman cm-1 B3LYP/6-31 G(2d,3p) B3LYP/6-311++G(2d,3p) Assignments PED %
cm-1 IR intensity Raman activity cm-1 IR intensity Raman activity
10 0.4216 4.7121 12 1.0418 0.2061 ring (21)
19 1.5654 3.8245 20 0.4673 0.4720 ring (16) +CN (61) 22 0.6552 2.5223 24 2.6101 2.3516 SO2(wag) (28)
43 1.7654 2.7164 42 0.2449 3.2278 ring (23)
53 0.3476 5.1528 56 3.8350 1.0723 CH3(wag) (25)
60 0.6391 5.0516 60 0.1801 1.7163 SO2(wag) (28)
85 0.2045 1.7586 85 4.2131 0.8905 CC(76)
107 109 13.3041 1.8342 109 5.7514 0.9341 α CO (38) +CCN (20)
120 120 1.5159 2.3386 121 0.2400 0.2073 SO2 (54)
131 0.6996 2.2898 132 0.7213 0.9104 α C N (32) + CH (17)
138 139 0.6875 2.5137 139 0.3476 0.9478 CH3 (46)
178 177 0.3652 1.3795 176 0.3695 1.1097 C N (33) + CH (9)
185 185 2.0960 0.6594 184 2.8763 3.3960 CH3 (51)
202 203 3.9129 3.0742 202 1.0565 1.6501 ring 1 (51)
212 214 7.5609 2.5085 218 3.6912 0.6818 NCC(13)
237 239 2.5027 1.9625 241 2.3465 3.7695 CH2 (49)
257 1.9125 3.5759 257 2.5636 0.7539 CCC(37)
275 273 3.3964 1.8177 275 1.3342 2.2337 CC(24)+ ring(23)
308 308 1.8131 4.4542 308 5.5005 6.0495 ring 1 (47)
324 326 1.3972 6.5634 327 5.9013 2.0623 ring (12)+ CCC (15) 344 0.9570 1.4952 345 4.1203 5.5013 CN (16)+ ring (11)
365 366 0.3321 2.3684 365 2.8776 11.3111 CBr (22)
372 1.1607 2.3973 371 0.0287 0.8505 ring(11)+ NCH(8) 422 424 424 0.1996 0.0381 423 25.3955 82.4674 ring 4 (53) + CS (51)
430 430 0.6650 1.9329 430 9.3471 15.5078 ring 4 (57)
438 439 4.6372 0.8870 440 67.1443 0.9770 ring (23) +CH(12) 445 446 21.2089 2.9780 447 11.6581 61.1047 Ring (22) +CN (11) 471 471 471 9.3126 2.3448 473 22.4293 13.4675 CN(69), ring 4 (31) 495 497 30.5812 2.9683 497 6.9322 53.1356 NS(61),ring 4 (34)
520 521 519 44.1479 2.9480 518 71.0353 1.8845 NC(13) +CCO(21)
551 551 552 90.0112 1.8316 551 64.1435 6.0592 ring (23)
565 562 561 51.1956 1.6999 559 61.2594 7.3414 CH(15)+ CN(9)
581 580 58.6296 9.2518 576 99.2477 8.2577 CS(58)
602 601 601 0.2016 1.1035 600 3.8379 3.6284 CO(59)+NC(17)
624 625 0.7512 5.0927 628 39.4921 6.4323 NH (52)
659 659 657 8.3570 3.6517 657 0.5812 2.5605 CBr(34)
666 666 668 10.8231 0.5711 665 6.2351 62.4527 CC(28)
692 691 22.4580 2.8859 691 55.5692 6.4465 CN(26)
710 711 714 11.0872 3.2132 714 96.4832 5.8979 CCN(24)
742 741 27.1812 0.1758 742 7.4327 57.9460 NCH(21)
759 760 760 40.5375 6.4225 760 94.1247 9.0256 CC(18)
769 768 47.5406 13.8391 769 11.9223 63.4822 CH(21) + CS (61)
807 807 809 41.8942 2.2189 809 80.7554 13.6788 ring(23)
818 819 17.3823 5.3889 818 2.2567 80.4773 CH(86)+CN(8)
Continue…………
821 823 823 10.4006 0.9684 822 58.0721 19.5932 CH (43)
892 892 892 1.3312 2.5499 891 99.1386 9.7123 CH(79) +CC(25)
819 819 895 1.1109 8.6146 894 6.9450 49.2934 CN(12)
910 915 0.7400 4.3067 914 13.1267 10.4332 CC(46)+ ring(9)
965 967 38.4149 6.7900 965 4.0689 19.4882 SO(55)
969 970 6.1883 2.0309 969 15.7564 5.6395 SO(55)
979 980 983 2.4271 0.6693 982 34.0862 19.9237 CN(27)+ CC(55)
988 987 2.1397 0.8753 987 2.2238 7.0738 CN(16)
999 999 0.0404 0.1886 998 0.6500 4.9404 CH(39)+ CC(18)
1006 1006 1005 2.4230 1.9955 1003 1.2913 13.0380 CH(33)+ NCH(15) 1021 1021 1023 10.5889 4.3306 1026 7.4438 4.6136 CC(47)+ CN(31)
1045 1048 2.8783 22.0082 1049 7.4563 2.9587 CO(19)+CCH(9)
1057 1057 1060 8.9818 1.2780 1062 46.0706 10.2557 CH(38)+ CCC(24) 1072 1071 55.2317 3.6640 1070 46.5026 20.2500 CC(46)+ ring(9) 1079 1080 2.1484 21.1327 1079 27.8678 5.2650 CCH(46)+ CC(64) 1087 1088 1086 19.2371 23.4257 1084 68.4236 17.9857 NCH(17)+ ring(23)
1099 1100 1098 6.6292 0.4929 1100 15.7705 9.5450 SO(39)
1157 1156 1159 35.2553 6.5374 1160 23.3439 12.0405 CCH(18)+ ring(10) 1170 1168 1168 49.9393 9.0075 1168 34.6322 21.4371 NCH(21)+ CCH(16)
1175 1174 28.3428 4.4171 1174 1.5170 10.9928 CC(27)+CN(12) 1195 1195 1198 6.3951 0.7750 1197 2.3398 0.9031 CCH(64)+CC(27)
1204 1200 17.8978 6.4113 1199 4.5820 9.7787 CCH(37)
1209 1209 1210 67.9502 39.4005 1209 9.5371 7.8455 CCH(42)+ CC(53) 1229 1228 13.1157 4.5775 1227 35.6376 5.1642 CH(53)+ sSO(67)
1237 1236 0.8309 6.5263 1233 70.2370 19.9317 CCH(18)+CCO(11)
1247 1247 1245 0.3211 4.9520 1247 9.1652 7.1968 CCH(33)+ CCC(23) 1286 1287 1288 48.2764 2.9280 1287 3.3850 83.3930 NCH(48)+ CC(41) 1297 1297 1296 49.7561 8.6240 1297 93.5751 15.4960 CC(87) + aSO(78)
1305 1301 1301 82.8592 26.8048 1301 15.0321 60.7183 CCH(80)+CN(14) 1314 1314 1312 57.8019 5.8915 1311 12.5294 44.3374 CN(41)+ CCC(17)
1329 1328 1328 1.8471 1.8567 1329 4.9612 6.8194 CN(63)
1347 1345 1345 3.7020 0.7354 1346 5.7373 63.8701 CC(81) + CCH(33)
1354 1354 43.7673 17.1130 1354 9.3890 12.2240 CN(61)
1356 1356 1358 87.8063 25.2372 1360 7.9856 21.8860 CC(53) + CCH(33)
1368 1367 1370 7.2995 2.7809 1370 33.0696 76.1109 CC(49)
1398 1396 4.1150 25.0017 1399 22.3910 13.5085 CC(49) + CCC(21) 1401 1401 1400 28.9088 23.2944 1402 39.0947 8.1595 CN(54)+ CCC(23)
1410 1410 1413 29.0043 14.5959 1414 42.6485 53.3586 CN(56)
1439 1438 56.7877 20.3116 1439 41.2179 4.0575 CC (79)+ HCH(13) 1479 1479 1482 6.0874 13.2862 1479 39.6579 53.5582 CC(49) + CCC(21) 1485 1487 23.1564 0.9814 1487 90.3950 17.3050 CC(51) + CCH(33) 1498 1498 1495 7.0817 10.7378 1498 52.3101 80.3220 HCH(55) + CCH(29) 1503 1502 1501 18.7602 13.4344 1503 60.4533 49.3354 HCH(52) + CCH(41)
1520 1520 1520 0.5463 8.1709 1521 7.2742 61.6126 CCH(33)
1543 1544 3.2522 1.0837 1547 99.1721 2.8829 CCH(58) + CC(47) 1559 1557 1556 99.8014 3.9046 1557 14.2848 0.2133 CCH(38) + CC(68) 1579 1580 1578 1.4559 69.0577 1577 1.4106 17.8593 HCH(59) + CCH(37)
1595 1593 4.6307 14.7080 1592 26.1024 1.6864 CC(47)
1603 1604 1601 2.7272 45.7757 1603 85.5443 6.7973 CN(89)
1611 1612 0.1685 6.8892 1612 15.6818 0.3681 CC(83) + ring(38)
1630 1631 2.4232 42.9951 1635 3.8518 7.4284 CC(47) +CCH(23)
1647 1646 1648 97.6796 5.6484 1650 99.5094 1.4953 C=O(61)
2949 2948 2948 17.5213 85.8225 2945 3.6068 99.3736 CH(94)
3015 3017 3011 6.5953 76.4275 3014 26.4117 8.3335 CH(97)
3068 3070 3068 5.5389 90.8007 3067 11.5070 40.8032 s CH(96)
3094 3093 3092 15.3744 47.0123 3089 12.4030 47.8987 s CH(97)
3124 3125 3122 2.9410 65.0306 3121 54.4943 12.8866 s CH(99)
3149 3149 3.5618 54.8950 3147 40.9095 2.6700 s CH(98)
3160 3159 3160 11.1324 72.8111 3156 10.6341 7.7189 CH(98)
3177 3176 3175 11.4237 45.4758 3171 43.3017 1.8323 asCH(99)
3179 3178 23.4241 75.6347 3178 12.2138 43.5650 CH(99)
3181 3182 3182 7.0773 46.0216 3181 4.9250 38.2696 asCH(97)
3187 3187 3186 17.8701 96.5721 3186 2.7135 33.7454 asCH(98)
3190 3189 23.9300 98.3412 3188 73.8214 4.0477 asCH(99)
3195 3195 3196 1.8096 58.1264 3194 54.5990 6.0723 asCH(98)
3199 3198 1.7544 71.7765 3197 62.0329 7.6999 asCH(99)
In the spectra, the theoretically simulated spectra are more regular than the experimental ones because many vibrations presenting in condensed phase lead to strong perturbation of infrared and Raman intensities of many other modes. The RMS error of the observed and calculated frequencies (unscaled) of N3BP2MA is quite obvious since the frequencies are calculated on the basis of quantum mechanical force fields usually differ appreciably from observed frequencies. This is partly due to the neglect of anharmonicity and partly due to the approximate nature of the quantum mechanical methods. In order to reproduce the calculated frequencies, the scale factors were refined and optimized via a least squares refinement algorithm.
N-H vibrations
Primary aliphatic amines absorb in the region 3450–3250 cm−1 in solids or liquids and they are broad and of medium intensity. Solid and liquid phases, a band of medium intensity is observed at 3500–3300 cm−1 for secondary aromatic amines. In general the vibrational bands due to the N–H stretching are sharper and weaker than those of O–H stretching vibrations by virtue of which they can be easily identified (Gunasekaran et al., 2003; Collins et al., 1998). In the present case the compounds chosen for study is a hetero cyclic aromatic system of pyrimidine and has only one N-H stretching vibration at its side chain substitution. Hence, the band appears at 3460 cm-1 in the FTIR spectrum and the band at 3459 cm-1 in the FT Raman spectrum of N3BP2MA is assigned to the N-H stretching mode of vibration. The Wavenumbers calculated through B3LYP/6-31G(2d,3p) and B3LYP/6-311++G(2d,3p) methods are in good agreement with the experimental values.
C-H Vibrations
The substituted benzene like molecule gives rise to C–H stretching, C–H in-plane and C–H out-of-plane bending vibration. In the aromatic compounds, the carbon–hydrogen stretching vibrations normally occur at 3250–3000 cm−1 (Gunasekaran et al., 2008). Heterocyclic compound C-H vibration absorption bands are usually weak; in many cases it is too weak for detection. The bands due to C–H in-plane bending vibrations interact somewhat with C–C stretching vibrations is observed as a number of bands in the region 1450–1100 cm−1. The C–H out-of-plane bending vibrations occur in the region 900–667 cm−1 (Gunasekaran et al., 2008; Puviarasan et al., 2002). In this region the vibrations are not found to be affected due to the nature and position of the substituent (Varsanyi, 1973). In the present work, the bands observed at 3199, 3190, 3181 and 3176 cm-1 are assigned to C-H asymmetric vibrations and 3149, 3124, 3094, 3070 cm-1 in the N3BP2MA compound have been assigned to C-H symmetric stretching vibration. Apart from the mentioned values other vibrations in the same range are assigned to C-H stretching vibrations respectively. The C-H bending vibrations appear at two distinct regions 1490 - 1300 cm-1 and 1100 – 900 cm-1, due to in plane and out of plane bending vibrations respectively (Krishnakumar and John Xavier, 2003; Krishnakumar and Prabavathi, 2008). The band position observed at 1487 cm-1 and 1057 cm-1 in experimental spectrum of N3BP2MA are assigned to C-H in plane and out of plane bending vibrations The wave numbers calculated through DFT
techniques are in good agreement with the experimental data (Krishnakumar and John Xavier, 2003).
C-N vibrations
The identification of C-N stretching vibration is a very difficult task, since the mixing of bands is possible in this region. The FT Raman band observed in 1314, 1328 and 1354 cm-1 in N3BP2MA have been designated to the C-N stretching mode of vibration. These assignments are made in accordance with the assignment proposed by Bienko, Michalska et al. (1999). The C-N stretching band assigned at 1319 cm-1 in 2,6-dibromo-4-nitroaniline by Krishna Kumar (2005), Raja et al. (1994) have identified the FTIR band at 1342 cm-1 due to C-N in theophylline. Gunasekaran et al. (2005) have observed the C-N stretching band at 1312cm-1 in benzocaine. The calculated value at 1312,1328 and 1354 cm-1 of N3BP2MA are in excellent agreement with the observed value for the corresponding mode of vibration.
C-C vibrations
The C-C aromatic stretching, vibration gives rise to characteristic bands in both the observed IR and Raman spectra, covering the spectral range from 1600 – 1400 cm-1. The IR bands located at 1595, 1559, 1485 cm-1 and 1356 cm-1 ; the Raman bands centered at 1593, 1557, 1487 and 1356 cm-1 have been assigned to C-C stretching vibrations. Of these bands, 1559 cm-1 have appeared characteristically strong in the IR and Raman spectra. The calculated bands at B3LYP level in the same region are in excellent agreement with experimental observations of both in FTIR and FT Raman spectra of N3BP2MA (Gunasekaran et al., 1994; Silverstein et al., 1981). The ring in plane vibrations has given rise to weak bands across the low wavenumber region, that is to say, below 1000 cm-1. The bands at 892 cm-1 and at 999cm-1 have been assigned to C-C in plane bending vibrations. As is seen from Table 3 the predicted vibrational bands agree well with the observed ones.
C-S Vibrations
In general the assignment of the band due to C-S stretching vibrations in different compounds is difficult. Both aliphatic and aromatic sulphides have weak to medium band due to C-S stretching in the region 780 - 510 cm-1 (Gunasekaran et al., 2003; Roggers, 1994). Double bond conjugation with the C-S band like vinyl or phenyl lowers the C-S stretching frequency and increases the intensity. In view of this the medium intensed bands present at 581 and 769 cm-1 in the FTIR spectrum of N3BP2MA and the band at 769 cm-1 in the FT Raman spectrum of N3BP2MA are assigned to be due to C-S stretching modes of vibrations.
S =O Stretching vibration
In solid phase sulphonamides have a strong, broad absorption band at 1360-1315 cm-1 due to the asymmetric stretching vibration of S=O group, whereas the symmetric stretching vibration of this group shows the occurrence at 1280 - 1240 cm-1 (Seshadri et al., 2009; Jong Rack Sohn et al., 2001).
Similarly, in the case of dilute solutions in nonpolar solvents, all organic sulphonamides have two strong bands at 1360 – 1290 cm-1 and 1270-1220 cm-1 due to asymmetric and symmetric stretching vibrations respectively. In the present case, the FTIR spectrum of N3BP2MA, shows the presence of the bands due to symmetric and asymmetric stretching of the S=O group at 1229 cm-1 and at 1297 cm-1 respectively.
Other molecular properties
NLO properties
Many organic molecules that contain conjugated electrons are characterized hyperpolarizabilities have been analyzed by means of vibrational spectroscopy (Thomson and Torkingto, 1945; Glendening et al., 2001). Both the B3LYP/6-31G(2d,3p) and B3LYP/6-311++G(2d,3p) method has been used for the prediction of first order hyperpolarizability () of the title compound. The tensor components of the static first order hyperpolarizability () were analytically calculated by using the same method as mentioned above. From the computed tensorial components, is calculated for the title compound by taking into account the Kleimman symmetry relations and the square norm of the Cartesian expression for the tensor (Reed et al., 1988).
The first order hyperpolarizability () of this novel molecular system and the related properties (0 and ) of N3BP2MA were calculated, based on the finite field approach. The complete equations for calculating the magnitude of the total static dipole moment , the mean polarizability 0, the anisotropy of the polarizability , and the mean first order hyperpolarizability , using the x, y, z components are defined as follow:
= (2x + 2y + 2z)1/2
= (2x +2y +2z) ½
αxx + αyy + αzz α =
3
∆α = 2 -1/2 ( (αxx – αyy) 2
+ (αyy – αzz) 2
+ (αzz – αxx) 2
+ 6 α2xx) 1/2
Where
= xxx + xyy + xzz = yyy + xxy + yzz = zzz + xxz + yyz
The components of polarizability and the first order hyperpolarizability of the title compound can be seen in Table 4. The calculated value of first hyperpolarizability shows that N3BP2MA might have the NLO properties. The nonlinear optical activity provides useful information for frequency shifting, optical modulation, optical switching and optical logic for the developing technologies in areas such as communication, signal processing and optical interconnections.
NBO/ NLMO analysis
NBO (Natural Bond Orbital) analysis provides an efficient method for studying intra and inter molecular bonding and interaction among bonds, and also provides a convenient basis for investigation, charge transfer or conjugative interactions in the molecular system (Thomson and Torkingto, 1945). By the use of the second-order bond–antibond (donor–acceptor) NBO energetic analysis, insight in the most important delocalization schemes was obtained. The change in electron density (ED) in the (*, *) antibonding orbitals and E(2) energies have been calculated by natural bond orbital (NBO) analysis (Thomson and Torkingto, 1945) using DFT methods to give clear evidence of stabilization originating from various molecular interactions. NBO analysis has been performed on N3BP2MA in order to elucidate intramolecular hydrogen bonding, intramolecular charge transfer (ICT) interactions and delocalization of -electrons. The hyperconjugative interaction energy was deduced from the second-order perturbation approach (Glendening et al., 2001).
Where
( | | )
or is the Fock matrix element between the i and j NBOs, and ∗ are the energies of and *NBOs, and is the population of the donor orbital.
In Table 5, the perturbation energies of significant donor– acceptor interactions are presented. The larger the E(2) value, the intensive is the interaction between electron donors and electron acceptors. In N3BP2MA, the interactions between antibonding of C9-C14 and the corresponding antibonding of C12–C13 have the high E (2) value around 257.71 kcal/Mol. The other significant interactions, giving stronger stabilization energy value of 237.22 kcal/Mol to the structure is the interactions between antibonding of C18–C23 between the antibonding of C19-C20. Table 5 gives the occupancy of electrons and p-character (Reed et al., 1988) in significant NBO natural atomic hybrid orbital. In C–H bonds, the hydrogen atoms have almost 0% of character. The 100% p-character is observed in the first lone pair of N4, N6 and in the third lone pair of O16.
Table 4. The calculated , and components of N3BP2MA
Parameters B3LYP/6-31G(2d,3p) B3LYP/ 6-311++G(2d,3p) Parameters B3LYP/6-31G(2d,3p) B3LYP/ 6-311++G(2d,3p)
x 0.9074 0.8156 xxx 466.939 529.632
y 0.4724 0.4167 xxy 162.884 -98.574
z -3.9794 -4.2380 xyy -70.264 84.201
4.1088 4.7377 yyy -51.961 -28.989
xx 352.206 311.741 xxz -48.738 -53.454
xy -1.553 -4.117 xyz 2.094 5.559
yy 274.150 204.792 yyz -8.497 24.715
xz 6.214 6.750 xzz 2.867 12.111
yz 12.455 13.043 yzz -0.176 3. 607
zz 73.712 88.437 zzz -2.073 2.523
tot 233.356 201.646 tot(esu) 1.43 x 10
-30 1.61 x 10⁻³⁰
[image:11.595.177.423.296.398.2] 658.932 811.132
Table 5. Second order perturbation theory, analysis of Fock matrix in NBO basis of N3BP2MA
Donor(i) Acceptor(J) E2 kcal/mol E(j)-E(i) a.u F(i,j)a.u
LP(1) N4 *C1-O3 52.90 0.32 0.117 LP(1)N6 *C7-C8 32.67 0.30 0.089 LP(1)N6 *C9-C14 27.55 0.31 0.086 LP(3)O16 *N6-S15 23.75 0.37 0.086 *C7-C8 *C9-C14 165.85 0.01 0.061 *C9-C14 *C10-C11 207.42 0.02 0.081 *C9-C14 *C12-C13 257.71 0.01 0.081 *C18-C23 *C19-C20 237.22 0.01 0.077 *C18-C23 *C21-C22 211.89 0.01 0.085
a E(2) means energy of hyper conjugative interaction (stabilization energy). b
Energy difference between donor and acceptor i and j NBO orbitals.
c F(i, j) is the fork matrix element between i and j NBO orbitals.
Table 6. Occupancy, percentage of p character of significant natural atomic hybrid of the natural bond orbital of N3BP2MA calculated at B3LYP/6-311++ G(2d,3p)
Bond ED(e) Hybrid Atom p.%
BD(2) C7-C8 1.8771 0.6760 (sp1.00)C+0.7369(sp1.00)C C7 99.92 BD(2)C9-C14 1.60940 0.7105(sp1.00)C+0.7037(sp1.00)C C9 99.97 BD(2)C10-C11 1.71593 0.7045(sp1.00)C+0.7097(sp1.00)C C10 99.95 BD(2)C18-C23 1.68005 0.7601(sp1.00)C+0.6498(sp1.00)C C18 99.98 BD(2)C19-C20 1.65157 0.6983(sp1.00)C+0.7158(sp1.00)C C19 99.96 BD(2)C21-C22 1.63734 0.7008(sp1.00)C+0.7134(sp1.00)C C21 99.96
LP(1) N4 1.69767 p1.00 N4 99.72
LP(1)N6 1.66327 p1.00 N6 99.94
LP(3) O16 1.76772 p1.00 O16 99.68
BD(2) C7-C8 0.31919 0.7369(sp1.00)C-0.6760(sp1.00)C C7 99.92 BD(2)C9-C14 0.47635 0.7037(sp1.00) C-0.7105(sp1.00)C C9 99.97 BD(2)C10-C11 0.30065 0.7097(sp1.00)-0.7045(sp1.00)C C10 99.95 BD(2)C18-C23 0.38319 0.6498(sp1.00)C-0.7601(sp1.00)C C18 99.98 BD(2)C19-C20 0.30728 0.7158(sp1.00)-0.6983(sp1.00)C C19 99.96 BD(2)C21-C22 0.31023 0.7134(sp1.00)C-0.7008(sp1.00) C21 99.96
Table 7. Significant NLMO’s occupancies, percentage from parent NBO and atomic hybrid contributions of N3BP2MA calculated using B3LYP/6-311++G (2d,3p) basis set
Bond Occupancy % from Parent NBO Hybrid contributions
Atom %
BD(2)C9-C14 2.00000 79.39 C7 2.540
C8 2.068
C10 6.279
C11 2.068
C12 3.214
C13 3.563
BD(2)C19-C20 2.00000 81.9060 C18 3.389
C21 8.124
C22 2.083
C23 4.387
BD(2)C21-C22 2.00000 80.1715 C18 4.446
C19 4.171
C20 4.194
C23 6.549
[image:11.595.153.448.459.614.2] [image:11.595.115.483.650.803.2]Molecular electrostatic potential
Molecular electrostatic potential and electrostatic potential is
useful quantities to illustrate the charge distributions of molecules and used to visualize variably charged regions of a molecule. Therefore, the charge distributions can give information about how the molecules interact with another molecule. The molecular electrostatic potential is widely used as a reactivity map displaying most probable regions for the electrophilic attack of charged point-like reagents on organic molecules (Politzer and Truhlar, 1981). The molecular electrostatic potential V (r) that is created in the space around a molecule by its nuclei and electrons is well established as a guide to molecular reactive behavior. It is defined by:
( ) =
(
− )
−
( )
(
− )
′
in which ZA is the charge of nucleus A, located at RA, (r') is the electron density function of the molecule and r' is the dummy integration variable (Politzer et al., 1985). At any given point r(x, y, z) in the vicinity of a molecule, the molecular electrostatic potential (MEP), V(r) is defined in terms of the interaction energy between the electric charge generated from the molecule's electrons and nuclei and a positive test charge (a proton) located at r (Politzer and Murray, 2002).
In the graphic of total electron density surface mapped with the electrostatic potential, the sign of the electrostatic potential in a surface region is determined by the predominance of negative
charges contribution or positive charges contribution. Accordingly, it is possible to identify regions more susceptible to an approximation of electrophilic molecules or nucleophilic molecules, so the molecular electrostatic potential map is commonly used as reactivity map. To predict regions more susceptible to approximation of either electrophiles or nucleophiles, MESP was calculated at the B3LYP/6-31G (2d,3p) is shown in Fig. 5. The importance of total electron density surface mapped with the electrostatic potential lies in the fact that it simultaneously displays molecular size, shape, as well as positive or negative electrostatic potential regions in terms of color grading and is very useful in research of molecular structure with its physiochemical property relationship (Okulik and Jubert, 2005).
The different values of the electrostatic potential are represented by different colors. The range values for the color scale of the mapped MESP should be symmetrical to allow easy identification of negative (red) and the positive (blue) potential regions. The use of a symmetrical potential scale values eases the recognition of positive, zero or negative regions. In GaussView visualizing program (Rauhut and Pulay, 1995) the following spectral color scheme is used. So potential increases in the order: red < orange < yellow < green < cyan < blue. Therefore red indicates negative regions, blue indicates positive regions, while green appears over zero electrostatic potential regions.
[image:12.595.49.545.381.676.2]It is accepted that the negative (red) and the positive (blue) potential regions in the mapped MESP represent regions
susceptible to approach electrophilic molecules or nucleophilic molecules, respectively.
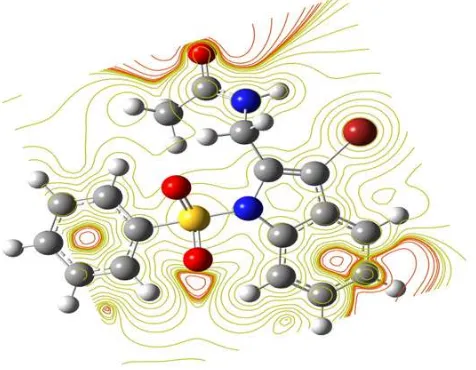
Fig.5. Molecular electrostatic potential of N3BP2MA
[image:13.595.318.546.239.415.2]It can be seen that the most possible sites for electrophilic attack is H15. Negative regions of the studied molecule are found around the C5, C6 and C7 atoms indicating a possible site for nucleophilic attack. According to these calculated results, the MEP map shows that the negative potential sites are on electronegative atoms as well as the positive potential sites are around the hydrogen atoms. The contour map provides a simple way to predict how different geometries could interact and is shown in Fig. 6.
Fig. 6. The contour map of electrostatic potential of the total density of N3BP2MA
Mulliken Charge distribution
The Mulliken populations show one of the simplest pictures of charge distribution. The Mulliken charges provide net atomic populations in the molecule while electrostatic potentials yield the electric field out of the molecule produced by the internal charge distribution. Thus, in the reactivity studies, Mulliken
populations and MESP are complementary tools, and correlation between the schemes is expected (Mulliken, 1955). However, Mulliken population analysis requires very careful because problems as large changes of the calculated atomic charges with small changes in the bases used and the overestimation of the covalent character of a bond are common. So, in general, the absolute magnitude of the atomic charges has little physical meaning, on the other hand, their relative values can offer valuable information. The Mulliken charge distribution of the molecule was calculated at B3LYP level with 6-31G (d,p) and 6-311++G(d,p) basis sets. Mulliken charge distribution graphically and structurally is shown in Figs. 7 & 8. The total atomic charges of N3BP2MA using B3LYP/6-31G(2d,3p) and B3LYP/6-311++G(2d,3p) methods were listed in Table 8.
[image:13.595.44.282.450.635.2]Fig. 7. Histogram of calculated Mullikan atomic charges of N3BP2MA
Fig. 8. Structural charge distribution of N3BP2MA
For Mulliken charge distribution, the GaussView adopts the follow colors scheme: bright red for more negative charge and bright green for a more positive charge. The red hues illustrate negative charges while green hues expose positive charges. The charge distribution of the compound shows that carbon atom (C18) attached with sulphur and carbon atoms has negative charges. All the hydrogen atoms have positive Mulliken charges. The atom C1 has the highest Mulliken charge (0.574488) when compared to other atoms. The Suplhur
[image:13.595.316.557.459.616.2]element present in the compound S15 has a maximum positive value of 1.585617. The nitrogen (N6) atoms are much more negative charge than the other atoms. The smallest Mulliken charge value (0.373985) was obtained for N4 atom. The Mulliken charge distribution and the MESP information are concordant.
Global and local reactivity descriptors
The Highest Occupied Molecular Orbitals (HOMOs) and Lowest–Lying Unoccupied Molecular Orbitals (LUMOs) are named as Frontier molecular orbitals (FMOs). The energy gap between the HOMOs and LUMOs is the critical parameters in determining molecular electrical transport properties helps in the measure of electron conductivity. To understand the bonding feature of the title molecule, the plot of the Frontier orbitals, the highest occupied molecular orbital HOMO and lowest unoccupied molecular orbital LUMO as shown in Fig. 9. The HOMO shows that the charge density localized mainly on carbonyl and amine group where as LUMO is localized on ring system. Gauss-Sum 2.2 Program (Boyle et al., 2008) has been used to calculate group contributions to the molecular orbitals and prepare the density of the state (DOS) as shown in Fig. 10. The DOS spectra were created by convoluting the molecular orbital information with GAUSSIAN curves of the unit height.
By using HOMO and LUMO energy values for a molecule, the global chemical reactivity descriptors of molecules such as hardness, chemical potential, softness, electronegativity and electrophilicity index as well as local reactivity have been defined (Parr et al., 1999; Chattaraj et al., 2003; Parr et al., 1978; Parr et al., 1983; Parr et al., 1991). Pauling introduced the concept of electronegativity as the power of an atom in a molecule to attract electrons to it. Hardness (h), chemical potential () and electronegativity () and softness are defined follows.
h =
(r) =
( )
=
( )
= =
(r)
[image:14.595.40.556.381.781.2]Where E and V (r) are electronic energy and external potential of an N-electron system respectively. Softness is a property of a molecule that measures the extent of chemical reactivity. It is the reciprocal of hardness.
Table 8. Mullikan atomic charges table of N3BP2MA
Atom B3LYP/ 6-31G(2d,3p) B3LYP/6-311++G(2d,3p) Atom B3LYP/6-31G(2d,3p) B3LYP/6-311++G(2d,3p)
C 0.574488 0.308706 C -0.072493 -0.055714
C -0.388436 -0.242417 C -0.097093 -0.152704
O -0.514719 -0.385570 C -0.085224 0.006153
N -0.517390 -0.373985 Br -0.128683 0.806072
C -0.125265 0.004706 H 0.102381 0.102874
N -0.784547 -0.644055 H 0.152438 0.104554
C 0.323756 0.027718 H 0.137020 0.117897
C -0.062145 -0.240330 H 0.267451 0.231828
C 0.084416 -0.050191 H 0.196671 0.155820
C -0.130315 -0.086081 H 0.152379 0.120388
C -0.090837 -0.141734 H 0.094688 0.145239
C -0.109729 -0.109688 H 0.082121 0.135119
C -0.081236 -0.138568 H 0.087375 0.136326
C 0.295784 0.020034 H 0.128130 0.161680
S 1.288529 1.585617 H 0.131463 0.151885
O -0.528675 -0.914853 H 0.097775 0.142589
O -0.520057 -0.916191 H 0.093025 0.138166
C -0.180122 -0.861344 H 0.108150 0.151509
C -0.074685 -0.010377 H 0.180491 0.179817
C -0.086879 -0.161459
[image:14.595.42.552.382.774.2]S = h
Using Koopman’s theorem for closed-shell molecules, h, and can be defined as
h = = ( ) =
Where A and I are the ionization potential and electron affinity of the molecules respectively. The ionization energy and electron affinity can be expressed through HOMO and LUMO orbital energies as I = EHOMO and A = ELUMO. Electron affinity refers to the capability of a ligand to accept precisely one electron from a donor. The ionization potential calculated by B3LYP/6-31G(2d,3p) and B3LYP/6-311++G(2d,3p) methods for N3BP2MA is 7.8119 eV and 4.6017 eV respectively. Considering the chemical hardness, large HOMO–LUMO gap means a hard molecule and small HOMO–LUMO gap means a soft molecule.
One can also relate the stability of the molecule to hardness, which means that the molecule with least HOMO–LUMO gap means it, is more reactive. Recently Parr et al. (1999) has defined a new descriptor to quantify the global electrophilic power of the molecule as an electrophilicity index (), which defines a quantitative classification of the global electrophilic nature of a molecule Parr et al. (1999) have proposed electrophilicity index () as a measure of energy, lowering due to maximal electron flow between donor and acceptor. They defined electrophilicity index (x) as follows:
=
[image:15.595.86.516.335.654.2]Using the above equations, the chemical potential, hardness and electrophilicity index have been calculated for N3BP2MA and their values are shown in Table 9. The usefulness of this new reactivity quantity has been recently demonstrated in understanding the toxicity of various pollutants in terms of their reactivity and site selectivity (Parthasarathi et al., 2004; Parthasarathi et al., 2004; Parthasarathi et al., 2003; Irikura, 2002). The calculated value of electrophilicity index describes the biological activity of N3BP2MA.
Fig. 10. DOS spectrum of N3BP2MA
Table 9. Molecular properties of N3BP2MA
Molecular properties B3LYP Molecular properties B3LYP
6-31G(2d,3p) 6-311++G(2d,3p) 6-31G(2d,3p) 6-311++G(2d,3p) EHOMO(eV) -8.8922 -5.9628 Chemical hardness(h) 3.9046 2.3008
ELUMO(eV) -1.0830 -1.3611 Softness(S) 0.2561 0.4346
EHOMO-LUMO gap(eV) 7.8119 4.6017 Chemical potential() -4.9876 -3.6619
Ionisation potential(I)eV 8.8922 5. 9628 Electronegativity () 4.9876 3.6619 Electron affinity(A)eV 1.0830 1.3611 Electrophilicity index () 12.4380 6.7048
[image:15.595.59.543.709.782.2]Temperature dependence of thermodynamic properties
The statistical thermodynamics, like the standard thermodynamic functions such as heat capacity, entropy and enthalpy were calculated using perl script THERMO.PL (Irikura, 2002) and are listed in Table 10. As observed from the Table 7, the values of CP, H and S all increase with the increase of temperature from 100 to 1000 K, which is attributed to the enhancement of the molecular vibration as the temperature increases. The correlation equations between heat capacity (Cpm), entropy(Sm), enthalpy (Hm) changes and temperatures were fitted by quadratic formulas and the corresponding fitting factors (R2) for these thermodynamic properties are 0.9999, 0.9998 and 0.9998, respectively. The corresponding fitting equations are as follows and the correlation graphs of those shown in Fig. 11.
Som = 240.03433 + 0.7328 T -1.7943310-4 T2 (R2 = 0.9999) Copm = 15.26587+0.65639 T -2.8278610-4 T2 (R2 = 0.9998) Hom = -7.65942+0.08696 T +1.7334410-4 T2 (R2 = 0.9998)
All the thermodynamic data provide helpful information to further study of the title compounds. They compute the other
thermodynamic energies according to the relationship of thermodynamic functions and estimate directions of chemical reactions according to the second law of thermodynamics in thermo chemical field.
Notice: all thermodynamic calculations were done in gas phase and they could not be used in solution.
Conclusion
[image:16.595.101.497.75.462.2]A complete structural, thermodynamic, first-order hyperpolarizability, Mulliken population analysis, vibrational and electronic investigations of N3BP2MA have been carried out with FTIR and FT-Raman spectroscopic technique along with a DFT/B3LYP method with different basis sets. The gas phase structure and conformational properties of N3BP2MA and its conformers were determined by quantum chemical calculations. It is found that molecule has twelve conformers. The equilibrium geometries and harmonic frequencies of N3BP2MA was determined and analyzed at the DFT level utilizing B3LYP/6-31G(2d,3p) and B3LYP/6-311++G(2d,3p) basis set, giving allowance for the lone pairs through diffuse
Table 10. Thermo dynamical properties of N3BP2MA
T (K) S (J/mol.K) Cp (J/mol.K) ddH (kJ/mol)
100 430.41 417.45 154.94 151.58 9.93 9.82
200 568.21 551.11 253.92 248.41 30.37 30.03
298.15 687.99 667.28 352.53 344.88 60.14 59.46
300 690.18 669.41 354.36 346.67 60.79 60.10
400 805.25 781.01 448.10 438.38 101.02 99.88
500 914.02 886.51 527.07 515.63 149.91 148.22
600 1015.96 985.38 590.69 577.87 205.92 203.59
700 1110.99 1077.55 641.76 627.83 267.63 264.61
800 1199.49 1163.39 683.27 668.44 333.95 330.18
900 1282.00 1243.41 717.52 701.95 404.04 399.47
1000 1359.13 1318.22 746.15 729.96 477.27 471.88
functions. The difference between observed and calculated wavenumber values of the most of the fundamental modes is very small. Any discrepancy noted between the observed and the calculated vibrational band assignments may be due to the fact that the calculations have been actually done on a single molecule in the gaseous state contrary to the experimental values recorded in the presence of intermolecular interactions. The various intramolecular interactions that are responsible for the stabilization of the molecule was revealed by the natural bond orbital analysis. The lowering of HOMO and LUMO energy gap clearly explicates the charge transfer interactions taking place within the molecule.
REFERENCES
Abkowicz-Bienko A.J., Z. Latajka, D.C. Bienko, D. Michalska, Chem. Phys. (1999), 250: 123.
Andreani A., M. Granaiola, A. Leoni, A. Locatelli, R. Morigi, M. Rambaldi, G. Giorgi, L. Salvini, V. Garaliene (2001). Anticancer Drug. Des. 16, 167–174.
Becke A.D., J. Chem. Phys. 98 (1993) 5648–5652.
Chattaraj P.K., B. Maiti, U. Sarkar, J. Phys. Chem. A107 (2003) 4973–4975.
Collins G.E., L.S. Chori, J.H. Chllahan, J. Am. Chem. Soc., 1998:120;1474.
Fogarasi G., P. Pulay, J.R. Durig (Eds.), Vibrational Spectra and Structure, vol. 14, Elsevier, Amsterdam, 1985, p. 125 (Chapter 3).
Fogarasi G., X. Zhou, P.W. Taylor, P. Pulay, J. Am. Chem. Soc. 114 (1992) 8191–8201.
Frisch A., A.B. Nielson, A.J. Holder, Gaussview Users Manual, Gaussian Inc., Pittsburgh, PA, 2000. Frisch M.J., G.W. Trucks, H.B. Schlegel, G.E. Scuseria, M.A.
Robb, J.R. Cheeseman, J.A. Montgomery Jr., T. Vreven, K.N. Kudin, J.C. Burant, J.M. Millam, S.S.Iyengar, J. Tomasi, V. Barone, B. Mennucci, M. Cossi, G. Scalmani, N. Rega, G.A.Petersson, H. Nakatsuji, M. Hada, M. Ehara, K. Toyota, R. Fukuda, J. Hasegawa,M. Ishida, T. Nakajima, Y. Honda, O. Kitao, H. Nakai, M. Klene, X. Li, J.E. Knox, H.P. Hratchian, J.B. Cross, V. Bakken, C. Adamo, J. Jaramillo, R. Gomperts, R.E. Stratmann, O. Yazyev, A.J. Austin, R. Cammi, C. Pomelli, J.W. Ochterski, P.Y. Ayala, K.Morokuma, G.A. Voth, P. Salvador, J.J. Dannenberg, V.G. Zakrzewski, S. Dapprich,A.D. Daniels, M.C. Strain, O. Farkas, D.K. Malick, A.D. Rabuck, K. Raghavachari, J.B. Foresman, J.V. Ortiz, Q. Cui, A.G. Baboul, S. Clifford, J. Cioslowski, B.B. Stefanov, G. Liu, A. Liashenko, P. Piskorz, I. Komaromi, R.L. Martin, D.J. Fox, T. Keith, M.A. Al-Laham, C.Y. Peng, A. Nanayakkara, M. Challacombe, P.M.W. Gill, B. Johnson, W. Chen, M.W. Wong, C. Gonzalez, J.A. Pople Gaussian 03W Program, Gaussian Inc., Wallingford, CT, 2004.
Glendening E.D., J.K. Badenhoop, A.E. Reed, J.E. Carpenter, J.A. Bohmann, C.M.Morales, F. Weinhold, NBO 5.0, Theoretical Chemistry Institute, University of Wisconsin, Madison, 2001.
Gunasekaran S. , P. Kumaresan, K. Manoharan, S. Mohan, Asian J. Chem.(1994),6, 821- 826
Gunasekaran S., R.K. Natarajan, K. Santhosam, Asian J. Chem., 2003:15;1347
Gunasekaran S., R.K. Natarajan, R. Rathika, D. Syamala, Ind . J. Phys. 79(2005) 509- 515.
Gunasekaran S., S. Seshadri, S. Muthu, S. Kumaresan, R. Arunbalaji, Spectrochim. Acta A 70 (2008) 550-556.
Gunasekaran S., U.Ponnambalam, S. Muthu, L. Mariappan, Asian J. Phys.,(2003),16,1,51.
Irikura K.K, THERMO.PERL Script, National Institute of Standards and Technology, 2002.
Jong Rack Sohn, Won Cheon Park, Bull. Korean Chem. Soc., (2001),22,12,1297-1298.
Krishnakumar V., R. John Xavier, Indian J. Pure Appl. Phys. 41 (2003) 597–602.
Krishnakumar V., V. Balachandran, Spectrochim. Acta, A 61(2005)1811-1819.
Krishnakumar V., V.N. Prabavathi, Spectrochim. Acta, Part A 71 (2008) 449– 457.
Lee C., W. Yang, R.G. Parr, Phys. Rev. B37 (1988) 785–789. MOLVIB (V.7.0): Calculation of Harmonic Force Fields and
Vibrational Modes of Molecules, QCPE Program No. 807, 2002.
MOLVIB (V.7.0): Calculation of Harmonic Force Fields and Vibrational Modes of Molecules, QCPE Program No. 807, 2002.
Mulliken R.S., J. Chem. Phys. 23 (1955) 1833–1841.
O’ Boyle N.M., A.L. tenderholt, K.M. langer, J. Comput. Chem. 29 (2008) 839–845.
Okulik N., A.H. Jubert, Internet Electron, J. Mol. Des. 4 (2005) 17–30.
Parr R.G., L. Szentpaly, S. Liu, J. Am. Chem. Soc. 121 (1999) 1922–1924.
Parr R.G., P.K. Chattraj, J. Am. Chem. Soc. 113 (1991) 1854– 1855.
Parr R.G., R.A. Donnelly, M. Levy, W.E. Palke, J. Chem. Phys. 68 (1978) 3801–3807.
Parr R.G., R.G. Pearson, J. Am. Chem. Soc. 105 (1983) 7512– 7516.
Parthasarathi R., J. Padmanabhan, M. Elango, V. Subramanian, P. Chattaraj, Chem. Phys. Lett. 394 (2004) 225–230. Parthasarathi R., J. Padmanabhan, V. Subramanian, B. Maiti,
P. Chattaraj, Curr.Sci. 86 (2004) 535–542.
Parthasarathi R., J. Padmanabhan, V. Subramanian, U. Sarkar, B. Maiti, P.Chattaraj, Internet Electron. J. Mol. Des. 2 (2003) 798–813.
Politzer P., D.G. Truhlar (Eds.), Chemical Application of Atomic and Molecular Electrostatic Potentials, Plenum, New York, 1981.
Politzer P., J.S. Murray, Theor. Chem. Acc. 108 (2002) 134– 142.
Politzer P., P.R. Laurence, K. Jayasuriya, Molecular electrostatic potentials: an effective tool for the elucidation of biochemical phenomena, in: J. McKinney (Ed.), Structure Activity Correlation in Mechanism Studies and Predictive Toxicology, Environ. Health Perspect, vol. 61, 1985, pp. 191–202.
Pomarnacka E., I. Kozlarska-Kedra, (2003). Il Farmaco, 58, 423–429.
Pulay P., G. Fogarasi, G. Pongor, J.E. Boggs, A. Vargha, J. Am. Chem. Soc. 105 (1983) 7037–7047.
Puviarasan N., V. Arjunan, S. Mohan, Turk. J. Chem. 26 (2002) 323–334.
Ramathilagam C., P. R. Umarani, V. Saravanan, A. K. Mohanakrishnan, B. Gunasekaran V. Manivannan, Acta. Cryst.(2014). E70, o295–o296
Rauhut G., P. Pulay, J. Phys. Chem. 99 (1995) 3093–3100. Reed A.E., L.A. Curtiss, F. Weinhold, Chem. Rev. 88 (1988)
899–926.
Roggers P.G., A guide to the complete interpretation of Infrared spectra of organic structures, Wiley, Canada, 1994. Seshadri S., S. Gunasekaran, S. Muthu, J. Raman Spec,
(2009),40,639-644.
Silverstein M., G. Clayton Basseler, C. Morill, Spectrometric identification of Organic compounds, Wiley, New York, 1981.
Sing N.P., R.A. Yadav, Ind. J. Phys. 2001; B 75 (4): 347. Singh U.P., B. Sarma, P. K. Mishra, A.B. Ray, (2000). Fol.
Microbiol. 45, 173–176
Srivastava A., S.N. Pandeya, (2011). J. Curr. Pharm. Res. 1, 1– 17.
Sundius T., J. Mol. Struct. 218 (1990) 321–326. Sundius T., J. Mol. Struct. 218 (1990) 321–326. Sundius T., Vib. Spectrosc. 29 (2002) 89–95. Sundius T., Vib. Spectrosc. 29 (2002) 89–95.
Thomson H.W., P. Torkington, J. Chem. Soc. 171 (1945) 640-646.
Umadevi M., V. Saravanan, R. Yamuna, A.K. Mohanakrishnan, G. Chakkaravarthi, (2013). Acta Cryst. E69, o1784.
Varsanyi G., Assignments for Vibrational spectra of Seven Hundred Benzene derivatives, ½ Academic Kiaclo, Budapest, 1973.
Xavier J, Raja S, William S, Gunasekaran S, Orient.J Chem, 10 (1994) 3-10.
Xavier R.J., E. Gobinath, Spectrochim. Acta A 91 (2012) 248– 255.