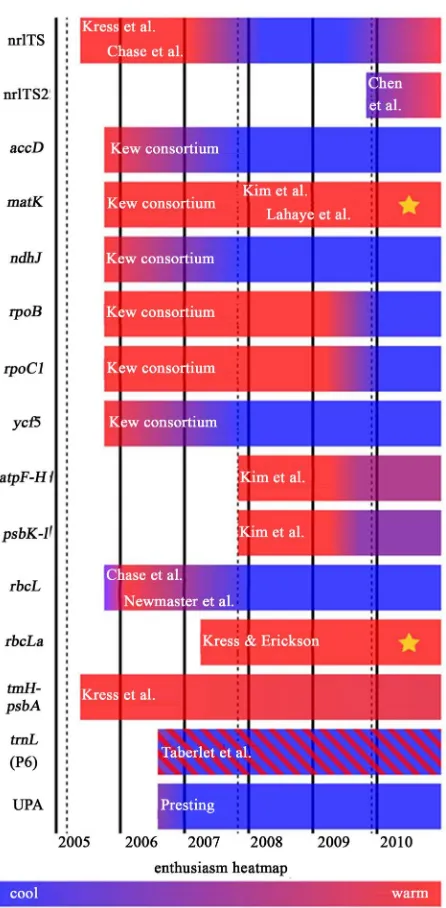
Molecular Footprint of Kenya’s Gene Bank Repositories Based on the cp Genome Signatures
Full text
Figure

![Figure 2. PCR profiles produced by matK loci [20 samples].](https://thumb-us.123doks.com/thumbv2/123dok_us/9256223.414612/14.595.234.516.603.708/figure-pcr-profiles-produced-matk-loci-samples.webp)
![Figure 5. Sequence alignment [atpF_atpH].](https://thumb-us.123doks.com/thumbv2/123dok_us/9256223.414612/15.595.72.520.68.250/figure-sequence-alignment-atpf-atph.webp)
![Figure 10. Sequence alighnment[rpoc1].](https://thumb-us.123doks.com/thumbv2/123dok_us/9256223.414612/16.595.65.536.35.741/figure-sequence-alighnment-rpoc.webp)
![Figure 11. Sequence alignment [trnH-psbA]. Legend: The conserved loci have same nucleotides [column]](https://thumb-us.123doks.com/thumbv2/123dok_us/9256223.414612/17.595.62.537.68.268/figure-sequence-alignment-trnh-legend-conserved-nucleotides-column.webp)


Related documents
Graphs showing the percentage change in epithelial expression of the pro-apoptotic markers Bad and Bak; the anti-apoptotic marker Bcl-2; the death receptor Fas; the caspase
The national health priority areas are disease prevention, mitigation and control; health education, promotion, environmental health and nutrition; governance, coord-
By formulating the video denoising problem to a low-rank matrix completion problem, our proposed algorithm does not assume any specific statistical properties
The paper assessed the challenges facing the successful operations of Public Procurement Act 2007 and the result showed that the size and complexity of public procurement,
Twenty-five percent of our respondents listed unilateral hearing loss as an indication for BAHA im- plantation, and only 17% routinely offered this treatment to children with
The hypotheses in this research are the four factors such as ease of use, preference for online social interaction (POSI), flow, and emotional lift would influence smartphone
association of hypertension and obesity with HiV and antiretroviral therapy in a rural tertiary health center in nigeria: a cross-sectional cohort study.. Olarinde Jeffrey
The errors for seasonal, interannual (5-year), and decadal periods are estimated on global and regional scales based on radial or- bit differences from three state-of-the-art
