ISSN Online: 2327-5960 ISSN Print: 2327-5952
Effects of the Strategic Values on the
Performance of Technical Training Institutions
in Meru County, Kenya
George Mungiria Muthaa
Department of Education, Chuka University, Chuka, Kenya
Abstract
Organizational performance is important in justifying its existence and re-sources allocation. To enhance performance, strategic values are useful man-agement tools to achieving competitive advantage. For Technical Training Institutions to achieve their core mandate in human resource training, the Government has emphasized on their development and implementation of strategic plans. Technical Training institutions have been operating with strategic plans for at least the last ten years; however no systematic study has been carried out to investigate the influence of their strategic values on the performance of the institutions. The current study sought to investigate the effects of the strategic values on performance in respect to enrolment, re-sources, quality and efficiency. The study used the cross sectional descriptive survey research design. The study was conducted with the top, middle and lower level management in the three Technical training institutions of Meru County. Questionnaires were used for data collection. Instruments were tested for reliability by use of the Cronbach’s alpha and a correlation coeffi-cient of 0.75 was obtained. Data was analyzed by use of both descriptive and inferential statistics and presented by use of tables and figures. The study es-tablished that the strategic values had significant influence on the perfor-mance of technical training institutional. The introduction of the government policy has a moderating variable improved the model on strategic value. The researcher recommends the alignment of the institutional philosophy to the institutional strategic values which could improve the performance of Tech-nical Training Institutions.
Keywords
Effect, Strategic Values and Performance How to cite this paper: Muthaa, G.M.
(2018) Effects of the Strategic Values on the Performance of Technical Training Institu-tions in Meru County, Kenya. Open Jour-nal of Social Sciences, 6, 1-11.
https://doi.org/10.4236/jss.2018.69001
Received: July 10, 2018 Accepted: August 27, 2018 Published: August 30, 2018
Copyright © 2018 by author and Scientific Research Publishing Inc. This work is licensed under the Creative Commons Attribution International License (CC BY 4.0).
http://creativecommons.org/licenses/by/4.0/ Open Access
1. Introduction
Organizations are developed with the objective of providing service to society. The organizations compete for resources with other sectors of the economy. The continued funding for such organizations can be justified by their performance. However, the environment is complex, turbulent and dynamic [1]. The exigen-cies in the remote and immediate environment further intensify competition for supplies and markets creating uncertainties that present opportunities, threats and constraints to firms [2]. Corporate strategy is an essential management tool to achieving a firm’s performance through strategic initiatives [3]. It’s against this backdrop that the concept of strategic plan has become popular as a man-agement’s tool not only to steer a firm’s survival but also improve performance. The desire for Strategic plans in Kenya commenced slowly and gradually back in the 1960s but has presently gaining currency and popularity [4]. The public sector finds the concept of strategic plans just as important as in commercial firms and hence Technical Training Institutions in Meru County are required to formulate strategic plans in tandem with the MoE’s strategic plan in order to foster the government’s agenda to provide trainees with the quality education and training [5]. Strategic plans are expected to positively influence performance by enhancing the financial and non-financial outcomes in the training institu-tions. This makes the strategic plans a necessary management tool for Technical Training Institutions in Meru County if these institutions are to justify their public financial support and produce graduates that help in meeting the coun-try’s development vision.
A number of scholars have argued that there is a positive correlation between strategic planning and performance while others argue that the relationship be-tween planning and performance is inconsistent and thus still debatable [6] [7] [8]. There have been studies on influence of strategic planning on performance in other education sectors. For instance, Mukokho studied the influence of stra-tegic planning on performance of public universities in Kenya, the case of uni-versity of Nairobi [9], Gode studied influence of strategic planning on the per-formance of public secondary schools in Kisumu East [10], Ayieko studied stra-tegic planning practices and performance of manufacturing firms [11]. The above studies recommended for the development of strategic plans to enhance performance in the studied sectors. A study of strategic planning and perfor-mance in public secondary schools in Rarienda District indicated the importance of strategy planning in public secondary schools and therefore suggested a repli-cation of the study in different parts of the county and other levels of edurepli-cation [12]. Despite the critical role that the Technical Training Institutions play in human resource training and the concern raised with regards to the quality of graduate, the enrolment levels and resources in these institutions, the sectors seem to have been ignored by researchers which show a knowledge gap that needs to be addressed.
One of the major influences of organizational culture is the organizational
system of values. If widely held throughout the organization, values will even-tually affect the way customers are perceived and treated, the way employees and other contributors are viewed and awarded and the way the future is anticipated and managed. Hence organizational values play a critical role in the success of an organization [13].
Organizational values define the acceptable standards which govern the beha-viour of individuals within the organization. Without such values, individuals within the organization will pursue behaviours that are in line with their own individual value systems, which may lead to behaviors that the organization doesn’t wish to encourage. Marcoulides and Heck analyzed the relationship be-tween values and performance using data collected from 26 organizations [14]. They proposed a model in which organizational culture was measured using several variables (organizational structure and organizational values) and orga-nizational performance was measured using capital, financial and market indi-cators. The results of the study showed that the variables used to measure orga-nizational culture had some effect on performance.
Peters and Waterman identified several organizational values which were re-lated to performance and excellence [15]. They studied a group of American firms which were widely recognized as being superior performers in their indus-tries for many years. Their findings indicated that excellent firm’s possess dis-tinct and identifiable organizational values which included beliefs about superior quality and services being the best. There is no available literature on the rela-tionship between values and performance of technical training institutions which gives impetus to the current study.
Research Hypotheses
HO2: There is no effect of the strategic values on the performance of Technical Training Institutions in Meru County.
2. Research Methodology
This study employed cross-sectional descriptive survey and correlational de-signs. Cross-sectional descriptive survey design was appropriate design for this study since the researcher sought to collect data on the existing phenomenon with regard to the variables of this study. The correlational design enabled the researcher to test the relationship between strategic values and performance.
The target population for the study was the 90 members of management in the three Technical Training Institutions in Meru County. All the members of management of the training institutions participated in the study. These in-cluded the top management, made up of the Principal, the two deputy Princip-als, the finance officer and the registrar, the middle level management made up of the heads of departments and the dean of students and the lower level man-agement, made up of the heads of sections.
Primary data was collected by use Questionnaires. Reliability was estimated by Cronbach’s alpha. A reliability coefficient of 0.75 was obtained which was above
0.7 considered appropriate for social studies according to [16]. Validity of the instruments was ensured by use of peers in checking the content validity. The researcher personally administered the instruments to the respondents.
The data was analysed using both descriptive and inferential statistics in Sta-tistical Package for Social Sciences (SPSS) Version 12.0 software. Descriptive sta-tistics was used to measure central tendency and dispersion. Pearson’s Product Moment Correlation (r) was derived to show the nature and strength of the rela-tionships. Adjusted R2 was used to measure the amount of variations in the de-pendent variable of change explained by the indede-pendent variable of the strategic plan. Simple regression analyse was conducted to establish the effect of the in-dependent variable on the in-dependent variable.
3. Results and Discussions
The researcher sought information on the gender of the respondents. This in-formation is shown in Figure 1.
Information in Figure 1 shows that majority (58.1%) of the respondents were of the male gender. The composition of respondents by gender shows that the institutions involved in the study satisfy the gender for one third representa-tions.
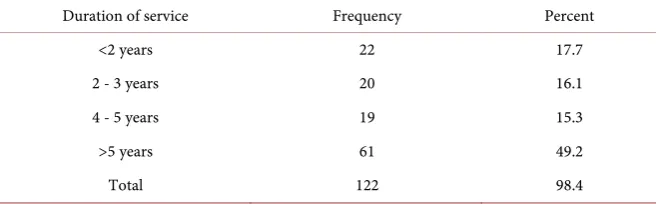
An item was included in the instruments that sought information on the du-ration that the respondent had served in their current positions. This informa-tion is presented in Table 1.
Information in Table 1 indicates that 49.2% of the respondents had served in their current position for over five years whereas 17.7% of the respondents had served for less than two years in their current positions. Having 49.2% of the respondents who had served in the institutions for more than five years means that respondents have experienced the planning and implementation of the stra-tegic plans which was critical in the current study.
The researcher sought information on the academic qualifications of the res-pondents. The responses are presented in Figure 2.
Information in Figure 2 shows that 42.7% of the respondents had a bachelor’s qualification while 32.3% had a diploma qualification.
[image:4.595.210.541.616.718.2]The researcher sought information on whether the respondents were trained on strategic planning. This information is shown in Figure 3.
Table 1. Duration served in the current position.
Duration of service Frequency Percent
<2 years 22 17.7
2 - 3 years 20 16.1
4 - 5 years 19 15.3
>5 years 61 49.2
Total 122 98.4
Figure 1. Gender of the respondents.
Figure 2. Academic qualifications of respondents.
Figure 3. Training on strategic planning.
Information in Figure 3 shows that majority (51.6%) of the respondents had some training in strategic management whereas 43.5% indicated that they had no training in strategic management. The fraction of 43.5% of the respondents who have no training in strategic management should be an issue of concern if planning and implementation of the strategic plans has to be effective.
The researcher further sought information from the respondent on their self-rating on competency in strategic planning. This information is shown in Table 2.
Information in Table 2 shows that 35.5% of the respondents rated themselves as competent while 19.4% of the respondents held no opinion on their levels of competence in strategic planning. Only 14.5% of the respondents indicated that they were very competent in strategic planning.
3.1. Descriptive Statistics
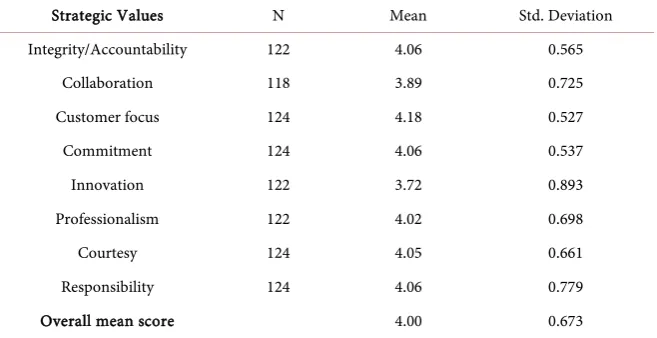
The researcher sought information on the extent to which the dimensions of the strategic values were in line with the strategic plans of the institutions. The in-formation for this article is presented in Table 3.
[image:5.595.219.381.76.169.2]Table 2. Competency level.
Responses Frequency Percent
Very competent 18 14.5
Competent 44 35.5
No Opinion 24 19.4
Incompetent 1 0.8
No response 37 29.8
Total 124 100.0
Table 3. Strategic values.
Strategic Values N Mean Std. Deviation
Integrity/Accountability 122 4.06 0.565
Collaboration 118 3.89 0.725
Customer focus 124 4.18 0.527
Commitment 124 4.06 0.537
Innovation 122 3.72 0.893
Professionalism 122 4.02 0.698
Courtesy 124 4.05 0.661
Responsibility 124 4.06 0.779
Overall mean score 4.00 0.673
Information in Table 3 yielded an overall mean of 4.00. Customer focus di-mension of the strategic values in the strategic plan had the highest mean score (mean score = 4.18, SD = 0.527). This shows that respondents rated the dimen-sion of customer focus has having the highest alignment to the organization strategic values. The dimensions that attained the lowest mean score where in-novative (mean score = 3.72, SD = 0.893) and collaboration (mean score = 3.89, SD = 0.725) in relation to all the other dimensions of the strategic values in the strategic plan. This implies that the perception of the managers on innovations and collaborations has to be emphasized as a necessary condition in the promo-tion of the institupromo-tions’ strategic values for the strategic plans.
The researcher sought information on the extent to which the Government policy being a moderator variable impacted on the institutions’ strategic plan. This information is shown in Table 4.
Information in Table 4 shows that the government policy impacted to a great extent on the strategic plans. Accountability (mean score = 3.98, SD = 0.966) and Regulatory quality (mean score = 3.97, SD = 0.852) were most important in the institutions strategic plans. Effectiveness (mean score = 3.82, SD = 0.869) and stability (mean score = 3.84, SD = 0.879) were rated least important in the stra-tegic plans.
To achieve the objectives of the study, the researcher sought information on
[image:6.595.211.540.242.411.2]Table 4. Government policy.
Government Policy N Mean Std. Deviation
Accountability 122 3.98 0.966
stability 120 3.84 0.879
Effectiveness 120 3.82 0.869
Regulatory quality 122 3.97 0.852
Rule of law 122 3.95 0.822
Control of corruption 122 3.90 0.885
Overall mean score 3.91 0.879
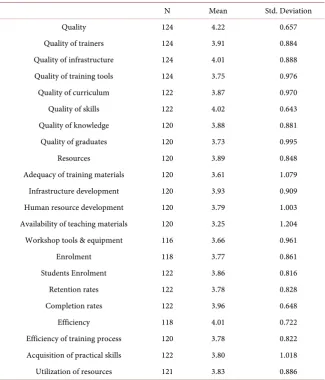
the performance of technical training institutions. Various indicators were used to assess the extent of performance by the Technical Training Institutions. This information is shown in Table 5.
The results in Table 5 reveal four indicators of performance in technical in-stitutions with a mean of above 4.00. Quality (mean score = 4.22, SD = 0.657), quality of skills (mean score = 4.02, SD = 0.643), quality of infrastructure (mean score = 4.01, SD = 0.888) and efficiency (mean score = 4.01, SD = 0.722) were rated most important dimensions of performance in the technical training insti-tutions. Availability of teaching materials (mean score = 3.25, SD = 1.204) was rated least among the various indicators of performance in the technical training institutions.
3.2. Regression Analysis and Hypotheses Testing
The hypothesis of the study sought to investigate the relationship between the strategic values and the performance of the training institutions. This informa-tion is presented in Table 6.
Results in Table 6 show the relationship between strategic Values and per-formance. From the model 20.9% of the variation in performance can be ac-counted for by the strategic values in the model. The F-statistics of 32.3 (p-value 0.00 < 0.05) indicates that the overall model was statistically significant at 95% confidence level. The relationship between strategic Values and performance was statistically significant (t = 5.683, p-value 0.00 < 0.05). This implies that for one unit increase in strategic Values the performance will increase by a factor of 0.557. The hypothesis that there was no significant relationship between strategic values and performance was not supported in the current study. The predictive regression model can be stated as:
Y = 1.558 + 0. 557X2
where Y—Performance, X2—Strategic Values, 1.558—Constant, 0. 557—Is the estimate of the expected change in performance, when strategic value is in-creased by one unit.
These results are in harmony with the findings that Values are the fundamen-tal principles that organizations and people stand for along with the mission and
Table 5. Performance.
N Mean Std. Deviation
Quality 124 4.22 0.657
Quality of trainers 124 3.91 0.884
Quality of infrastructure 124 4.01 0.888
Quality of training tools 124 3.75 0.976
Quality of curriculum 122 3.87 0.970
Quality of skills 122 4.02 0.643
Quality of knowledge 120 3.88 0.881
Quality of graduates 120 3.73 0.995
Resources 120 3.89 0.848
Adequacy of training materials 120 3.61 1.079
Infrastructure development 120 3.93 0.909
Human resource development 120 3.79 1.003
Availability of teaching materials 120 3.25 1.204
Workshop tools & equipment 116 3.66 0.961
Enrolment 118 3.77 0.861
Students Enrolment 122 3.86 0.816
Retention rates 122 3.78 0.828
Completion rates 122 3.96 0.648
Efficiency 118 4.01 0.722
Efficiency of training process 120 3.78 0.822
Acquisition of practical skills 122 3.80 1.018
Utilization of resources 121 3.83 0.886
Table 6. Regression analysis on strategic values and performance.
Unstandardized Coefficients Standardized Coefficients
t Sig.
B Std. Error Beta
(Constant) 1.558 0.395 3.946 0.000
strategic Values 0.557 0.098 0.458 5.683 0.000
R square = 20.9%, F-Statistic = 32.3 (0.000 < 0.05).
vision, they make an organization unique. Thompson, Strickland & Gamble have given the meaning of organizational values as “company’s values are the beliefs, business principles, and practices that guide the conduct of its business, the pursuit of its strategic vision, and the behaviour of company personnel” [17]. Values relate to such things as treatment of employees and customers, integrity, ethics, innovativeness, emphasis on quality or service, social responsibility, and community citizenship. Values play a critical role in influencing the perfor-mance in organizations [18].
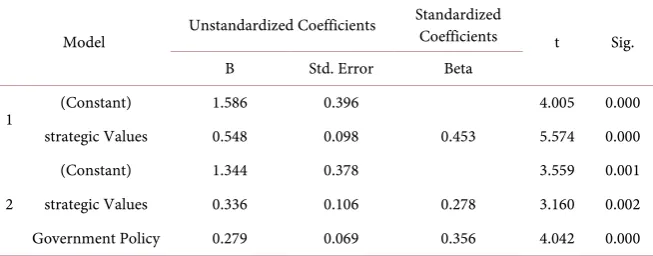
[image:8.595.208.539.502.576.2]Table 7. Regression result of the strategic values with government policy.
Model Unstandardized Coefficients
Standardized
Coefficients t Sig.
B Std. Error Beta
1 (Constant) 1.586 0.396 4.005 0.000
strategic Values 0.548 0.098 0.453 5.574 0.000
2
(Constant) 1.344 0.378 3.559 0.001
strategic Values 0.336 0.106 0.278 3.160 0.002
Government Policy 0.279 0.069 0.356 4.042 0.000
1) R squared = 0.208, F-statistic = 31.065 (0.000); 2) R squared = 0.302, F-statistic = 25.686 (0.000).
The researcher sought information on the implications of the strategic value with the moderator variable of the government policy. This information is shown in Table 7.
The results presented in Table 7 indicate a significant change in the percen-tage of the variation explained by the interaction of the strategic values and the government policy. The regression results shows a change in R2 when interac-tion of government policy and strategic values were introduced (0.208, 0.302). Results suggest that the variation in the relationship between strategic values and performance of technical training institutions on introduction of the govern-ment policy was statistically significant (0.336, 0.279; 0.002, 0.000). This implies that in the presence of the government policy the relationship is enhanced such that the performance is slightly higher. This means that the influence of the strategic values on performance of technical training institutions is substantially altered by the government policy. Based on these results the performance can be predicted as follows:
Y = 1.344 + 0.336X2 + 0.279M
where Y = performance of technical training institutions, X2 = Strategic values, M = Government policy.
4. Conclusion
Judging from the findings resulting from the data collected for this study, the results reveal some vital facts upon which the conclusions are based. The study showed that strategic values had significant influence on the performance of Technical Training Institutions in Meru County. Customer focus dimension of the strategic values in the strategic plan had the highest influence compared to innovative and the collaboration dimensions which had the lowest mean score in relation to all the other dimensions of the strategic values in the strategic plan.
5. Recommendations
Based on the findings of the current study, the researcher made the following recommendations:
1) There is need for the institutional managers to align the institutional phi-losophy and the priorities to the institutional strategic values.
2) There is need for innovations and collaborations to be emphasized as a ne-cessary condition in the promotion of the institutions’ strategic values thereby enhancing the performance of Technical Training Institutions.
Conflicts of Interest
The authors declare no conflicts of interest regarding the publication of this paper.
References
[1] Johnson, S. and Whittington, R. (2008) Exploring Corporate Strategy. 6th Edition, Text and Cas-s Pearson Education Ltd., New Delhi.
[2] Barney, J.B. (2007) Gaining and Sustaining Competitive Advantage. 3rd Edition, Pearson Hall, New Jersey.
[3] Porter, M.E. (1985) Competitive Advantage: Creating and Sustaining Superior Per-formance. Free Press, New York.
[4] Yabs, J. (2007) Strategic Management Practices in Kenya. Lelax Global Ltd, Nairobi. [5] Birgen, P. (2007) Strategic Plan: How to Develop a Strategic Plan. Colour Print Ltd,
Nairobi.
[6] Cole, G. A. (2004) Management Theory and Practice. 6th Edition, Thomson Learn-ing Bedford Row, London.
[7] Ansoff, I.H. (1990) Implanting Strategic Management. Prentice Hall International Ltd., London.
[8] Thompson, J., Strickland, A. and Gamble, J.E. (2007) Crafting and Executing Strat-egy: Texts and Readings. The McGraw-Hill, New York.
[9] Muthoko, A.A. (2010) The Influence of Strategic Planning on Performance of Pub-lic Universities in Kenya: The Case of University of Nairobi. Unpublished Master’s Thesis, University of Nairobi, Nairobi.
[10] Gode, H. (2009) Influence of Strategic Planning on Performance of Public Second-ary Schools in Kisumu East. Unpublished MBA Project, University of Nairobi: Nai-robi.
[11] Ayieko, M.O. (2009) Strategic Planning Practices and Performance of Large Manu-facturing Firms in Kisumu, Kenya. Master of Business Administration, School of Business, University of Nairobi, Nairobi.
[12] Okwako, A.D. (2013) Strategic Planning and Performance of Public Secondary Schools in Rarieda District, Kenya. Masters in Business Administration, University of Nairobi, Nairobi.
[13] Boxx, W.R., Odom, R.Y. and Dunn, M.G. (1991) Organizational Values and Value Congruency and Their Impact on Satisfaction, Commitment and Cohesion: An Empirical Examination within the Public Sector. Public Personnel Management, 20, 195-205. https://doi.org/10.1177/009102609102000207
[14] Marcoulides, G. and Heck, R. (1993) Organizational Culture and Performance: Proposing and Testing a Model. Organization Science, 4, 209-225.
https://doi.org/10.1287/orsc.4.2.209
[15] Peters, T.J. and Waterman, R.H. (1982) In Search of Excellence. Harper Collins, New York.
[16] Kathuri, N. and Pals, D. (2003) Introduction to Educational Research. Egerton University, Njoro.
[17] Thompson, S. (2005) Strategy Formulation and Implementation. Richard D. Irwin, Boston.
[18] Singh, R.G. and Shah, K. (2012) Directional Strategies and Organizational Perfor-mance. https://www.inflibnet.ac.in/ojs/index.php/MC/article/download/3116/2416