Synthesis of mesoporous ceria using metal- and
halogen-free ordered mesoporous carbon as a hard
template
†
Farzeen Sakina,aJuan Manuel Munoz-Oca˜ na,˜ bAinuona Bouziane,cMiguel
Lopez-Haro cand Richard T. Baker *a
Ordered mesoporous cerias were synthesised by employing metal- and halogen-free ordered mesoporous carbons (OMCs) as the hard templates in a‘nanocasting’procedure. TEM, small angle (SA) and wide angle (WA) XRD, and N2physisorption analyses were used to characterise the templates, intermediates and ceria products and electron tomography (STEM-HAADF) was used to explore the 3D morphology of the ceria nanostructures grown within the carbon templates. This allowed the relationships between the structures of the OMC templates and the products to be considered in detail as two parameters were varied. These were: the method of impregnation of the ceria precursor; and the temperature of calcination of the OMC template. Of the four impregnation methods tested, the solid–liquid method was found to be the most successful. This gave a high quality product with the highest yield of uniform mesopores, and crystalline nanorods of ceria arrayed in clear long-range order, as viewed by TEM and determined in SA and WAXRD. The specific surface area and pore volume exhibited by this sample were 111 m2 g1 and 0.39 cm3 g1, respectively. 3D electron tomography reconstructions revealed the presence of a network of ordered, nanoscale, rod-like structures interlinked in a complex fashion. The effect of calcination temperature of the template on uptake of the ceria precursor during impregnation was studied by calcining OMCs at temperatures from 350 to 800C and using these as hard templates for the nanocasting of ceria. Of these, the carbon template calcined at 400C gave the highest quality product.
1.
Introduction
Since the discovery of the rst ordered mesoporous silica, MCM-41, the number of scientic studies on the synthesis, characterisation and application of ordered mesoporous metal oxides has increased strongly and continuously.1–6Because of
their very high specic surface area, large pore volume and adjustable pore size these materials are of great interest for various applications such as in catalysis and adsorption and separation processes.7 Mesoporous metal oxides may be
syn-thesised using sotemplating or hard templating–or“ nano-casting” –methods.5Sotemplating typically involves the
self-assembly of ordered arrays of surfactant micelles in a solution of a metal ion followed by calcination to remove the organics
and leave an ordered mesoporous metal oxide.5,8Although the
sotemplating method has been very successful in the prepa-ration of highly ordered mesoporous silicas (SBA-15, KIT-6, FDU-12 and SBA-16etc.) and carbon materials (14, FDU-15 and FDU-16 etc.), the synthesis of mesoporous forms of many metal oxide compositions is oen not possible because of their thermal instability during the removal of the template.7,9
Furthermore, mesoporous metal oxides synthesised using the sotemplate method may suffer from amorphous (rather than crystalline) material in the pore walls and poor mesostructures, resulting in thermal and mechanical instability, which is undesirable in most applications, such as in catalysis.7,10 The
so-templating method can also give rise to materials con-taining macroscopic, or grain, heterogeneities.11For example,
SBA-type materials such as SBA-15 show worm-like phases as well as the desired phase containing hexagonally-ordered channels. Materials made using nanocasting are reported not to contain such heterogeneities even when they are not highly ordered.11Lastly, it is oen difficult to remove the silica
mate-rial entirely from the product, especially if it is also an oxide, such as zirconia.12The use of carbon-based templates, which
can be completely removed by combustion, is therefore an attractive alternative strategy.
aEaStChem School of Chemistry, University of St Andrews, St Andrews, Fife, KY16 9ST,
UK. E-mail: rtb5@st-andrews.ac.uk; Tel: +44 (0)1334 463899
bDepartamento de Estad´ıstica e Investigaci´on Operativa, Facultad de Ciencias,
Universidad de C´adiz, Campus Rio San Pedro, Puerto Real, C´adiz, 11510, Spain
cDepartamento de Ciencias de los Materiales e Ingenier´ıa Metal´urgica y Qu´ımica
Inorg´anica, Facultad de Ciencias, Universidad de C´adiz, Campus Rio San Pedro, Puerto Real, C´adiz, 11510, Spain
†Electronic supplementary information (ESI) available. See DOI: 10.1039/c9na00482c
Cite this:DOI: 10.1039/c9na00482c
Received 6th August 2019 Accepted 28th October 2019
DOI: 10.1039/c9na00482c
rsc.li/nanoscale-advances
Advances
PAPER
Open Access Article. Published on 29 October 2019. Downloaded on 11/4/2019 9:08:04 AM.
This article is licensed under a
Creative Commons Attribution-NonCommercial 3.0 Unported Licence.
View Article Online
In hard templating, an already-prepared mesoporous mate-rial, such as mesoporous silica or carbon, is used as a template to form other useful mesoporous materials. The pores of the hard template are impregnated with a precursor of the desired
nal material using one of a number of impregnation methods including incipient wetness (IW), immersion of the template in bulk solution and the so-called solid–liquid (SL) method. Aer impregnation, the precursor is thermally decomposed to form the respective metal oxide.9The hard template is then removed
by dissolution or combustion, to yield the desired mesoporous metal oxide, whose structure is an inverse replica of that of the template.9Highly ordered mesoporous metal oxides with
crys-talline wall material and having thermal stability can be syn-thesised using this method.9,10,13,14
Cerium oxide has been widely investigated because of its catalytic activity and oxygen storage and release ability.15It is
used in three-way automobile exhaust catalysts, in the catalytic combustion of various hydrocarbons and for removing organics from polluted water7,10,15–19It is clear that the catalytic activity of
ceria-based materials might be enhanced by preparing it in mesoporous form with a uniform pore structure.15
Ryoo and Laharst reported the synthesis of highly ordered mesoporous CeO2 using SBA 15 and KIT-6 as the hard
templates, CeCl3$7H2O as the ceria precursor and the IW
method of impregnation. The mesoporous CeO2 product
ob-tained had uniform pore sizes with nanocrystalline pore walls and exhibited high thermal stability, even at 700 C.5,15Shen
et al.made mesoporous CeO2using KIT-6 as the hard template
and Ce(NO3)3$6H2O as the ceria precursor and used it to
support CuO for the catalytic oxidation of CO.10Jiet al.used
MCM-48 withIa3dsymmetry as the hard template to prepare mesoporous ceria which showed a blue shi in UV-visible absorbance and was found to have a high concentration of surface oxygen vacancies. This material showed better photo-catalytic activity for the decomposition of acid orange 7 (a non-biodegradable azo dye and target contaminant) than corre-sponding nonporous analogues and standard TiO2 reference
materials.20 Wang et al. used two different kinds of silica
templates, SBA-15 rods and spheres, to synthesised mesoporous CeO2 with different morphologies, such as micrometre-sized
rod, hollow sphere, solid sphere and saucer-like structures, by carefully controlling the loading of the precursor. According to the authors, these differences in the textural properties of the mesoporous products when prepared using the same template could be attributed to the properties of the metal precursors and the interaction between the metal oxide and silica.7 Yue
et al.prepared single crystal mesoporous ceria by using SBA-15, KIT-6,21FDU-12 and SBA-169,14using the SL method for in
l-tration of the precursors. Tiemann et al. synthesised meso-porous ceria with crystalline walls using the mesomeso-porous carbon, CMK-3, as the hard template and the IW method for impregnation of the ceria precursor, which was Ce(NO3)3$6H2O.
The resulting product was used as a catalyst for decomposition of methanol.5,22Wencui and co-workers prepared mesoporous
ceria using CMK-3 as the hard template and used it as a support for the preparation of gold catalysts by the colloid deposition method. The authors found enhanced catalytic activity of Au/
CeO2 catalyst for CO oxidation.23Garcia and co-workers used
mesoporous ceria templated from KIT-6 as a catalyst for total oxidation of naphthalene.24 Recently, Solsona and coworkers
tested the catalytic activity of mesoporous CeO2and Cu-loaded
CeO2made using several methods, including nanocasting from
CMK-3, for total oxidation of propane.25
Herein we report synthesis of ordered mesoporous CeO2
using as the hard template a metal- and halogen-free ordered mesoporous carbon (OMC) with a 2-D hexagonal arrangement of pores prepared as part of a previous study.26The avoidance of
metal and halogen species – oen used in the conventional preparation of OMCs–is an important benet since otherwise these can persist in thenal product and act as catalyst poisons. We believe that this method could be used generally to prepare products of a wide range of compositions. An important requirement for nanocasting is the successful lling of the pores of the template with the precursor. To nd the best conditions for this, two parameters were varied in this research. First, the effect of impregnation method was studied by testing four different methods: incipient wetness impregnation (IW), concentrated solution (CS), dilute solution (DS) and SL methods. Second, the chemical nature of the carbon template itself – and importantly of the pore walls – was modied by calcining the templates at different temperatures, Tcalc. The
ceria precursor used in all experiments was Ce(NO3)3$6H2O.
2.
Experimental
2.1 Synthesis of the standard mesoporous carbon template
The 2D hexagonal OMC hard templates were prepared using a two phase method with the reagents in the molar ratios: resorcinol (R) : formaldehyde (F) : Pluronic F127 (a block copolymer) : NH4
-OH : oxalic acid ¼ 1 : 1.39 : 0.00635 : 0.01 : 0.125. In a typical procedure, a precursor solution of resorcinol and formaldehyde was made by mixing 2.20 g of resorcinol with 2.26 g of 37 wt% formaldehyde solution for 1 h at 35C. 2 ml of 0.1 M NH4OH was
added and the solution was stirred for a further 1 h to obtain the RF resol. This was cooled to 18C for 10 min and was mixed with a solution containing 1.60 g of F127, 8 g of water and 10 g of ethanol for 20 min and 0.225 g of oxalic acid was added with continuous stirring. Aer 5–10 min, the clear solution became cloudy indicating phase separation. Aer constant stirring for a further 1 h, the mixture was lestanding overnight to obtain the polymer gel phase. This polymer gel was dried for at least 12 h at room temperature and cured at 80 C for 24 h. The resultant material wasnally calcined at 400C for 3 h with a heating rate of 1C min1under N2atmosphere (100 cm3min1) to obtain the
standard OMC template. Full preparation and characterisation details of this and related materials are available elsewhere.26
2.2 Synthesis of mesoporous ceria
2.2.1 Impregnation methods
2.2.1.1 Solid–liquid method (SL).2 g of the standard carbon template (calcined at 400C) was ground with Ce(NO3)3$6H2O
powder in a pestle and mortar for about 10 min. The volume of Ce(NO3)3$6H2O used was equal to the pore volume of the
Open Access Article. Published on 29 October 2019. Downloaded on 11/4/2019 9:08:04 AM.
This article is licensed under a
carbon template used. In the literature, this is called the solid– liquid (SL) method because the nitrate melts in the subsequent heating step (Section 2.1.2) and so is able to enter the meso-pores of the template.21
2.2.1.2 Incipient wetness method (IW).A saturated solution in ethanol containing Ce(NO3)3$6H2O which, when crystallised,
would have a volume equal to the pore volume of ordered mesoporous carbon used, was added stepwise to 2 g of the standard OMC template. In each step, precursor solution was added dropwise and mixed thoroughly. The whole process took about 1 h aer which the sample was leto dry overnight at room temperature.
2.2.1.3 Concentrated solution method (CS). In this method, 2 g of the standard carbon template was mixed with 10 ml of 2 M Ce(NO3)3$6H2O in ethanol and stirred for 24 h in a centrifuge
tube. The excess Ce (NO3)3$6H2O solution was then removed by
centrifugation and the product dried at room temperature overnight.
2.2.1.4 Dilute solution method (DS). An amount of Ce (NO3)3$6H2O equal in volume–when crystallised–to the pore
volume of the carbon template was dissolved in 20 ml of ethanol in a small beaker. 2 g of the standard carbon template was added and the mixture was stirred at 60C on a hotplate until the ethanol had evaporated and the sample was leto dry at room temperature overnight.
2.2.2 Calcination. Aer each impregnation method, all
samples were heated to 200C in air at a rate of 1C min1, kept at this temperature for 2 h then allowed to cool. A portion of each of these samples (denoted Intermediate Products, “IP”) were kept separate for characterisation while the remainder was calcinedrst at 320C for 3 h (heating rate of 1C min1) and then at 530C for 1 h (ramp rate of 1C min1) to give thenal ceria products (denoted as“Ceria”s). The IPs and ceria products are named according to the impregnation method used in their preparation, SL-IP, SL-Ceriaetc.
2.2.3 Variation of the calcination temperature of the OMC
template. In addition to the ceria materials made using the
standard template, the SL method was employed to prepare mesoporous ceria products using carbon templates prepared as in Section 2.1 but calcined at a series of temperatures,Tcalc¼
350C, 400C, 500C, 600C and 800C. All other preparation conditions were unchanged.
2.3 Characterisation
Small angle (2q¼0.5 to 5, SA) and wide angle (2q¼10 to 90, WA) powder X-ray diffraction (XRD) patterns were recorded using a Panalytical Empyrean diffractometer in reectance geometry using Cu Ka radiation for 1 h with a step size of 0.017. Transmission Electron Microscopy (TEM) was per-formed on a JEOL JEM 2011 instrument operating with a LaB6
lament at an accelerating voltage of 200 kV. TEM samples were prepared by suspending ground mesoporous samples in acetone by ultrasonication for 1 min, sweeping a 300-mesh holey carbon TEM grid through the suspension and allowing this to dry under a halogen lamp overnight. Electron Tomog-raphy (ET) experiments were performed in an
aberration-corrected FEI Titan3 Themis 60-300 microscope working in the scanning transmission mode (STEM) at 200 kV. Experi-mental High Angle Annular Dark Field (HAADF) image series were acquired in the70to +70tilt angle range, with 5steps. A convergence angle of 9 mrad was selected in order to improve the depth of focus and a camera length of 115 mm was used. The ET series acquisition was done automatically using the FEI Explore3D v.4.1.2 soware. To denoise the tilt series, home-made scripts coded in MATLAB were used based on the WAVELAB850 toolbox (http://statweb.stanford.edu/wavelab/ Wavelab_850/index_wavelab850.html) and theinvanscpackage downloaded from http://www.cs.tut./foi/invansc/. The whole set of HAADF- STEM denoised images were aligned by combining a cross-correlation method, using FEI Inspect3D v 3.0 and the landmark-based alignment implemented in TomoJ.27 The tilt series images were also background
sub-tracted. Aerwards, they were reconstructed into a 3D volume using a compressed sensing algorithm based on minimization of the total variation in 3D (TVM3D) of the whole set of HAADF-STEM images. In particular, an implementation of the TVAL3D routine using the ASTRA tomography toolbox28was employed.
For visualisation and further nanometrological analysis of the reconstructed volumes, the FEI Avizo Fire Soware was used. Segmentation of the reconstructed volumes was performed by a home-developed routine programmed in MATLAB as described in ref. 29.
Gas physisorption analysis was conducted at 77 K on the template and intermediate and nal ceria products using a Micrometrics TriStar II 3020 using liquid N2. Samples were
degassed at 120 C under vacuum for at least 12 h prior to analysis. Micrometrics soware was used to calculate Bru-nauer–Emmett–Teller (BET) specic surface areas (SSAs) and the Barrett, Joyner and Halenda (BJH) pore size distribution from the adsorption branches of the isotherms. The FT-IR experiments were carried out using a Shimadzu IRAffinity-1S Fourier transform infrared spectrophotometer with high-performance LabSolutions IR soware. The spectra were recorded from 4000 to 400 cm1. A background spectrum was taken before each measurement.
3.
Results and discussion
3.1 Impregnation method
Table 1 shows the SSA and pore volume of the intermediate products, SL-IP, IW-IP, DS-IP and CS-IP. In these, the ceria is expected to have formed in the pores of the OMC template but the template is expected still to be present, having not yet been removed by combustion at the higher temperature treatments of 320C/3 h and 530C/1 h in air. The fact that the lowest SSA and pore volume was for CS-IP indicates the highest degree of porelling in this sample. The other three samples showed broadly similar pore volume and SSA values to each other, which indicates a similar loading of CeO2in these samples. The
fact that the values ofDP(Table 1) are slightly smaller in the IP
samples than in the parent template may be a consequence of the partiallling of some pores, with material lining the pore walls but leaving a smaller cavity along the pore axis.
Open Access Article. Published on 29 October 2019. Downloaded on 11/4/2019 9:08:04 AM.
This article is licensed under a
Aer the removal of carbon template, the resulting ceria products were subjected to physisorption, XRD and TEM anal-ysis. Results for the IP samples, before template removal, are given in Fig. S1 and S2 (in ESI†) and results for the ceria prod-ucts, aer template removal are presented in Fig. 1–3 and in Table 1. Fig. 1 shows the N2adsorption isotherms and pore size
distributions of SL-Ceria, IW-Ceria, DS-Ceria and CS-Ceria. The isotherm of SL-Ceria shows a typical Type IV shape with a Type H1 hysteresis loop at relative pressureca.0.65–0.8 indicating the presence of regular mesopores. The uptake at relative pressure 0.8–1.0 indicates inter-particle porosity.22The pore size
distribution of this sample conrms the presence of both uniform mesopores and inter-particle voids, respectively, by showing a relatively large peak centred at aDPof around 8.8 nm followed by a broad peak at larger pore size.21The isotherms of
DS-Ceria and CS-Ceria are typical of Type IV with hysteresis loops intermediate between Type H1 and Type H3. Pore size distributions show maxima at 12.4 nm and 8.9 nm, respectively, for DS-Ceria and CS-Ceria followed by broad peaks at higher pore size corresponding to inter-particle voids. In the case of IW-Ceria, the two hysteresis loops were not so obvious. The corresponding pore size distribution has a maximum at 10.4 nm followed by a broader feature at larger diameters. The
rst peak, which corresponds to the presence of uniform mes-opores, is much smaller for DS-, CS- and IW-Ceria than for the SL-Ceria. These results indicate that the SL method gave rise to the best yield of mesoporous product.
It should be noted that the values ofDP(Table 1) for the ceria products are not directly comparable with those of the IP materials or the parent OMC template since, in the latter,DP
relates to cylindrical pores whereas in the ceria products the pores are the spacesbetweenordered cylindrical ceria nanorods and hence are not cylindrical pores themselves.
The SSAs and pore volumes of all these samples and for the carbon template are given in Table 1. It can be seen that all mesoporous ceria samples had much lower values of SSA and pore volume than their parent carbon template. This is mainly due to the large difference in the densities of CeO2(7.22 g cm3)
and carbon (2.26 g cm3).22The values for the SSA and the pore
[image:4.595.43.558.567.692.2]volume were 107–125 m2 g1 and 0.35–0.41 cm3 g1,
Table 1 Textural parameters of samples made using SL, IW, DS and CS methodsa
Sample ID SSA (m2g1)
VP (cm3g1)
Vmicro
(cm3g1) D
P(nm) a(nm) DXRD(nm) DR(nm)
Template 614 0.67 0.04 7.3 13.7
SL-IP 300 0.28 0.03 6.8 6.3
IW-IP 316 0.26 0.04 6.9 6.1
DS-IP 336 0.27 0.05 6.7 6.4
CS-IP 249 0.20 0.04 6.5 6.4
SL-Ceria 111 0.39 0.01 8.9 12.6 9.0 7.9
IW-Ceria 125 0.41 0.01 10.4 8.0 8.1
DS-Ceria 124 0.40 0.01 12.4 8.4 7.5
CS-Ceria 107 0.35 0.01 8.9 8.7 7.9
aSSA: specic surface area;V
P: pore volume;Vmicro: micropore volume;DP: pore diameter at maxima of pore size distribution (all from gas physisorption experiments);a: unit cell parameter¼(2d100/O3);DXRD: crystallite size calculated from peak (111) in WAXRD;DR: rod diameter from TEM.
Fig. 1 Nitrogen physisorption isotherms (a) and pore size distributions (b) of SL-Ceria, IW-Ceria, CS-Ceria and DS-Ceria. The isotherms of IW-Ceria, CS-Ceria, the carbon template and DS-Ceria are off-set vertically by 100, 200, 250 and 300 cm3g1, respectively. In (b) the values for the carbon template are divided by 5 for clarity.
Open Access Article. Published on 29 October 2019. Downloaded on 11/4/2019 9:08:04 AM.
This article is licensed under a
respectively. The values of SSA were less than, while the values for pore volume were comparable to, the corresponding values of SSA (148 m2g1) and pore volume (0.42 cm3g1) of meso-porous ceria made using a CMK-3 template by Tiemann and co-workers.22
The TEM analysis conrms the presence of mesostructure having long range order in the ceria samples made by all four impregnation methods. 2-D hexagonally-ordered arrays of rod-like nanostructures were found distributed throughout each sample, and this was especially marked in the case of SL-Ceria. Fig. 2 shows representative TEM images of SL-Ceria, DS-Ceria, SL-Ceria and IW-Ceria viewed along the [110] direction and of
CS-Ceria viewed along the [001] direction of the 2D hexagonal mesostructure. The images of the CS-Ceria sample and the inset Digital Diffraction Pattern (DDP) clearly show the hexagonal arrangement of ceria rods. This–and the similarity in diameter of the pores in the template and the rods in the ceria product (DPandDR, respectively, in Table 1)–conrms that the ceria materials are indeed inverse replicas of the hexagonal OMC template. The structure of the template is described extensively elsewhere.26Although most of the particles in all four samples
contained a uniform arrangement of nanorods, discontinuities in rod formation were observed occasionally in the cases of all four samples. Crystal lattice planes at spacings consistent with
Fig. 2 Intermediate and high magnification TEM images of: (a–c) SL-Ceria; (d and e) IW-Ceria; (f and g) DS-Ceria; (all viewed along the [110] direction) and (h and i) CS-Ceria (viewed along the [001] direction of the mesopore structure) with DDP of the mesopore structure inset. The DDPs of the regions indicated in (c) can be indexed to the crystal lattice of ceria viewed along the [112] zone axis and are aligned, showing that relatively long-range order is present in the nanorods. Further high resolution images of CS-Ceria are given in Fig. 9.
Open Access Article. Published on 29 October 2019. Downloaded on 11/4/2019 9:08:04 AM.
This article is licensed under a
[image:5.595.70.527.49.497.2]those of ceria are visible in the high magnication images shown in Fig. 2c, e and g and reveal the crystalline nature of these materials. DDPs were obtained from two regions of the same nanorod in Fig. 2c. These diffraction patterns can be indexed to the cubic ceria lattice viewed along the [112] zone axis and are aligned, the spots being in the same angular orientation. This shows that single crystalline regions can extend over relatively large distances within the nanorods. The average ceria rod diameters for all samples are given in Table 1 and are seen to be slightly larger–at 7.5 to 8.1 nm–than the pore diameter of the carbon template (7.3 nm) used. This indicates that the ceria nanorods grew in diameter during or aer the removal of the carbon template, when they were exposed to high temperatures and oxidising conditions.
In the SAXRD patterns, the SL-Ceria shows a peak around 2q
¼0.8which could be indexed as the reection from the (100) planes (withd10010.9 nm) of the 2-D hexagonal mesoporous structure. The unit cell parameter was calculated to be 12.6 nm which is less than that of the carbon template (13.7 nm). This indicates that shrinkage of the unit cell occurred on going from template to product. The other three samples show less clear indications of a similar peak.
[image:6.595.332.520.48.289.2]The WAXRD analysis showed that all four ceria samples are single phase ceria with theuorite structure (Fm3m, ICDD 43-1002) (Fig. 3) with the expected unit cell dimension5.42˚A (see Table S1 in ESI†). The peaks are broad and the crystallite sizes
could be calculated using Scherrer's formula (Table 1), as they also were for the IP samples (patterns not shown). Crystallite sizes were generally smaller in the IP samples–when the carbon template was still present–than in the ceria products, in which the template had been removed. This indicates that the ceria nanocrystals underwent thermally-activated growth during or aer template removal. This result corresponds well with the
nding from TEM that the diameters of the ceria nanorods were generally slightly larger than the pores of the carbon template in which they nucleated and began to form.
The FT-IR patterns of the ceria products are similar to those of a non-mesoporous ceria sample (Fig. 4 and Table 2) except that water peaks between 3100–3600 cm1 and around 1640 cm1,30–34are absent in SL-Ceria and DS-Ceria. The peaks
around 1540 and 1050 cm1 are in the region reported to correspond to carbonate surface species (1540 to 1040 cm1)31–
which form on ceria from the air – and the peak at around 1300 cm1may also be a carbonate peak or may relate to the
N–O stretch due to presence of residual nitrate from the sample preparation (reported at 1384 cm1).31The very large feature at
around 550 cm1can be assigned to the Ce–O stretch of the
Fig. 3 WAXRD (a) and SAXRD (b) patterns of ceria products prepared using the method indicated. The small peak at about 45is due to the sample holder (main peak of Fe). The plots are shifted vertically for clarity.
[image:6.595.44.290.376.681.2]Fig. 4 FT-IR spectra of the standard carbon template, non-meso-porous ceria and mesonon-meso-porous ceria products made using the methods indicated. The plots are shifted on the y-axis for clarity.
Table 2 IR peaks observed for non-mesoporous ceria and the mes-oporous ceria products made using the methods indicated
Sample ID IR peaks (cm1)
Non-mesoporous 3305 1638 1535 1342 1065 841
SL 1537 1320 1111 1049 848
IW 3360 1641 1547 1308 1047 848
DS 2046 1537 1325 1024 856
CS 3404 1539 1305 1051 858
Open Access Article. Published on 29 October 2019. Downloaded on 11/4/2019 9:08:04 AM.
This article is licensed under a
[image:6.595.304.552.654.730.2]ceria lattice.31Importantly, Fig. 4 shows that the IR spectrum of
the carbon template does not match with the ceria products, indicating that the template was completely removed from the products.
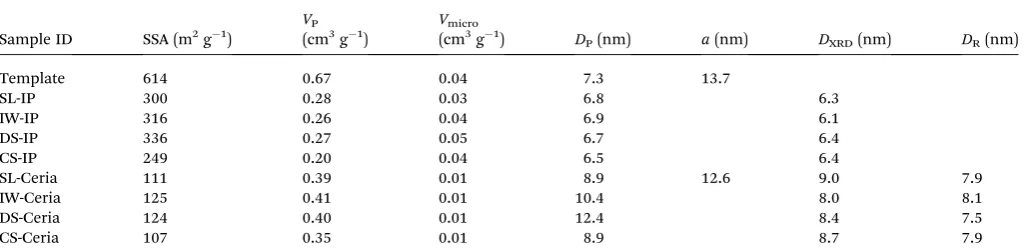
Finally, a complementary 3D morphological characterisation of the solids by ET was performed. As an illustration, Fig. 5a and b show two perspective views of the rendered volume recon-structed from the tilt series for the SL-Ceria sample. The ET data show the complex 3D morphology of the mesoporous solid. As 2D TEM images suggest, the sample is not made up of isolated CeO2rods, as might initially be expected from a template with
isolated cylindrical channels, but, instead, is constituted of a network of thin rods interconnected in 3D in a complex fashion. These features are better appreciated in the orthoslices shown in Fig. 5c–e. These correspond to sections, just one voxel thick (z0.98 nm), throughout the volume of the particle shown in the rendered image. In particular, Fig. 5c corresponds to a section through a plane along the direction of the rods and Fig. 5d and e along their perpendicular. Both orthoslices clearly evince the mesoporous nature of the solid, while the rod-like shape of ceria particles is better observed in Fig. 5c. The width of the rods falls in the range 5–10 nm and the pores are roughly 7 nm across, in good agreement with previous TEM and physisorption results. However, another important aspect revealed by the 3D reconstruction is that, due to the connectivity
between different rods, the pore system does not consist of simple, straight channels but of rather tortuous, nanometre-scale, paths.
To check the accuracy of the ET results, the 3D reconstruc-tions were segmented using an improved procedure developed by the C´adiz group.29This process allowed us to separate the
volume of the reconstruction corresponding to the solid from that of the background. Once segmented, and using the density of CeO2(7.22 g cm3) the specic surface area of the material
was estimated, and a value of roughly 100 m2g1was obtained, which is in very good agreement with the macroscopic measurement. Therefore, the morphological details revealed by the reconstruction illustrated in Fig. 5 can be considered representative of the sample as a whole. In any case, additional reconstructions from other particles of the same sample can be found in the ESI (Fig. S3–S5†).
The nanorods themselves appear to have a somewhat rough morphology in ET, rather than being perfect, smooth cylinders. This is logical given the nature of their formation within the pores of the OMC template and the fact that the rods are crys-talline with many small exposed crystal facets, as seen by TEM. The SSA of an ideal ceria mesopore structure with smooth, dense (7.22 g cm3) cylindrical nanorods of diameter, 7.9 nm, and with mesopore unit cell dimension, 12.6 nm, (values ob-tained experimentally for SL-Ceria, Table 1) was calculated to be
Fig. 5 Electron tomography results for the SL-Ceria sample: (a and b) perspective views of the rendered volume obtained after reconstruction; (c–e) orthoslices through the reconstructed volume in directions parallel (c) and perpendicular (d and e) to the axes of the CeO2nanorods.
Open Access Article. Published on 29 October 2019. Downloaded on 11/4/2019 9:08:04 AM.
This article is licensed under a
[image:7.595.129.469.52.369.2]70.1 m2g1. The fact that this value is lower than the experi-mental value (111 m2g1) and that obtained from the ET results (100 m2g1) would indeed be explained by the ceria nanorods having signicant surface roughness. It is worth noting that this roughness would scatter X-rays non-uniformly and may explain why the peaks in the SAXRD patterns of the ceria products are not better dened.
3.2 Effect of template calcination temperature
One of the requirements for nanocasting metal oxides is the successfullling of pores of the mesoporous template with the precursor compound. One potential limitation of the use of OMC materials as hard templates is carbon's hydrophobic nature. Aer removal of the structure directing agent, the pore surfaces of OMCs possess functional groups and, because of these, have some degree of hydrophilicity. However, the pres-ence of too many functional groups can decrease the pore size or even block the pores. Pore hydrophobicity increases as these functional groups are decomposed and removed on increasing the calcination temperature, Tcalc, of the OMC materials. In
order tond an appropriate value ofTcalcfor a high degree of
inltration, OMCs calcined at Tcalc ¼ 350, 400, 500, 600 or
800 C were impregnated with Ce(NO3)3$6H2O using the SL
[image:8.595.315.545.365.698.2]method. This impregnation method was used because it is solvent free, allows ease of handling and is environmentally friendly.21
Fig. 6 presents values of SSA, pore volume and micropore volume – relative to the pristine OMC template – of the impregnated carbon templates aer heating at 200 C, as a function ofTcalc. Heating at 200C is expected to promote the crystallisation of the ceria within the pores of the OMC without
the template itself being removed. Therefore, these relative values give a good indication of the extent of porelling in the impregnation step. The template calcined at 350 C showed high relative values of SSA and pore volume aer impregnation and subsequent cerium oxide formation. This indicates a low degree of porelling. This may be because the large number of surface functional groups hindered the entry of the liquid precursor. The template calcined at 400C showed the highest level of porelling as it had the lowest values of SSA and pore volume aer impregnation and CeO2 formation. Further
increase inTcalcabove 400C resulted in a clear and progressive increase in the values of these parameters. This may be attrib-uted to increased hydrophobicity of the carbon template with increasingTcalcwhich would decrease the degree of wetting of the pore walls by the liquid precursor and so decrease the effi -ciency of porelling. A Tcalc of 400 C clearly gives the best results on the basis of these data and this value was used in the preparation of the standard OMC template in this work.
The ceria products obtained by removing the carbon template were named Ceria-TcalcwhereTcalcis the temperature
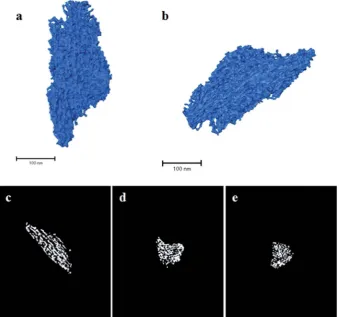
at which the parent template was calcined. Fig. 7a shows the WAXRD patterns of these samples which indicate their crys-talline nature and show reections typical of theuorite-type structure of cerium oxide. Table 3 collects together textural parameters for these products and for their parent OMC
Fig. 7 WAXRD (a) and SAXRD (b) patterns of ceria prepared from OMC templates calcined at the temperatures indicated.
Fig. 6 Specific surface area and pore volume (relative to the SSA and pore volume of the template)vs.calcination temperature of the OMCs in ceria-impregnated samples prepared by the SL method.
Open Access Article. Published on 29 October 2019. Downloaded on 11/4/2019 9:08:04 AM.
This article is licensed under a
[image:8.595.55.282.444.691.2]templates. The crystallite sizes, calculated using Scherrer's formula, of the ceria products are seen to decrease with increasingTcalc from 9.6 to 8.0 nm. This indicates that – as would be expected–crystallite growth was limited by the pore diameter of the template, which also decreased as Tcalc
increased (Table 3).
Fig. 7b shows the SAXRD patterns of ceria products made from templates calcined at the different values of Tcalc. The
patterns for Ceria-350, Ceria-400 and Ceria-500 show peaks that could be indexed as the reection from the 100 planes of a 2D hexagonal mesostructure. This peak is more pronounced in the case of Ceria-400. The unit cell parameters calculated fromd100
of these three samples were smaller than the unit cell param-eters of their parent template (Table 3). This shows that shrinkage of the unit cell occurred on going from the carbon templates to the mesoporous ceria products, as was described above.
Fig. 8 shows the N2 physisorption isotherms and
corre-sponding pore size distributions for the ceria products aer the removal of the template. The isotherm of Ceria-400 shows two hysteresis loops, one starting at a relative pressure ofca.
0.68, which is due to capillary condensation and is typical of mesoporous materials having regular mesopores, while the
other, starting at the relative pressure ofca.0.85, represents the inter-particle voids (as discussed above). The presence of these two kinds of pores can be clearly seen in the corre-sponding pore size distribution. This shows a narrow peak centred at ca. 9.0 nm and a broader feature at larger pore diameters. The two hysteresis loops are less pronounced in the cases of Ceria-350 and Ceria-500. In these samples, the peak in the pore size distribution relating to the presence of uniform mesopores is smaller than for Ceria-400. The isotherms of Ceria-600 and Ceria-800 are of Type IV with single hysteresis loops intermediate between Type H1 and Type H3. The textural parameters of these materials are given in Table 3. The Ceria-350 sample had the lowest values of SSA and pore volume (96 m2g1and 0.25 cm3g1, respectively) followed by Ceria-800 (109 m2g1and 0.26 cm3g1, respectively). Overall, the pore volume increased on increasing the calcination temperature of the template tillTcalc¼500C and then decreased at higher
Tcalc. The same trend was found for the SSA and micropore volume but the difference between samples is very small in the latter. The pore diameter at the low-diameter maximum in the pore size distribution decreased smoothly on increasing templateTcalcwhich is logical since this also happened to the pores of the templates themselves (Table 3). Again, it should be remembered that DP refers to cylindrical pores in the
template but to the pores between cylindrical nanorods in the ceria products, and so these two sets of values cannot be directly compared.
Fig. 9 presents representative intermediate and high magnication images of the ceria products made using OMCs with varying Tcalc. These conrm the presence of meso-structures with long range order. Fig. 9a–g and i–k show parti-cles whose mesopore structure is viewed along the [110] direction of the hexagonal mesopore structure in the Ceria-350, Ceria-400, Ceria-500, Ceria-600 and Ceria-800 samples. The rod-like structures observed are the expected product of nano-casting from the 2D hexagonal OMC template. Fig. 9h shows a particle of Ceria-600 whose mesopore structure is viewed along the [001] direction and shows the hexagonal arrangement of the nanorods. The lattice planes of the ceria comprising the nanorods can be clearly seen in Fig. 9b and f–as are the Moir´e patterns in Fig. 9d which are a consequence of the electron
[image:9.595.44.552.62.188.2]Fig. 8 Nitrogen physisorption isotherms (a) and pore size distributions (b) of ceria products made using OMC templates calcined at the tempera-tures indicated. The isotherms are offset vertically in steps of 50 cm3g1.
Table 3 Textural parameters of the mesoporous ceria samples made using carbon templates calcined at the temperatures indicateda
Sample ID SSA (m2g1) V
P(cm3g1) Vmicro(cm3g1) DP(nm) a(nm) DXRD(nm) DR(nm)
Template-350 610 0.69 0.034 7.7 13.5
Template-400 608 0.63 0.053 7.0 13.0
Template-500 687 0.58 0.103 6.3 12.1
Template-600 719 0.55 0.134 6.2 11.8
Template-800 707 0.52 0.153 5.7 11.0
Ceria-350 96 0.25 0.008 9.5 11.4 9.6 7.9
Ceria-400 111 0.36 0.011 8.7 11.6 8.9 8.0
Ceria-500 118 0.40 0.012 8.4 11.0 8.4 7.6
Ceria-600 116 0.31 0.011 7.6 7.9 7.3
Ceria-800 109 0.26 0.009 6.8 8.0 7.0
aSSA: specic surface area;V
P: pore volume;Vmicro: micropore volume;DP: pore diameter at maxima of pore size distribution;a: unit cell parameter ¼(2d100/O3);DXRD: crystallite size calculated from peak (111) in WAXRD;DR: rod diameter from TEM.
Open Access Article. Published on 29 October 2019. Downloaded on 11/4/2019 9:08:04 AM.
This article is licensed under a
[image:9.595.47.290.541.690.2]beam passing through two crystalline regions in turn. These images conrm the crystalline nature of the nanorods, and also that a particular orientation of the crystal lattice can persist over
relatively large distances along the nanorods (Fig. 9b and f), as seen in Fig. 2c. To remove the carbon template, all ceria prod-ucts were heated at 530C in air. The TEM images indicate that these materials retained their mesostructure and crystallinity which shows their thermal stability at this temperature. The average rod diameter found during TEM analysis of the ceria products was slightly larger than the pore diameter of their parent templates (Table 3) which indicates that crystal growth occurred during or aer template removal (as discussed in Section 3.1). There was a decrease in average rod diameter with increasingTcalcwhich is expected since the pore diameter of the carbon templates also decreased with increasingTcalc(Table 3). The physisorption analysis shows that the sample made using the carbon template sintered atTcalc¼400C gave rise to the highest loading of CeO2of these samples aer heating at
200C and the peak in the pore size distribution indicating the presence of regular mesopores is larger for this sample than for any other in theTcalcseries. The SAXRD pattern of this sample showed the strongest peak corresponding to the 2D hexagonal mesostructure and mostly ordered mesoporous material was found when the sample was examined by TEM. All these results indicate that using an OMC template prepared with Tcalc ¼
400C to prepare mesoporous ceria by nanocasting gave rise to the best results. Despite the fact that the 600 and Ceria-800 were made using carbon templates that were hydrophobic in nature26highly ordered mesoporous ceria products were still
obtained, even though these had relatively small pore volumes.
4.
Conclusion
These results show that among all impregnation methods studied, the SL method gave the narrowest pore size distribu-tion in the small diameter mesoporous region, and the smallest amount of inter-particle voids. The sample made using this method is the only product that showed a clear peak in SAXRD corresponding to the 100 plane of the 2D hexagonal meso-structure. The TEM and 3D STEM analysis showed mostly ordered material in this sample. Also, this method is solvent free so allows easy handling and is environmentally friendly. So it can be concluded that this is the best of the impregnation methods studied here.
Among carbon templates calcined at different temperatures, that calcined at 400C gave rise to the highest loading of ceria precursor and the ceria product made using this template was found to be the best sample of the series, as shown by phys-isorption, SAXRD and TEM analysis.
As would be expected when considering the mechanism of nanocasting, the growth of the ceria nanocrystals and of the diameter of the ceria nanorods are both restricted by the dimensions of the pores of the OMC template. However, the rod diameters are slightly larger than the diameters of the corre-sponding pores in the parent OMC template, suggesting that some growth of the rods occurred during or aer removal of the template. These nanorods exhibit relatively long regions in which their ceria crystal lattice remains aligned and also appear to have signicant surface roughness, partly as a consequence of their crystalline nature.
Fig. 9 TEM images at low and high magnifications of ceria meso-structures viewed along the [110] direction unless stated otherwise: (a and b) 350; (c and d) 400; (e and f) 500; (g) Ceria-600; (h) Ceria-600 viewed along [001] direction; (i and j) Ceria-800.
Open Access Article. Published on 29 October 2019. Downloaded on 11/4/2019 9:08:04 AM.
This article is licensed under a
[image:10.595.50.283.46.631.2]Because of their novel nanostructure and the absence of metal and halide ions–potential catalyst poisons–from their preparation route, the materials described in this paper have considerable potential for application in catalysis and electro-catalysis and these avenues are currently being investigated by the authors. Furthermore, we believe that this method could be applied generally to prepare products of a wide range of compositions.
Con
fl
icts of interest
There are no conicts of interest.
Acknowledgements
We thank the University of St Andrews for the PhD scholarship of FS. Electron microscopy (EM) was performed at the Electron Microscopy Facility, School of Chemistry, University of St Andrews. We thank Mr Ross Blackley for assistance with EM. STEM-HAADF ET results were obtained at the Electron Microscopy Facilities (DME SC-ICYT) of the University of C´adiz, Spain. We acknowledge funding from MINECO/FEDER (Projects MAT2017-87579-R and MAT2016-81118-P) and from the European Union's Horizon 2020 Research and Innovation Programme under grant agreement No. 823717–ESTEEM3.
References
1 J. Roggenbuck, T. Waitz and M. Tiemann, Microporous Mesoporous Mater., 2008,113, 575–582.
2 X. Lai, X. Li, W. Geng, J. Tu, J. Li and S. Qiu,Angew. Chem., Int. Ed., 2007,46, 738–741.
3 Y. Ren, Z. Ma and P. G. Bruce,Chem. Soc. Rev., 2012,41, 4909–4927.
4 M. M. Nair, H. Yen and F. Kleitz,C. R. Chim., 2014,17, 641– 655.
5 D. Gu and F. Sch¨uth,Chem. Soc. Rev., 2014,43, 313–344. 6 B. Tian, X. Liu, H. Yang, S. Xie, C. Yu, B. Tu and D. Zhao,Adv.
Mater., 2003,15, 1370–1374.
7 Y. Wang, Y. Wang, J. Ren, Y. Mi, F. Zhang, C. Li, X. Liu, Y. Guo, Y. Guo and G. Lu,J. Solid State Chem., 2010,183, 277–284.
8 T. Brezesinski, C. Erpen, K. I. Iimura and B. Smarsly,Chem. Mater., 2005,17, 1683.
9 W. Yue and W. Zhou,Prog. Nat. Sci., 2008,18, 1329–1338. 10 W. Shen, X. Dong, Y. Zhu, H. Chen and J. Shi,Microporous
Mesoporous Mater., 2005,85, 157–162.
11 S. Polarz and M. Antonietti,Chem. Commun., 2002, 2593– 2604.
12 B. Liu and R. T. Baker,J. Mater. Chem., 2008,18, 5200–5207. 13 Y. Ren, Z. Ma, L. Qian, S. Dai, H. He and P. G. Bruce,Catal.
Lett., 2009,131, 146–154.
14 W. Yue and W. Zhou,J. Mater. Chem., 2007,17(47), 4947– 4952.
15 S. C. Laha and R. Ryoo,Chem. Commun., 2003, 2138–2139. 16 A. Trovarelli,Catal. Rev. - Sci. Eng., 1996,38, 439–520. 17 H. C. Yao and Y. F. Y. Yao,J. Catal., 1984,86, 254–265. 18 A. Trovarelli, C. de Leitenburg, M. Boaro and G. Dolcetti,
Catal. Today, 1999,50, 353–367.
19 S. Park, J. M. Vohs and R. J. Gorte,Nature, 2000,404, 265– 267.
20 P. Ji, J. Zhang, F. Chen and M. Anpoa,J. Phys. Chem. C, 2008,
112, 17809–17813.
21 W. Yue and W. Zhou,Chem. Mater., 2007,19, 2359–2363. 22 J. Roggenbuck, H. Schafer, T. Tsoncheva, C. Minchev,
J. Hanss and M. Tiemann,Microporous Mesoporous Mater., 2007,101, 335–341.
23 H. Zhang, X. Yan and W. Li,Chin. J. Catal., 2009,30, 1085– 1090.
24 B. Puertolas, B. Solsona, S. Agouram, R. Murillo, A. M. Mastral, A. Aranda, S. H. Taylor and T. Garcia,Appl. Catal., B, 2010,93, 395–405.
25 B. Solsona, R. Sanchis, A. Dejoz, T. Garc´ıa, L. Ruiz-Rodr´ıguez, J. L´opez Nieto, J. Cecilia and E. Rodr´ı guez-Castell´on,Catalysts, 2017,7, 96.
26 F. Sakina and R. T. Baker,Microporous Mesoporous Mater., 2019,289, 109622.
27 C. Messaoudi, T. Boudier, C. O. Sanchez-Sorzano and S. Marco,BMC Bioinf., 2007,8, 288.
28 W. van Aarle, W. J. Palenstijna, J. de Beenhouwera, T. Altantzisc, S. Balsc, K. J. Batenburg and J. Sijbers,
Ultramicroscopy, 2015,157, 35.
29 M. Lopez-Haro, M. Tinoco, S. Fern´andez-Garcia, X. Chen, A. B. Hungria, M. ´A. Cauqui and J. J. Calvino, Part. Part. Syst. Charact., 2018,35, 1700343.
30 M. Chelliah, J. B. B. Rayappan and U. M. Krishnan,J. Appl. Sci., 2012,12, 1734–1737.
31 M. Chelliah, J. B. B. Rayappan and U. M. Krishnan,J. Appl. Sci., 2012,12, 1734–1737.
32 M. Palard, J. Balencie, A. Maguer and J.-F. Hochepied,Mater. Chem. Phys., 2010,120, 79–88.
33 J. Gao, F. Gua, Y. Ma and Y. Wu,Rare Met., 2001,20, 217–220. 34 F. I. Williams Dudley, Spectroscopic Methods in Organic Chemistry, Mc Graw-Hill Higher Education, 6th edn, 2007.
Open Access Article. Published on 29 October 2019. Downloaded on 11/4/2019 9:08:04 AM.
This article is licensed under a
![Fig. 2Intermediate and high magnification TEM images of: (a–c) SL-Ceria; (d and e) IW-Ceria; (f and g) DS-Ceria; (all viewed along the [110]direction) and (h and i) CS-Ceria (viewed along the [001] direction of the mesopore structure) with DDP of the mesopo](https://thumb-us.123doks.com/thumbv2/123dok_us/9021415.398702/5.595.70.527.49.497/intermediate-magnication-ceria-direction-direction-mesopore-structure-mesopo.webp)


![Fig. 9TEM images at low and high magnifications of ceria meso-structures viewed along the [110] direction unless stated otherwise: (aand b) Ceria-350; (c and d) Ceria-400; (e and f) Ceria-500; (g) Ceria-600; (h) Ceria-600 viewed along [001] direction; (i and j) Ceria-800.](https://thumb-us.123doks.com/thumbv2/123dok_us/9021415.398702/10.595.50.283.46.631/magnications-structures-direction-ceria-ceria-ceria-viewed-direction.webp)
