ISSN Online: 2169-2645 ISSN Print: 2169-2637
DOI: 10.4236/ojee.2019.82005 Jun. 27, 2019 64 Open Journal of Energy Efficiency
Experimental Studies of the Effect of
Electrolyte Strength, Voltage and Time
on the Production of Brown’s (HHO) Gas
Using Oxyhydrogen Generator
Samuel Pamford Kojo Essuman
*, Andrew Nyamful, Vincent Agbodemegbe, Seth Kofi Debrah
Department of Nuclear Engineering, Graduate School of Nuclear and Allied Sciences, University of Ghana, Accra, Ghana
Abstract
A great challenge in water electrolysis is how to optimize the major factors that influence the production of hydrogen gas. Over the past years, different methods have been used to produce hydrogen gas from carbon-base fossil fuels but these methods have been proven to be environmentally unfriendly due to the enormous release of greenhouse gases associated with their use. In this work, an experimental study was carried out to evaluate the effect of electrolyte strength, voltage and time on the volume of HHO gas produced using a design built HHO gas generator. The generator was constructed from Stainless Steel 316 L plates made of 3 anodes, 3 cathodes, and 20 neutral plates. During the study, the strengths of KOH, NaOH, and NaHCO3 was prepared within the range of 0.010 M - 0.030 M. The prepared strengths for each catalyst were then varied across voltage range of 9 V to 13 V for 50 seconds. The experimental results obtained showed that, increasing electro-lyte strength, voltage and time proportionally increased the yield of HHO gas. An optimal yield rate of 2.27 cm3/s of HHO gas was obtained when the gene-rator was run at 13 V using 0.025 M KOH. In addition, other factors studied including electrode surface morphology, plate’s configuration, and tempera-ture also showed improvement in yield of HHO gas by 41.85%, 69.74%, and 71.96% respectively.
Keywords
Oxyhydrogen (HHO) Gas, HHO Gas Generator, Water Electrolysis, Rectifier, Catalyst, Neutral Plate, Bubbler
How to cite this paper: Essuman, S.P.K., Nyamful, A., Agbodemegbe, V. and De-brah, S.K. (2019) Experimental Studies of the Effect of Electrolyte Strength, Voltage and Time on the Production of Brown’s (HHO) Gas Using Oxyhydrogen Genera-tor. Open Journal of Energy Efficiency, 8, 64-80.
https://doi.org/10.4236/ojee.2019.82005
Received: March 24, 2019 Accepted: June 24, 2019 Published: June 27, 2019
Copyright © 2019 by author(s) and Scientific Research Publishing Inc. This work is licensed under the Creative Commons Attribution International License (CC BY 4.0).
DOI: 10.4236/ojee.2019.82005 65 Open Journal of Energy Efficiency
1. Introduction
Fossil fuels are a versatile and vital energy source which human productive lives are largely dependent on for commodities, transportation, and energy produc-tion. The discovery of fossil fuels has injected centuries of ingenious effort into perfecting Internal Combustion Engine (ICE) fueled by gasoline and diesel [1]. Research and development (R&D) conducted over recent decades has shown that the electric power sector and transportation sector account for 82% and 95% respectively of all fossil fuel consumed in the world. This makes fossil fuel the highest consumed source of energy [2]. Despite the usefulness of these fuels, studies have further revealed that the continuous burning of these fossil fuels (coal, oil, and gas) release enormous amount of pollutants (radioactivity, heavy metals, and ashes) and greenhouse gases (CO, CO2, SOx, and NOx) into the environment causing global warming and other related human diseases [3][4]. Scientists are therefore, investigating new developments in hydrogen-energy technology for a sustainable future [5][6][7]. Literature review undertaken on the uses of hydro-gen-rich (HHO) gas from 2012 to 2017 showed limited research into the reduction in the concentrations of SO2, NOx, CO, and THCs emitted from the combustion chamber of ICEs using hydrogen-rich (HHO) gas/gasoline/air mixture. However, the evaluation of the major factors that influence the production of this hydro-gen-rich gas has not been studied extensively within the period reviewed.
The development of a hydrogen generator for hydrogen gas production was investigated by Arinola B. Ajayi and Olayiwola O. Akerele in 2013 [8]. Their re-sult showed an increase in the volume of HHO gas produced (27 liters) when a current of 60 amperes was passed through the electrolytic solution for 30 mi-nutes. A similar work done by Munther Issa Kandah in 2014 [9] supported this conclusion. A. L. Yuvaraj and D. Santhanaraj, 2014 [10]; Noor Alam and K. M. Pandey in 2017 [11] further did a systematic study on the electrolytic production of hydrogen gas using graphite as electrode. Their results showed a significant effect on the production of hydrogen gas when the reaction parameters such as the electrolyte concentration of KOH, applied voltage, and current was in-creased. Ibrahim Dincer and Canan Acar in 2013 [12] also did a comparative as-sessment of hydrogen production methods from renewable and non-renewable sources. The study was aimed to compare the performances of hydrogen pro-duction methods and assess their economic, social and environmental impacts. The methods considered in their study was steam reforming, coal gasification, water electrolysis, biomass gasification, thermochemical water splitting, and high temperature electrolysis. Their results indicated that thermochemical water splitting using CueCl and SeI cycles was more environmentally benign than the other traditional methods in terms of emissions.
DOI: 10.4236/ojee.2019.82005 66 Open Journal of Energy Efficiency reduction in the concentration of pollutants emitted into the environment. The present study, therefore, seeks to investigate the effects of 5 different strengths of 3 selected catalysts (KOH, NaOH, and NaHCO3), voltage and time on the yield of HHO gas produced using an HHO gas generator. The research also evaluates the influence of electrode surface morphology, temperature and neutral plate’s configuration presented in other works reviewed.
1.1. Conventional Methods of Hydrogen Production
This section outlines some of the traditionally accepted methods used in pro-ducing hydrogen gas. The section also shares light on the basic principles under-pinning the subject of discussion in this study.
1.1.1. Steam Reforming
Steam reforming is one of the most widespread and least expensive process for hydrogen production. About 90% of all hydrogen used in the world are pro-duced via this method [14]. This is attributed to the high efficiency, low opera-tional and production cost associated with this technology. The most frequently used raw materials in steam reforming are natural gas and light hydrocarbons. Hydrogen gas produced using this method is done in two major stages. In the first stage, the raw material is fed into steam at operating temperature and pres-sure between 500˚C - 900˚C and 0.3 - 2.5 MPa respectively in a tube reactor filled with nickel oxide [15]. Identified with the syngas (H2 + CO) produced during the catalytic process is CO2. The reaction products (H2 + CO + CO2) produced are then channeled through a boiler to produce steam. The steam is then condensed and cooled to a temperature of 360˚C using an auxiliary con-denser. In the second stage, the cooled gas is fed into converters, where carbon monoxide is converted by means of steam into carbon with some amount of carbonic gas which is removed through the process by a reversible exothermic reaction. The chemical reactions associated with this process are shown below. Currently, the efficiency of steam reforming is estimated to be 85% [15].
( )
4 2 2
CH +H O g →CO 3H endothermic+ (1)
( )
4 2 2 2
CH +2H O g →CO +4H endothermic (2)
( )
2 2 2
CO H O g+ →CO +H exothermic (3)
2 2 2
CO +H ↔CO H O exothermic+ (4)
1.1.2. Partial Oxidation
DOI: 10.4236/ojee.2019.82005 67 Open Journal of Energy Efficiency
4 2 2
CH +O →CO 2H exothermic+ (5)
4 2 2 2
CH +2O →CO +2H O exothermic (6)
4 2 2
CH +H O→CO 3H endothermic+ (7)
1.1.3. Autothermal Reforming
In autothermal reforming, steam is added to the gasified raw material and oxy-gen via a process called the Fischer-Tropsch synthesis (Holladay et al., 2009). In this reaction, the commonly used catalyst is Nickel-based catalysts. The efficien-cy of autothermal reforming of methane ((8), (9)) is between 60% - 75% slightly lower than that of steam reforming [15].
2 2 2
1 1 1 1
C H H O O CO H
2 4 2 2
m n m m m m n
+ + → + +
(8)
4 2 2 2
CH +H O O+ →3CO 7H+ (9)
1.1.4. Water-Gas Shift
In Water-gas shift reaction, carbon monoxide is converted to carbon dioxide and hydrogen using steam at temperatures between 400˚C - 500˚C in the pres-ence of chrome oxide and iron oxide (Cr2O3, Fe2O3) as indicated in (10).
2 2 2
CO H O+ →CO +H exothermic (10)
The water-gas shift process also goes through two important successive steps. The first step involves the conversion of 90% of carbon monoxide in a reactor conditioned at temperatures between 350˚C - 370˚C. In the second step, the re-maining carbon monoxide is removed through catalytic methanation or purifi-cation. The methanation reactor transforms the residual carbon monoxide (11) or carbon dioxide (12) into methane, thus lowering its concentration [15].
2 4 2
CO 3H+ →CH +H O (11)
2 2 4 2
CO +4H →CH +2H O (12) However, at higher temperatures, the equilibrium of the reaction shifts to the left resulting in the complete transformation of carbon monoxide to hydrogen as shown in Equation (13).
2 2 2
CO +H →CO H O+ (13)
1.1.5. Pyrolysis and Co-Pyrolysis
In pyrolysis and co-pyrolysis, raw organic materials are heated and degasified in vacuo at pressures and temperatures between 0.1 - 0.5 MPa and 500˚C - 900˚C respectively [16]. Here, the process is made to occur without oxygen and air to prevent the formation of dioxins [15]. As a result, this process offers significantly lower emissions. The chemical reaction for pyrolysis and co-pyrolysis are gener-ally described using Equation (14). Currently, the application of co-pyrolysis of organic wastes has gain much industrial research and development since the process helps to limit and lightens the burden of wastes in waste disposal [17].
2 4
DOI: 10.4236/ojee.2019.82005 68 Open Journal of Energy Efficiency 1.1.6. Alkaline Electrolyzers
Alkaline electrolyzers are classified as one of the most mature electrolyzer tech-nology available at the world market [18]. Their design consists of anode and ca-thode electrodes made of steel and nickel-plated steel respectively. The electrolytes used in this technology are aqueous solutions of either potassium hydroxide (KOH) or sodium hydroxide (NaOH). The anode and cathode electrodes are fur-ther separated from each ofur-ther by a semipermeable membrane all submerged in the electrolyte. During operations of a typical alkaline electrolyzer, direct cur-rent is passed through the cell to decompose water into hydrogen gas at the ca-thode and oxygen gas at the anode. The half-anodic and cathodic reactions as well as the net reaction are shown in Equations (15), (16), (17), and (18).
( ) ( ) ( )
2 l 2g aq
4H O +4e−→2H +4OH− (15)
( ) ( ) ( )
2 l 2g aq
2H O →O +4H+ +4e− (16)
( )aq ( )aq 2 ( )l
4OH− +4H+ →4H O (17)
( ) ( ) ( )
2 l 2g 2g
2H O
→
2H
+
O
(18)1.1.7. Polymer Electrolyzers
Proton exchange membrane (PEM) was produced as an alternative technology to conventional alkaline water electrolyzers. Studies have shown that, Proton exchange membrane technologies offers several advantages over traditional alka-line technology. These include their compact design, higher production rates, and energy efficiency [19]. PEM cells consists primarily of anode and cathode electrodes that are bonded together. These electrodes are composite of electro-catalytic particles and electrolyte polymer. Equations (19), (20) and (21) show the reactions that takes place in a PEM cell.
Anodic reaction: 2H O2 ( )l →O2( )g +4H+( )aq +4e− (19)
Cathodic reaction: 4H+( )aq +4e−( )aq →2H2( )g (20)
Overall reaction: 2H O2 ( )l →2H2( )g +O2( )g (21)
1.1.8. Solid Oxide Electrolyzers
These type of electrolyzers use a solid ceramic material as their main electrolyte. The electrolyte is designed and process to selectively transmit negatively charged oxygen ions at elevated temperatures between 500˚C - 800˚C [20]. At the ca-thode, water combines with electrons from the external circuit to form hydrogen gas and negatively charged oxygen ions. The oxygen ions diffuse through the membrane and react at the anode to form oxygen gas. This reaction gives up electrons to the external circuit which is subsequently measured using ammeter. The half anodic, cathodic and net reactions that take place in solid oxide elec-trolyzers are depicted below.
Anodic reaction: 2
( )
( )
( )
2 1
O aq O g 2e aq
2
DOI: 10.4236/ojee.2019.82005 69 Open Journal of Energy Efficiency
Cathodic reaction:
( )
( )
( )
2( )
2 2
H O l 2e aq
+
−→
2H g O aq
+
− (23)Overall reaction: H O l2
( )
→2H g2( )
+12O g2( )
(24)2. Methodology
2.1. Materials
Sodium hydroxide (analytical grade with assay 97% - 100.5%), potassium hy-droxide (analytical grade with assay 86.1%), sodium hydrogen carbonate (ana-lytical grade with assay 99.5%), distilled water, 250 cm3 graduated measuring cy-linder, spatula, 250 cm3 water bottle, 2000 cm3 volumetric flask, mercury in glass thermometer, and emery sandpaper (of grades 100, 120, 180, 220, and 320).
2.2. Equipment and Device
HHO gas generator, rectifier, analytical balance, retort stand.
2.3. Preparation of Electrolyte Strength
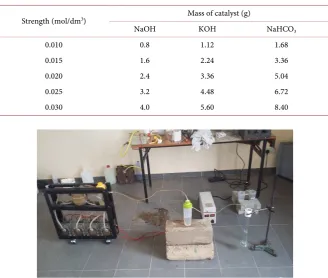
1.12 g of KOH were placed in a clean 2 L volumetric flask containing 500 cm3 distilled water. The flask was corked and placed in a sonicator for 10 minutes. The contents in the flask was topped up with distilled water to the 2 L meniscus mark to obtain 0.01 M KOH. The flask was labeled V1 and was sonicated for ad-ditional 5 minutes to ensure homogeneity. The process was repeated using 2.24 g, 3.36 g, 4.48 g, and 5.60 g of KOH to obtain 0.015 M, 0.020 M, 0.025 M, and 0.030 M respectively. Similar strengths were prepared using NaOH and NaHCO3 as shown in Table 3.
2.4. Description of Experimental Setup
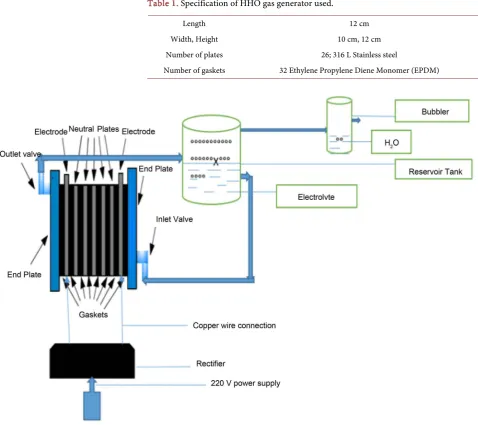
Figure 1 shows the experimental set-up used to produce the HHO gas. The unit
consisted of an HHO gas generator, a reservoir tank, bubbler, and a rectifier. The generator was made from 26 square plates of stainless steel sheet (thickness 20 gauge); comprising of 3 cathode plates, 3 anode plates and 20 neutral plates each of surface area 100 cm2. To reduce excessive bubble attachment, a cross- hatch pattern was engraved on the surface of the electrodes.
The end plates of the generator were made of high tensile strength material to resist high pressures and operating temperatures. The generator was designed so that the voltage between two successive plates was maintained at 2.6 volts. This was achieved by placing 4 neutral plates between each pair of anode and cathode plate. Table 1 shows the technical specifications of the built generator. As shown
in Figure 1, the plates was positioned parallel and spaced with 25 EPDM gaskets
DOI: 10.4236/ojee.2019.82005 70 Open Journal of Energy Efficiency
Table 1. Specification of HHO gas generator used.
Length 12 cm
Width, Height 10 cm, 12 cm Number of plates 26; 316 L Stainless steel
Number of gaskets 32 Ethylene Propylene Diene Monomer (EPDM)
Figure 1. The HHO gas generator unit.
plates was channeled back into the reservoir tank via a 0.5 inch pipe hose. To sa-feguard the integrity of the system, the reservoir tank was connected to a bubb-ler. The main function of the bubbler was to condense the water vapor that was produced with the HHO gas during the experiment and to serve as a safety de-vice. Finally, to supply current to the unit, the terminals of the HHO gas gene-rator was connected to a rectifier by using two insulated copper wires following the methods used by (Meyer and Stanely, 1986; Ammar A. Al-Rousan, 2010; and Sa’ed A Musmar, and Ammar A. Al-Al-Rousan, 2011).
2.5. Experimental Tests
2.5.1. Investigating the Effect of Electrolyte Strength, Voltage and Time on Volume of HHO Gas Produced
gene-DOI: 10.4236/ojee.2019.82005 71 Open Journal of Energy Efficiency rator was filled with 0.010 M solution of KOH through the inlet of the tank to the X-mark as shown in Figure 1. The rectifier with specification described in
Table 2 was switched on and the voltage was adjusted to 9 V. The experiment
was run for 50 seconds and the volume of HHO gas that flowed from the tank into the bubbler (1/2 filled with water) was measured according to section 2.3.2. With the same 0.010 M KOH solution contained within the generator plates, the experiment was repeated for four other trials at 10 V, 11 V, 12 V, and 13 V and the volumes of HHO gas produced were accordingly measured. The entire pro-cedure was further repeated for four other strengths of KOH as well as those prepared for NaOH and NaHCO3 in Table 3 following the methods used by (A. L. Yuvaraj and D. Santhanaraj, 2012; Noor Alam and K. M. Pandey, 2017; Mo-hammad Nazry Bin Rosley et al., 2015).
2.5.2. Volumetric Measurement of Produced HHO Gas
Figure 2 shows the set-up used in measuring the volume of the HHO gas
Table 2. Specification of rectifier used.
Length 20 cm
[image:8.595.209.538.428.706.2]Width, Height 10 cm, 14 cm Rated voltage 0 V - 16 V Rated current 0 A - 13 A Incorporated safety device Breaker
Table 3. Catalyst strength.
Strength (mol/dm3) Mass of catalyst (g)
NaOH KOH NaHCO3
0.010 0.8 1.12 1.68
0.015 1.6 2.24 3.36
0.020 2.4 3.36 5.04
0.025 3.2 4.48 6.72
0.030 4.0 5.60 8.40
DOI: 10.4236/ojee.2019.82005 72 Open Journal of Energy Efficiency produced using KOH, NaOH, and NaHCO3 as catalyst. The volume of gas pro-duced during the tests was measured using the method of water displacement. As outlined in section 2.3.1, as the amount of HHO gas entering the bubbler under concentration gradient from the tank increased, the gas was observed to exert a downward pressure which forced out the water contained inside the bubbler into a 250 cm3 graduated cylinder. The volume of water displaced was then estimated to be equal to the volume of HHO gas produced.
2.5.3. Investigating the Variation of System Temperature with Progressive Production of HHO Gas
In establishing how the temperature of the system varied during the entire expe-riment, the reservoir tank in Figure 1 was equipped with mercury in glass ther-mometer. The rectifier was adjusted to 13 V and the HHO generator was oper-ated using 2 L solution of 0.030 M KOH for 5 minutes. The temperature change that occurred within the tank was read on the thermometric scale and recorded every minute for 5 minutes. The corresponding volume of HHO gas produced in each period was simultaneously measured as described in Section 2.3.2.
2.5.4. Investigating the Influence of Neutral Plate’s Configurations on Volume of HHO Gas Produced
In this experiment, the generator was arranged into three different configura-tions; 3C3A20N, 3C3A16N, and 3C3A12N. Each of this configuration was oper-ated for 50s by filling the plates of the generator with 2 L of 0.030 M KOH at a constant potential of 13 V. The volume of HHO gas produced using each confi-guration was then measured as described in Section 2.3.2.
2.5.5. Investigating the Influence of Electrode Surface Morphology on Volume of HHO Gas Produced
In determining the effect of surface morphology of the electrode plates used in the experiment on the volume of HHO gas produced, the plates of the generator (with configuration 3C3A20N) was first dismantled, rinsed, cleaned and sun-dried for 30 minutes. After the drying activity, a cross-hatch pattern was engraved on the surface of each plate using emery sand paper grade 100. The engraved plates was then arranged and fixed into the generating unit and run for 50 seconds using 2 L of 0.030 M KOH at a constant potential of 13 V. The entire procedure was repeated for 4 other trials but this time varying the elec-trode plate’s surface using grades 120, 180, 220 and 320. The respective volumes of HHO gas produced in each trial was then measured as described earlier.
3. Results and Discussion
3.1. Results
Results of the investigations conducted in the present work are presented and discussed in this session.
3.1.1. Investigating the Effect of Time on the Experimental Reaction
DOI: 10.4236/ojee.2019.82005 73 Open Journal of Energy Efficiency using an adjustable rectifier for 50 seconds. The values recorded in Table 4
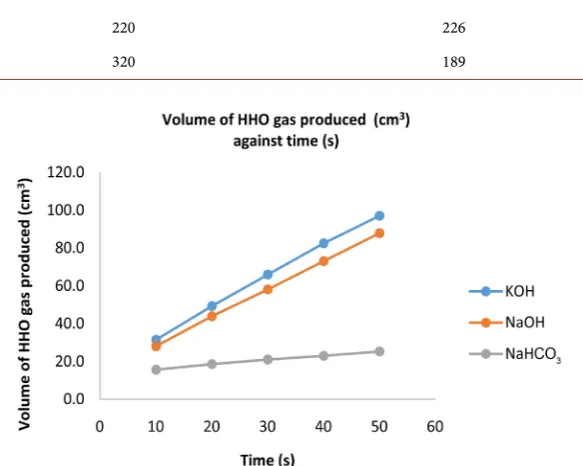
shows that, the yield of HHO gas increased with increasing time.
3.1.2. Studying the Effect of Electrolyte Strength on Oxyhydrogen Gas Produced
In this experiment, prepared strengths of KOH, NaOH, and NaHCO3 was varied using a constant potential of 13 V and period of 50s to evaluate the influence of concentration on the yield of HHO gas. The values recorded in Table 5 shows that, increasing the strengths of the selected catalyst increased the yield of HHO gas produced experimentally.
3.1.3. Evaluating the Effect of Voltage on Yield of Oxyhydrogen Produced
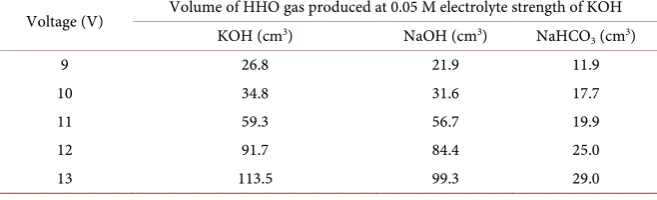
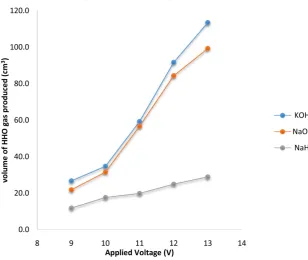
[image:10.595.207.540.346.435.2]On studying how potential difference used in the experiment influenced the volume of HHO produced, a voltage range of 9 V - 13 V was varied using 0.05 M solution each of KOH, NaOH, and NaHCO3. Table 6 shows that, increasing voltage increased the HHO gas yield recorded.
Table 4. Experimental values obtained when the effect of time on volume of HHO gas produced was studied.
Time (s) Volume of HHO gas produced at 0.04 M electrolytes strength and voltage of 13 V KOH (cm3) NaOH (cm3) NaHCO
3 (cm3)
10 31.4 28.0 15.7
20 49.3 43.9 18.6
30 66.0 58.1 21.0
40 82.5 73.1 23.0
[image:10.595.207.540.483.577.2]50 97.1 87.9 25.3
Table 5. Yield of HHO gas recorded when electrolyte strength was varied against poten-tial difference of 13 V for 50 seconds.
Strength (M) Volume of HHO gas produced at constant voltage of 13 V KOH (cm3) NaOH (cm3) NaHCO
3 (cm3)
0.010 32.8 28.0 11.8
0.015 60.7 43.9 19.1
0.020 60.7 61.3 22.8
0.025 88.8 69.8 25.4
0.030 83.3 74.0 24.5
Table 6. Results obtained when voltage was varied using 0.05 M strength each electrolyte of KOH, NaOH, and NaHCO3 for 50 seconds.
Voltage (V) Volume of HHO gas produced at 0.05 M electrolyte strength of KOH KOH (cm3) NaOH (cm3) NaHCO
3 (cm3)
9 26.8 21.9 11.9
10 34.8 31.6 17.7
11 59.3 56.7 19.9
12 91.7 84.4 25.0
[image:10.595.209.538.626.726.2]DOI: 10.4236/ojee.2019.82005 74 Open Journal of Energy Efficiency 3.1.4. Effect of Continuous Production of HHO Gas on Systems
Temperature
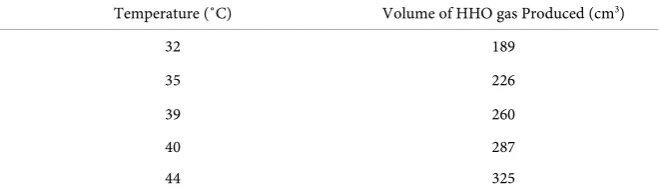
The temperature variation resulting from the generation of HHO gas by an HHO gas generator was measured experimentally using a mercury in glass thermometer. Table 7 shows that, increasing the production of HHO gas caused a corresponding increase in temperature value.
3.1.5. Influence of Neutral Plates on Yield of HHO Gas Produced
Neutral plates in this experiment was varied to study the effect of number of cells creation on the volume of HHO gas that could be produce experimentally. In this study, three configurations of the generating unit was made to run on 0.02 M KOH for 50 seconds. Table 8 shows that, increasing the number of neutral plates in the configuration adopted increased the HHO gas production.
3.1.6. Studying the Effect of Electrode Surface Roughness on Yield of HHO Gas Produced
Table 9 gives the emery sand paper grades and the respective volumes of HHO
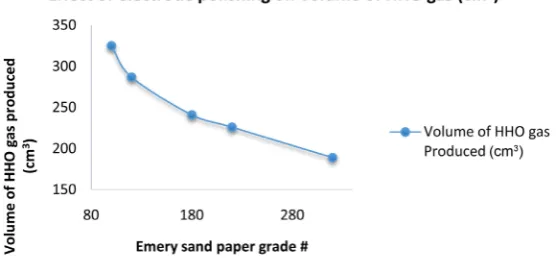
gas that was produced when the electrode surfaces was modified. The results obtained confirm that, increasing the roughness of the electrode surafces pro- gressively increased the volume of HHO gas produced in the experiment.
3.2. Discussions
3.2.1. Effect of Time on HHO Gas Production
[image:11.595.209.539.515.612.2]In order to study the sustainability and stability of the square SS 316L electrodes used in the experiment, the effect of time on the HHO gas evolution reaction was studied under optimized reaction conditions. From the Figure 3, the linear profile of oxyhydrogen production for each catalyst produced over the entire 50 seconds demonstrates that the SS electrode remained stable without any surface destruction throughout the experiment. Similarly, using the rate law of chemical
Table 7. Temperature values measured from the HHO gas generating unit.
Temperature (˚C) Volume of HHO gas Produced (cm3)
32 189
35 226
39 260
40 287
[image:11.595.207.540.646.723.2]44 325
Table 8. Volume of HHO gas recorded from variation in number of neutral plates.
Generator configuration Number of Neutral plates (N) Volume of HHO gas Produced (cm3)
3C3A 12 152
3C3A 16 176
DOI: 10.4236/ojee.2019.82005 75 Open Journal of Energy Efficiency
Table 9. Volume of HHO recorded by varying the surface roughness of the SS electrodes using five different emery grade.
Emery Grade # Volume of HHO gas Produced (cm3)
100 325
120 287
180 241
220 226
320 189
Figure 3. Volume of HHO gas-time profile at constant electrolyte strength and voltage.
reaction, the gradual increase in movement between the molecules of the Hy-drogen gas and Oxygen gas produced during the electrolysis process caused an increase in the average kinetic energy of their constituent molecules. This there-fore, increased the number of effective molecular collision per unit time result-ing in the higher yield of HHO gas observed. This result also affirms an experi-mental research done by Noor Alam and K. M. Pandey in 2017.
3.2.2. Effect of Voltage on HHO Gas Production
[image:12.595.228.520.165.398.2]DOI: 10.4236/ojee.2019.82005 76 Open Journal of Energy Efficiency
Figure 4. Volume of HHO gas-voltage profile at constant strength and time.
3.2.3. Effect of Electrolyte Strength on HHO Gas Production
In establishing the effect of electrolyte strengths on the yield of HHO gas pro-duced during the experiment, the rectifier connected to the generator was ad-justed to a voltage of 13 V. From the study, it was realized that, as the concentra-tion of each electrolyte was increased, the ionic conductivity of the distilled wa-ter also increased whilst at the same time the resistance of the overall generator unit was reduced. Figure 5 shows how the yield of the HHO gas production gradually increased with increasing electrolyte concentration. The increase in the volume of HHO gas observed can be attributed to the increase in hydrogen evolution and oxygen evolution due to the greater number of effective ionic col-lision per unit time. This result supports the experimental outcome obtained by Noor Alam and K. M. Pandey in 2017.
3.2.4. Effect of Temperature on Volume of HHO Gas Produced
Figure 6 shows the temperature and volume of HHO gas profile of the
DOI: 10.4236/ojee.2019.82005 77 Open Journal of Energy Efficiency
Figure 5. Volume of HHO gas-electrolyte strength profile at constant vol-tage and time.
Figure 6. Volume of HHO gas-temperature profile.
electrolysis process. Since an increase in temperature favors the molecular colli-sions between ions, the high number of molecular collicolli-sions was poised to in-crease the HHO gas yield. This results further conform to Faraday’s law which states that “the mass of substance that is deposited, or released in an electrode, is directly proportional to the amount of electric current flowing through the elec-trolyte”.
3.2.5. Effect of Varying Neutral Plates on Volume of HHO Gas Produced
[image:14.595.236.508.356.516.2]DOI: 10.4236/ojee.2019.82005 78 Open Journal of Energy Efficiency
Figure 7. Volume of HHO gas-neutral plates profile.
potential increased the temperature which further enhanced the ionic mobility and the number of effective collisions resulting in the significant volume of the HHO gas observed.
3.2.6. Effect of Electrode Surface Morphology on Volume of HHO Gas Produced Gas
The covering of electrode surfaces by hydrogen and oxygen molecules in litera-ture is well known to reduce and increase the ohmic resistance as well as the electrical conductivity in water electrolysis (K. Qian et al. 1998). In this experi-ment, to eliminate this effect, the surface of electrodes used in electrolytic processes was modified (Munther Issa Kandah, 2014). From Figure 8, increasing the roughness of the electrode plates by engraving cross-hatch patterns on the surface of the plates using emery sand papers was found to increase the volume of HHO gas produced. This observation could be attributed to the fact that, as the surface of the electrode becomes rougher, the plate’s area increases and this therefore, reduced the attractive forces between the bubbles and electrode sur-face leading to the increase in the evolution of HHO gas witnessed.
4. Conclusion
DOI: 10.4236/ojee.2019.82005 79 Open Journal of Energy Efficiency
Figure 8. Volume of HHO gas-electrode surface morphology profile.
5. Recommendation for Future Research
Electrode material loss is one phenomenon that usually occurs during water electrolysis due to the effect of catalyst concentration. To minimize this effect, the authors of this study finds it imperative to recommend further research work into the development of commercially available electrode materials such as pla-tinum, surgical stainless steel, graphite, EN8 and carbon rods to enhance the technology for HHO gas production.
Acknowledgements
I would like to acknowledge Miss Catherine Kuamoah, Miss Hephzibah Ewu-radjoa Pamford Essuman, Mr. Cephas Hammond and Mr. George Crabbe for their immense support that ensured the successful completion of this study.
Conflicts of Interest
The authors declare no conflicts of interest regarding the publication of this pa-per.
References
[1] Balabel, A. and Zaky, M.S. (2011) Experimental Investigation of Solar-Hydrogen Energy System Performance. International Journal of Hydrogen Energy, 36, 4653- 4663.https://doi.org/10.1016/j.ijhydene.2011.01.040
[2] USEA: U.S. Energy Information Administration (2011) Emissions of Green House Gases Report. http://205.254.135.24/oiaf/1605/ggrpt/carbon.html
[3] Kreuter, W. and Hofmann, H. (2008) Electrolysis: The Important Energy Trans-former in a World of Sustainable Energy. International Journal of Hydrogen Ener-gy, 23, 661-666. https://doi.org/10.1016/S0360-3199(97)00109-2
[4] Tester, J.W., Drake, E.M., Driscoll, M.J., Golay, M.W. and Peters, W.A. (2005) Sus-tainable Energy: Choosing among Options. MIT Press, Cambridge.
[5] Kesis, G., Zeps, M. and Vanags, M. (2009) Parameters of an Efficient Electrolysis Cell. Latvian Journal of Physics and Technical Sciences, 3, 6-12.
[6] Hubbert, M.K. (1956) Shell Development Company Exploration and Production Research Division. Publication No. 95 Houston Texas.
Phoe-DOI: 10.4236/ojee.2019.82005 80 Open Journal of Energy Efficiency busan Autonomous Supply System with Renewable Energy: Six Years of Operation-al Experience and Advanced Concepts. Solar Energy, 67, 131-138.
https://doi.org/10.1016/S0038-092X(00)00043-8
[8] Ajayi, A.B. and Akerele, O.O. (2013) Development of Hydrogen Generator for Hy-drogen Gas Production. The International Journal of Engineering and Science, 2, 126-130. http://www.theijes.com
[9] Kandah, M.I. (2014) Enhancement of Water Electrolyzer Efficiency. Journal of Energy Technologies and Policy, 4, 1-9. http://www.iiste.org
[10] Yuvaraja, A.L. and Santhanaraj, D. (2014) A Systematic Study on Electrolytic Pro-duction of Hydrogen Gas by Using Graphite as Electrode. Materials Research, 17, 83-87.https://doi.org/10.1590/S1516-14392013005000153
[11] Alarm, N. and Pandey, K.M. (2017) Experimental Study of Hydroxyl Gas (HHO) Production with Variation in Current, Voltage and Electrolyte Concentration. IOP Conference Series: Materials Science and Engineering, 225, Article ID: 012197.
https://doi.org/10.1088/1757-899X/225/1/012197
[12] Acar, C. and Dincer, I. (2013) Comparative Assessment of Hydrogen Production Methods from Renewable and Non-Renewable Sources. Faculty of Engineering and Applied Science, University of Ontario Institute of Technology, Oshawa.
[13] Wang, C.-N., Chou, M.-T., Hsu, H.-P., Wang, J.-W. and Selvaraj, S. (2017) The Ef-ficiency Improvement by Combining HHO Gas, Coal and Oil in Boiler for Electric-ity Generation. Energies, 10, 251.https://doi.org/10.3390/en10020251
[14] Palmová, I. and Schöngut, J. (2004) Outlook of Production and Utilization of Hy-drogen. Chemicke Listy, 98, 205-210.
[15] Holladay, J.D., Hu, J., King, D.L. and Wang, Y. (2009) An Overview of Hydrogen Production Technologies. Catalysis Today, 139, 244-260.
https://doi.org/10.1016/j.cattod.2008.08.039
[16] Ni, M., Leung, D.Y.C., Leung, M.K.H. and Sumathy, K. (2006) An Overview of Hy-drogen Production from Biomass. Fuel Processing Technology, 87, 461-472.
https://doi.org/10.1016/j.fuproc.2005.11.003
[17] Bičáková, O. (2001) Co-Pyrolysis of Coal/Organic Wastes Mixtures. Dissertation, Department of Gas, Coke and Air Protection, Faculty of Environmental Technolo-gy, Institute of Chemical TechnoloTechnolo-gy, Prague.
[18] Kai, Z. and Zhang, D. (2010) Recent Progress in Alkaline Water Electrolysis for Hydrogen Production and Applications. Progress in Energy and Combustion Science, 36, 307-326.https://doi.org/10.1016/j.pecs.2009.11.002
[19] Bard, A.J. and Faulkner, L.R. (2001) Electrochemical Methods: Fundamentals and Applications. 2nd Edition, John Wiley & Sons, New York.