Int. J. Communications, Network and System Sciences, 2010, 3, 530-539
doi:10.4236/ijcns.2010.36071 Published Online June 2010 (http://www.SciRP.org/journal/ijcns/).
A Multi-Objective QoS Optimization with Fuzzy Based
Parameter Setting for Real-Time Multicasting
Satyananda Champati Rai1, Bijan Bihari Misra1, Ajit Kumar Nayak1, Rajib Mall2, Sateesh Kumar Pradhan3
1
Department of Computer Science and Engineering, Silicon Institute of Technology, Bhubaneswar, India
2
Department of Computer Science and Engineering, Indian Institute of Technology, Kharagpur, India
3
Department of Computer Science and Application, Utkal University, Bhubaneswar, India E-mail:{satya,bijan,ajit}@silicon.ac.in, [email protected], sateesh1960@gmail.com
Received April 6,2010; revised May 8,2010; accepted June 10,2010
Abstract
We propose a multi-objective Pareto-optimal technique using Genetic Algorithm (GA) for group communi-cation, which determines a min-cost multicast tree satisfying end-to-end delay, jitter, packet loss rate and blocking probability constraints. The model incorporates a fuzzy-based selection technique for initialization of Quality of Service (QoS) parameter values at each instance of multicasting. The simulation results show that the proposed algorithm satisfies on-demand QoS requirements (like high availability, good load balanc-ing and fault-tolerance) made by the hosts in varybalanc-ing topology and bursty data traffic in multimedia commu-nication networks.
Keywords:QoS, Fuzzy, Multicast, Real-Time, Multi-Objective
1. Introduction
Multicast services have been used for real-time multime- dia applications to transport audio-video frames, among a group of users. During real-time communication the related audio-video frames are required to be delivered at the end nodes in a synchronous manner [1]. Further, the frequent change of service types, session timings with QoS requirements by the group members increases the communication complexity of the network [2,3]. In a wireless medium the situation further deteriorates than fixed network due to unpredictable mobility of the host nodes as well as their variations in resource requirements. It is also important to keep the network live with all pos-sible satisfactions to the users during that period. Such a scenario requires multi-objective optimizations with con-straints satisfactions [4,5]. The situation becomes critical when the destination nodes require multi-rate multicast sessions [6]. Hence development of multi-objective op-timization algorithm for rate traffic during multi-casting is a challenge for efficient allocation of resources in a dynamically changing network [7,8]. However, a Pareto optimal algorithm can provide better results by fulfilling users’ requirement, irrespective of irrelevant transformation of parameters [4].
To fulfill the on-demand request of the users we use Pareto optimal GA, which guarantees for achieving bet-ter QoS from a large search space. When the size of the network is large the situation demands optimization of QoS parameters such as: delay, jitter, path length (hops), packet loss rate and variation of load among the nodes involved, with high fault-tolerance from the network within acceptable cost. Most of the research works focus on multicasting to a group for near optimal, fast solution with multi-tree backups using GA [9-11].
However, real-time multimedia applications require multi-rate data flow to the served nodes in an on-demand basis with optimized resource allocation and cost in-curred. For addressing multi-objective optimization is-sues GAs are suitable [9].
In this paper, we propose a multi-objective evolution- ary algorithm supporting multi-rate data flow across the network using GA. The algorithm approximates Pareto front by generating a set of non-dominated solutions. Multiple services can be formulated as a multi-objective model [12]. Our model assumes that complete knowl-edge about the network is available to all the nodes pre-sent inside the region.
Pareto-optimality concepts. Our proposed model, its en-vironment setup procedure and implementation with GA are presented in Section 3. The performance evaluation and analysis of the model are elaborated in Section 4. Section 5 concludes the paper and discusses potential future work.
2. Multi-Objective Quality of Service
Multi-objective optimization is used to solve optimiza-tion problems that have two or more number of conflict-ing objectives, where there may not exist an unique op-timal solution. Discovering and fixing opop-timal solutions in such scenarios is an open problem [6,11]. In general, almost all real-world problems are of multiple objectives, where each objective needs to be satisfied. For such type of problems a single best solution does not exist with simultaneous satisfaction of all objectives. In fact, we may have a set of optimal solutions in the entire search space, when all objectives are considered. These solu-tions are known as Pareto-optimal solutions. None of the solutions in this set is absolutely better then any other. So, any one of the solution can be an acceptable solution. In this context, mathematically we can define our problem more precisely, and introduce some related definitions in order to explain our GA based proposed model. It is noted that all of the objectives are in a minimized form in the following discussion.
Multi-Objective Optimization (MOO): Let Z1(X),
Z2(X), …, Zn(X) are n number of objectives to be
opti-mized with gi(X) ≤ 0, i = 1, 2,…, k1 as inequality
con-straints and hi(X) = 0, i = 1, 2, …, k2, as equality
con-straints for the m-dimensional vector X = (x1, x2, …, xm)
then MOO [13] can be defined as follows:
1 2
1 2
1 2
1 2
( ) ( ( ), ( ), , ( )) ( ) 0, 1, 2, ,
( ) 0, 1, 2, ...,
( , , , )
, 1, 2, ,
n i
i
m m i i
Minimize Z X Z X Z X Z X subject to g X i k
h X i k
where X x x x and x
i m
(1)
Pareto Dominance: If and
are two characteristic functions then dominates V(u v) if and only if the condition is
satisfied for and
1 2
( , , , m) U u u u
i i
m u v i {1,
1 2
( , , , )m
V v v v U
{1, 2
i , , }: 2,
. , }:m ui vi
Pareto Optimality: A solution is said to be Pareto Optimal if and only if
X
: ( ) ( ) X Z X Z X
Pareto Optimality Set: A Pareto Optimality set P is defined as P{X | X : ( )Z X Z X(
Pareto Front: It is defined asPF{ ( )|Z X XP}.
3. Proposed Model
In this section we introduce the multi-objective model with its attributes, and their mapping to GA with Pare-to-optimal verification.
3.1. Network Model
The network consists of n number of similar mobile hosts moving within a three-dimensional space. The nodes can communicate among themselves either di-rectly or indidi-rectly via intermediate nodes. All nodes are capable of transreceiving as well as forwarding the re-quest of their neighbors to its near by nodes with broad-casting. For any instant of time the nodes along with their links can be represented as G = (V, E), where V and, E represent the set of nodes and edges in the network respectively. A multicast tree T = (VT, ET) in the graph G
is rooted at source node s with destination nodes {d1,
d2, …, dt} (tn) act as group members for the source
node. A tree is having k number of branches and each branch is of r number of edges. The QoS parame-ters considered for multi-objective optimization during multicasting from a single source to its group members are as follows:
(kt)
)
) )
Bandwidth (BW): The bandwidth of a tree is the av-erage bandwidth of all its branches; whereas bandwidth of any branch of a tree is the minimum of all its edge bandwidths from source to the corresponding destination node. Both branch bandwidth and tree bandwidth are represented in Equations (2) and (3) as follows:
(BWl
(BW
(BWb T
min , 1, 2, ,
b l
BW BW l r (2)
{ , 1, 2,..., }
T b
BW mean BW b k (3)
Delay (DL): Delay between two corresponding node (branch delay: ) is the sum of the delay at the in-termediate nodes (node delay: ) as well as the propagation delay through the links (link delay: ) from source to destination. For a multicast tree the tree delay is the maximum delay among all branch delays ( ). The two different delays can be shown as:
b
DL
v
DL
e
DL
(DLT b
DL )
v
T T
b e
e E v V
DL DL DL
(4)max{ , 1, 2,..., }
T b
DL DL b k (5)
Jitter (JT): It is defined as the average delay variation between any source and destination nodes during trans-mission of data packets. It is due to processing delay variation at the intermediate nodes as well as the propa-)} where
1 2
( , , , m)
S. C. RAI ET AL.
532
gation delay variation during communication through the links. In a multicast tree the jitter for any branch (JTb)is the sum of the jitter at the intermediate vertices
(JTv)and in each edge (JTe); whereas the jitter for a
multicast tree is the maximum among all branches and are given in the following equations.
T T
b e e E v V
v
JT JT J
T (6)max{ , 1, 2,..., }
T b
JT JT b k
) )
)
(7) Packet Loss Rate (PLR): It is defined as a ratio of the number of lost packets to the total number of transmitted packets. PLR for a tree branch is the cumulative along each edge of the path from root to the leaf node; where as the PLR for a multicast tree is the average loss rate of all branches present in the tree. Both can be represented mathematically as:
(PLRb
e
(PLR
(PLRT)
e
1 (1
T
b
e E
PLR PLR
(8){ , 1, 2,..., }
T b
PLR mean PLR b k (9)
Blocking Probability (BP): The ratio between num-ber of blocked calls to the numnum-ber of offered calls in a tree is considered as the blocking probability for that tree. In other words it is the ratio of unreached nodes to the total number of destination nodes available in a multicast tree. Mathematically it is represented as:
T
number of destinations not reached BP
total number of destinations
(10)
3.2. Formulation of Problem
The Bandwidth (BW), end-to-end delay (DL), jitter (JT), packet loss rate (PLR) and blocking probability (BP) are the five QoS parameters as defined in Subsection 3.1 are considered for our model. All the five objectives are to be satisfied simultaneously within their desired accept-able range for multi-objective optimization. Except BW all other objectives will be minimized, where as the for-mer is to be maximized for optimal utilization. As de-fined in Equation (1) our MOO problem can be formu-lated as:
1 2 3
( , , , , )
, , ,
,
0, 1, 2,3, 4
i
Optimize Z Z BW DL JT PLR BP subject to DL JT PLR BP and BW
where i
and is some positive threshold value
4
(11)
3.3. Simulation Model Using GA
In our proposed model, we choose a heuristic based Ge-netic Algorithm with binary crossover and Roulette
Wheel Selection approach. The fitness/objective function is the multi-objective function defined in Equation (11). The different phases of GA for natural evolution through encoding, selection, crossover and mutation operations are discussed as below.
Encoding: We use tree encoding for each chromo-some to represent a multicast tree due to the 5 properties such as 1) all feasible trees can be represented; 2) the probability of representing all feasible tree is same; 3) only trees are represented; 4) low time complexity for encoding and decoding, and 5) no global effect on the tree, due to small change in representation, as proposed in [14].
The Genetic Operators:
1) Selection: We have used an elitist model for selec-tion of the individuals for the next generaselec-tion of popula-tion. 30 percent of the best fit individuals are selected at the first step for the next generation. Rest 70 percent of the population are selected using Roulette Wheel selec-tion method.
2) Crossover: Standard uniform crossover technique is used for the crossover of two parents selected randomly from the matting pool.
3) Mutation: We observe that using the standard mutation technique we do not obtain the requisite level of performance. When the mutation probability is bit low it does not yield any result. In our model we have kept the mutation probability very high, i.e., 0.2 and slowly decrease it with the progress of the generations using the following method.
(max min )
max
max
m m
m m
P P curGen
P P
Gen
(12)
where, Pm: current mutation probability, maxPm: Maxi- mum mutation probability, : Minimum mutation probability, : current generation, and : maximum generation
minPm
curGen maxGen
Fitness Test: The fitness of a tree is evaluated in two steps. In the first step, we evaluate Delay, Jitter, PLR and BP using Equations (5), (7), (9) and (10) respectively. Instead of bandwidth we evaluate deficiency from max-imum bandwidth ( s)
BW . So, and repre-sented in Equations (2) and (3) are modified as follows.
b
BW BWT
max{ , 1, 2,..., }
s s
b l
BW BW l r (13)
{ ,
s s
T b
BW mean BW bET} (14)
At the time of evaluation, if we find an invalid node, which is not an intermediate node in the respective path, then a penalty value is added to the delay. If the BW, JT, PLR and BP values lie outside the desired range, for each case we add a small penalty to the delay. The values of DL, s
evalu-ated as follows Table 1. Network Parameters.
1 2 3 4 5
s
f w DLw BW w JTw PLRw BP (15) Network Parameters Min Max
Bandwidth 0 25
Delay 200 1000
Jitter 0 650
Packet Loss Rate 0 1
where , , , , and are user defined con-stants in the range [0, 1]. The fit value i.e.
1
w w2 w3 w4 w5
1 (1 )
fit f in the range [0, 1] is maximized by using GA.
[image:4.595.308.536.93.280.2]3.4. Simulation Procedure
Table 2. GA Parameters.
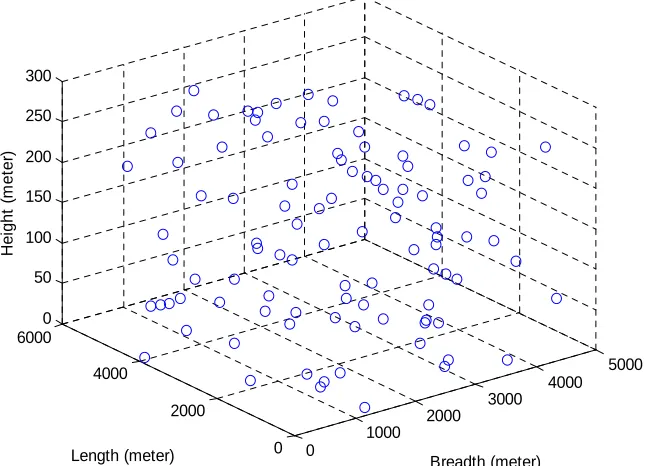
1) Scenario Generation: For our simulation purpose, we have considered a three dimensional (3D) space to simu-late real life wireless scenarios. The 3D coordinates of a node are randomly generated. The Euclidean distance between each pair of nodes is measured. If the distance between any two nodes is found to be less then 250 me-ters then a link is established between these two nodes and accordingly the adjacency matrix is formed. The scenario represented in Figure 1 is one of our network topology formed during simulation.
GA Parameter Value
Population Size 100
Crossover Probability 0.6
Mutation Probability 0.2
good result. For the subsequent simulations, we take a high value such as 0.2 for the mutation probability to ensure a diversified search and slowly reduces as the Once the network is formed, the source and
destina-tions are generated randomly and GA is applied to find out the optimal multicast tree over a set of evolutions. Also we define different cut-off ranges for various net-work parameters to fulfill the demands of multimedia applications. These cut-off values were considered in the algorithm while a tree is selected for optimality.
network converges to an optimal solution to narrow down the search in the close proximity.
In our model we have considered the nodes are of ho-mogeneous with respect to their transmission range, proc-essing capability and buffer length [15,16]. The wireless bandwidth is equally shared among the mobile entities. At any instance of the simulation the available bandwidth is optimized in consideration with the QoS required by the end nodes. To emulate the scenario the available band-width for each node can be obtained randomly. However, random initialization of other QoS parameters like de- 2) Simulation Parameters: The Network and GA
parameter values considered for our simulation are given in the Table 1 and Table 2 respectively. During initial stage of our simulation, we have given a constant low value to the mutation probability, which did not yield
0
1000 2000
3000 4000
5000
0 2000
4000 6000
0 50 100 150 200 250 300
Breadth (meter) Length (meter)
He
ig
ht
(
m
et
er
[image:4.595.140.463.468.701.2])
S. C. RAI ET AL.
534
lay(DL), jitter (JT) and packet loss rate (PLR) and blocking probability (BP) may results unpredictable net-work performance. Although there is no established rela-tionship among the parameters [7,17], we propose a sigmoidal fuzzy-logic based parameter initialization with error model for our GA approach in (17).
1
( ; , )
1 exp( (
))
sig x a c
a x c
(16)0.2
fs sig rand sig (17)
We establish the relationship between available band-width and other parameters with the following formulae as given in Equations (18) to (21).
( ) (( ); , )
i i D D
DnD XDnD fs xWx a c (18)
( ) (( ); , )
i i J J
J nJ xJnJ fs xWx a c (19)
( ) (( ); ,
i i
L nL xLnL fs xWx a cL L)
i P P
(20)
( ) (( ); , )
i
P nP xPnP fs xWx a c (21)
where the triplets (xD, nD, Di), (xJ, nJ, Ji), (xL, nL, Li)
and (xP, nP, Pi) represent maximum, minimum and
cur-rent values of DL, JT, PLR, and BP of the ith node re-spectively. xW and xi represent maximum and allocated
BW for the ith node respectively. The parame-ters( ,aD cD),( , )a cJ J , ( , )a cL L , and ( , )a cP P used in evaluation of sigmoidal function are suitably selected constants which are obtained after a maximum number of testing.
4. Simulation Results and Performance
Analysis
[image:5.595.309.538.105.262.2]In this simulation our objective is to test if the proposed model is producing an optimal solution with multi-ob-jective constraints. During simulation, the total number of nodes were varied from 10 to 100 by keeping density of the nodes in the space same by changing the space volume according to total number of nodes such that the maximum number of neighbors present for a node is lim-ited to 6. The multicast group size was kept as one fourth of the total nodes. The maximum numbers of generations for evolution were fixed at 250. As the objectives are conflicting in nature, to obtain the Pareto-optimal solu-tion we have considered different sets of randomly se-lected weights in Equation (15) for each simulation. However, one may consider meta-heuristic approach for dynamic selection of those weights. The range of net-work parameters and GA parameters considered for evaluating QoS parameters are represented in Table 1 and Table 2 respectively. The simulation results of QoS parameters are shown in Table 3.
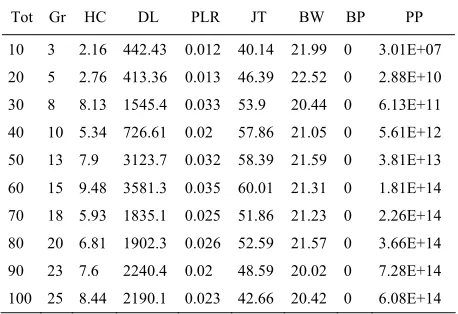
Table 3. Average results of QoS parameters with different group size.
Tot Gr HC DL PLR JT BW BP PP
10 3 2.16 442.43 0.012 40.14 21.99 0 3.01E+07 20 5 2.76 413.36 0.013 46.39 22.52 0 2.88E+10 30 8 8.13 1545.4 0.033 53.9 20.44 0 6.13E+11 40 10 5.34 726.61 0.02 57.86 21.05 0 5.61E+12 50 13 7.9 3123.7 0.032 58.39 21.59 0 3.81E+13 60 15 9.48 3581.3 0.035 60.01 21.31 0 1.81E+14 70 18 5.93 1835.1 0.025 51.86 21.23 0 2.26E+14 80 20 6.81 1902.3 0.026 52.59 21.57 0 3.66E+14 90 23 7.6 2240.4 0.02 48.59 20.02 0 7.28E+14 100 25 8.44 2190.1 0.023 42.66 20.42 0 6.08E+14
4.1. A Study of QoS Parameters
Hop Count (HC) represents the maximum number of hops required to reach any destination in the multicast tree.
Delay (DL): is the maximum delay along any branch of the tree. A penalty is added if no link found between two nodes.
Packet Loss Rate (PLR): is the average packet loss along the tree branches. The cut-off for PLR is set at 10%. If a branch having more than 10% packet loss then it is assigned a penalty, such that the model tries to search a path less then10% PLR.
Jitter (JT): is the maximum delay variation along any branch of the tree. The cut-off is set at 20% otherwise a penalty is added.
Bandwidth (BW): of the multicast tree is the average bandwidth requirement of all the tree branches. The cut-off BW is taken as 2 Mbps.
Blocking Probability (BP): is the ratio of not getting a node to the total number of destination nodes in the mul-ticast tree.
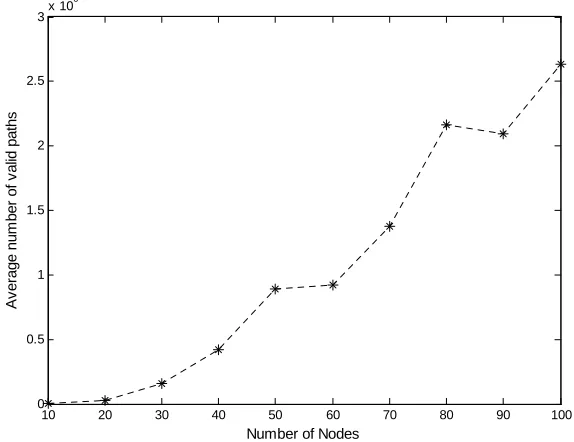
Possible Paths (PP): in the tree are the average possi-ble paths availapossi-ble for any destinations in the tree. The PP field gives an estimation of the search space and also proves the efficiency of our algorithm to find an optimal tree from such a huge search space. Also the BP field proves the definiteness of this algorithm to find a path from source node to destination node (if exists).
The ‘Tot’ represents the total number of nodes con-sidered for the simulation and ‘Gr’ represents the multi-cast group size. In order to maintain node density, we ha- ve increased the volume of the search space proportion-ately as the total number of nodes. The QoS parameter values were obtained by changing the total number of nodes and the respective multicast group size.
work conditions is assumed to be constant, i.e. the adja-cency matrix representing the links among the nodes is not altered.
parameters are also reinitialized for each simulation. We have not considered HC as a parameter for optimization; as a result we obtained different results for different tar-get size depending upon the availability connectivity. As we have considered a minimum delay of 200 ms per node, the delay affects with increase in the number of hops. However, this algorithm has ensured to find a path where the delay gets minimized.
The results of QoS parameter values obtained from simulation show that our proposed model can adapt and scale well to large group members and capable of ob-taining near optimal solution from a large search space.
The robustness of our GA based approach is the inher-ent capability of obtaining optimal solution after search-ing from a large search space, which is shown in Figure 2.
4.2. A Simulation Study
The overall results from our simulation studies have been presented in Table 3. We now present the details of a sin- Further the increase in group size of a multicast
envi-ronment results in marginal elevation in the node density. The node density of a multicast tree is considered as the ratio between numbers of nodes in the tree to the size of the group. i.e. represented as
gle simulation study to show the working of the algo-rithm and the performance results that were obtained. In this simulation, we have considered 10 nodes as a net-work from the environment consisting of 100 nodes. In the selected group, the node with index number 14 was taken as the source node and nodes with indices 5, 11, 15, 17, 20 were considered as the target nodes.
number of nodes in the tree node density
size of the group
[image:6.595.151.438.333.554.2] (22)
Table 4 presents the status of a typical simulation. The While measuring intermediate node density, the net-
10 20 30 40 50 60 70 80 90 100
0 0.5 1 1.5 2 2.5
3x 10
6
Number of Nodes
A
v
e
ra
ge n
u
m
ber
of
v
a
lid
pat
h
s
[image:6.595.70.531.598.721.2]Figure 2. A subset of total search space representing average number of valid paths with 5 intermediate nodes.
Table 4. Multicast Tree with QoS Parameter Values.
Result obtained after generation
25 50 75 100 125 150
Multicast Tree
14→11 14→15 14→5 14→17 14→6→20
14→11 14→15 14→5 14→12→17 14→6→20
14→11 14→15 14→5 14→12→17 14→6→20
14→11 14→15 14→5 14→12→17 14→6→20
14→11 14→15 14→5 14→12→17 14→6→20
14→11 14→15 14→5 14→12→17 14→6→20
HC 1.2 1.4 1.4 1.4 1.4 1.4
DL 240.52 280.35 280.35 280.35 280.35 280.25
PLR 0.097278 0.09291 0.09291 0.09291 0.09291 0.09016
JIT 48.462 46.835 46.835 46.835 46.835 43.37
BW 21.521 21.672 21.672 21.672 21.672 22.006
BP 0.0 0.0 0.0 0.0 0.0 0.0
S. C. RAI ET AL.
536
results obtained after every 25 simulations were recorded, the multicast tree obtained and the QoS parameter values at that instance have been represented in this table. From the table it can be observed that the multicast tree pro-duced by this method does not change after 50 iterations and stabilizes. Please note that the values given in Table 4 for HC, DL, PLR, JIT, BW, and BP are the mean val-ues of the different multicast trees represented in the population for the respective generation. These values converge after 150 generations.
4.3. Performance Analysis
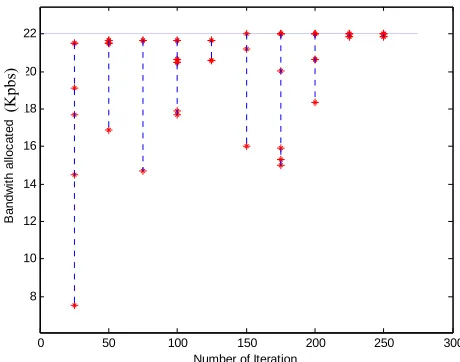
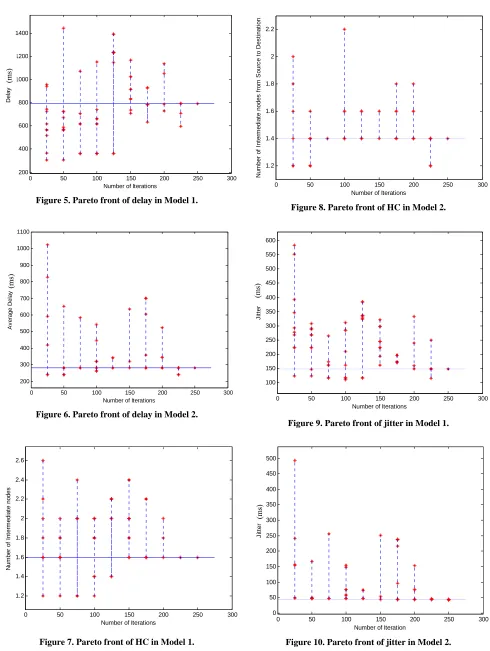
For the purpose of comparison, we have simulated the approach presented in [18] and the performance results have been represented as Model 1 results. The simulation results of the current study have been presented as Model 2 results. In a typical simulation we have taken the total number of nodes in the network as 20, one source and 5 destinations, with a population size 10, the GA was al-lowed to run for 250 generations. The QoS metric values of the population are recorded after every 25 generations. The results of Model 1 are presented in Figures 3, 5, 7, 9, 11 and that of Model 2 in Figures 4, 6, 8, 10 and 12. The objective of this experimentation (given in Equa-tion 11) is to maximize the bandwidth (BW) and to mi-nimize all other parameters. From Figures 3 and 4, we can see that optimal bandwidth allocation in the current study is 22.01 Kbps as against 5.98 Kbps in Model 1, giving performance improvement of 267.99%.
One of the objectives is to minimize the delay while optimizing all other parameters. The Pareto fronts for delay in Model 1 and Model 2 have been presented in Figures 5 and 6 respectively. The optimal delay was rounded to be 794.47 ms in Model 1 as against 280.25 ms in Model 2, which shows a performance improvement of 64.72 % in delay parameter.
The Pareto fronts for HC have been presented in Fig-ures 7 and 8 respectively for Model 1 and Model 2. The Pareto fronts for jitter have been presented in Figures 9 and 10 respectively. The optimal level of jitter was 149.87 ms for Model 1 and 43.37 ms for Model 2, giving an improvement in performance of 71.06 %. The Pareto fronts for PLR have been presented as Figures 11 and 12.
The optimal level of PLR for Model 1 is 0.4368 and for Model 2 is 0.09016, giving an improvement of perform-ance of 79.36%.
The performance of this work is compared with the performance of the models suggested by other research-ers. On comparing our results with that of Roy et al.[19], we find that our approach outperforms the approach pre-sented in [19]. However, Roy et al. has considered only three parameters such as bandwidth requirement, band-width utilization and end-to-end delay. The bandband-width requirement and bandwidth utilization possibly relates to
one parameter, resulting multi-objective for two parame-ters only as against 5 distinct parameparame-ters considered in our study.
The non-dominated solution of bandwidth utilization and end-to-end delay converges almost in the same num-ber of generations as pointed by Roy et al. [20]. The call blocking (BP) percentage was found to be 10% with 10 requests per second in [20]. However in our study, we have obtained 0.0 BP with network size in the range of [10, 100] where the respective maximal group size is one fourth of the network size.
In the following, we compare our work with some of the other related work. Gomathy et al. [11] have evaluated the packet delivery ratio and end-to-end delay of ODMRP, CAMP, and NTPMR multicast routing protocols after incorporation of a fuzzy based priority scheduler. Pinto et al. [21] has considered maximum end-to-end delay, average delay, maximum link utilization and cost of multicast tree as the four multi objective parameters for
0 50 100 150 200 250 300 4
6 8 10 12 14 16 18 20 22
B
andw
idt
h
Number of Iterations
(Kp
bs
[image:7.595.310.540.523.704.2])
Figure 3. Pareto front of bandwidth allocation in Model 1.
0 50 100 150 200 250 300
8 10 12 14 16 18 20 22
Number of Iteration
B
a
ndw
it
h
al
loc
at
e
d
(Kp
bs
)
0 50 100 150 200 250 300 200
400 600 800 1000 1200 1400
Number of Iterations
De
la
y
Figure 5. Pareto front of delay in Model 1.
0 50 100 150 200 250 300 200
300 400 500 600 700 800 900 1000 1100
Number of Iterations
A
v
erage Del
ay
Figure 6. Pareto front of delay in Model 2.
0 50 100 150 200 250 300
1.2 1.4 1.6 1.8 2 2.2 2.4 2.6
Number of Iterations
N
u
m
b
e
r
o
f In
te
rm
e
d
ia
te
n
o
d
e
s
Figure 7. Pareto front of HC in Model 1.
0 50 100 150 200 250 300
1.2 1.4 1.6 1.8 2 2.2
Number of Iterations
N
um
b
er
of
I
nt
e
rm
edi
at
e
nodes
f
rom
S
our
c
e t
o D
es
ti
nat
ion
(ms)
Figure 8. Pareto front of HC in Model 2.
0 50 100 150 200 250 300
100 150 200 250 300 350 400 450 500 550 600
Number of Iterations
Ji
tt
e
r
(ms)
(ms)
Figure 9. Pareto front of jitter in Model 1.
0 50 100 150 200 250 300
0 50 100 150 200 250 300 350 400 450 500
Number of Iteration
Ji
tt
e
r
[image:8.595.55.545.74.725.2](ms)
S. C. RAI ET AL.
538
0 50 100 150 200 250 300
0 0.1 0.2 0.3 0.4 0.5 0.6 0.7 0.8 0.9
Number of Iterations
P
a
c
k
et
Lo
s
s
r
a
[image:9.595.62.290.78.256.2]te
Figure 11. Pareto front of PLR in Model 1.
0 50 100 150 200 250 300
0.1 0.2 0.3 0.4 0.5 0.6 0.7 0.8
Number of Iterations
P
ac
k
et
Los
s
R
at
[image:9.595.65.291.293.477.2]e
Figure 12. Pareto front of PLR in Model 2.
optimization, where the maximum end-to-end delay and average delay may be considered as related features. Maximum delay, average delay, maximum link utilization, cost of the tree are the four multi objective features con-sidered by Crichigno et al. [22]; where the first two ob-jectives belong to one feature. Fabregat et al. [4] consid-ered a static network and they have optimized maximal link utilization, hop count, average delay, and bandwidth consumption parameters. Marwaha et al. [23] have con-sidered end-to-end delay, packet delivery ratio, packet loss ratio, routing load and route failure as the optimiza-tion parameters for a mobile ad-hoc network with 900 seconds as the network pause time, where the packet de-livery ratio and the packet loss ratio are related features. Whereas in our work, we have considered 5 distinct pa-rameters such as bandwidth allocation, end-to-end delay, jitter, packet loss rate, and blocking probability as our multi-objective optimization criterion. Further the
simula-tion environments considered by these researchers are not compatible to ours to make a meaningful performance comparison.
5. Conclusions
We have proposed a multi-objective multicast model for wireless ad-hoc network using GA. In this model we have considered five QoS parameters such as bandwidth, end-to-end delay, jitter, packet loss rate and blocking probability for multi-objective optimization. Simulation studies were carried out with a network of 100 nodes moving in a 3D space of volume: 5000 × 6000 × 300 cubic meters with the number of multicast destination nodes varying in the range 5 to 30. Our model estab-lished near optimal relationships among the QoS pa-rameters to satisfy multi-objective optimization. Irre-spective of increase in group size our model could opti-mize path length between any sources to its group mem-bers. Selection of min-cost paths from source to multiple destinations for multicasting is a NP-hard problem. Our approach could effectively obtain near optimal solution for QoS multicast applications in varying network condi-tions. As per our knowledge no relationships among the QoS parameters have so far been established. We pro-pose a fuzzy-based parameter setting approach which establishes a Sigmoidal relationship among the parame-ters. Due to the dynamism of the network there is a pos-sibility of sudden change of the network type and status of resources. The empirical results show superiority over the randomly selected resource values. As a future work, we plan to consider biological-inspired optimized tech-niques for estimation of multicast cost arising from queuing delays and propagation error.
6. References
[1] Y. He, I. Lee and L. Guan, “Optimized Video Multicasting Over Wireless Ad Hoc Networks Using Distributed Algorithm,” IEEE Transactions on Circuits
and Systems for Video Technology, Vol. 19, No. 6, June
2009, pp. 796-807.
[2] C. Fortuna, M. Mohorcic and B. Filipic, “Multi-objective Optimization of Service Delivery over a Heterogeneous Wireless Access System,” Proceeding of IEEE Inter-
national Symposium on Wireless Communication Systems,
Reykjavik, 2008,pp. 133-137.
[3] W. X. Gu and X. F. Liu, “A New Algorithm for Probabilistic Planning Based on Multi-Objective Opti- mization,” Proceeding of IEEE International Conference
on Machine Learing and Cybernetics, Kunming, 12-15
July 2008, pp. 1812-1817.
Latin American Conference on Networking, New York,
2005, pp. 73-86.
[5] H. Juidette and H. Youlal, “Fuzzy Dynamic Path Planning Using Genetic Algorithms,” IEEE Electronics
Letters, Vol. 36, No. 4, February 2000, pp. 374-378.
[6] P. Chen and T. L. Dong, “A Fuzzy Genetic Algorithm for QoS Multicast Routing,” Journal of Computer Comm-
unication, Vol. 26, No. 6, 2003, pp. 506-512.
[7] A. Khisti, U. Erez and G. W. Wornell, “Fundamental Limits and Scaling Behavior of Cooperative Multicasting in Wireless Networks,” IEEE Transactions on Infor-
mation Theory, Vol. 52, No. 6, June 2006, pp. 2762-2770.
[8] A. Striegel and G. Manimaran, “A Survey of QoS Multicasting Issues,” IEEE Communication Magazine, Vol. 40, No. 6, June 2002, pp. 82-87.
[9] X. Cui, C. Lin and Y. Wei, “A Multi-objective Model for QoS Multicast Routing Based on Genetic Algorithm,”
Proceeding of IEEE International Conference on
Computer Networks and Mobile Computing (ICCNMC),
Shanghai, 2003, pp. 49-53.
[10] A. Dutta, J. Chennikara, W. Chen, O. Altintas and H. Schulzrinne, “Multicasting Streaming Media to Mobile Users,” IEEE Communications Magazine, Vol. 41, No.
10, October 2003, pp. 81-89.
[11] C. Gomathy and S. Shanmugavel, “Supporting QoS in MANET by a Fuzzy Priority Scheduler and Performance Analysis with Multicast Routing Protocols,” EURASIP
Journal on Wireless Communications and Networking,
Vol. 5, No. 3, 2005, pp. 426-436.
[12] A. Daid, V. Van and B. Gary, “Multi-Objective Evo- lutionary Algorithm: Analyzing the State-of-the-Art,”
Evolutionary Computation, Vol. 8, No. 2, 2000, pp. 125-
147.
[13] J. Q. Wang, J. Qin and L. S. Kang, “A New QoS Multicast Routing Model and its Immune Optimization Algorithm,” Lecture Notes in Computer Science, Vol.
4159, 2006, pp. 369-378.
[14] C. C. Palmer and A. Keshenbaum, “Representing Trees in Genetic Algorithms,” Proceeding of IEEE Inter-
national Conference on Evolutionary Computation, Orlan-
do, Vol. 1, 1994, pp. 379-384.
[15] S. Sivavakeesar, G. Pavlou and A. Liotta “Stable Clustering through Mobility Prediction for Large-Scale
Multiple Intelligent Ad-hoc Networks,” Proceeding of IEEE Wireless Communications and Networking Con-
ference, Atlanta,Vol. 3, March 2004, pp. 1488-1493.
[16] J. Yu, L. Chen and G. Chen, “A Fuzzy Grouping Mechanism for Distributed Interactive Simulation,” Pro- ceeding of IEEE International Conference on Commu-
nication, Seoul, 2005, pp. 881-885.
[17] G. M. B. Oliveira and P. T. Araujo, “Determining Multicast Routes with QoS and Traffic Engineering Requirements Based on Genetic Algorithm,” Proceeding of IEEE Conference on Cybernetics and Intelligent
Systems, Singapore, 1-3 December 2004, pp. 666-670.
[18] S. C. Rai, B. B. Mishra, A. K. Nayak, R. Mall and S. K. Pradhan, “A Multi-Objective Pareto Optimal Genetic Algorithm for QoS Multicasting,” Proceeding of IEEE
International Advance Computing Conference, Patiala,
2009, pp. 1303-1307.
[19] A. Roy and S. K. Das, “Optimizing QoS-Based Multicast Routing in Wireless Networks: A Mullti-objective Ge-netic Algorithmic Approach,” Proceedings of the 2nd
In-ternational IFIP-TC6 Networking Conference on
Net-working Technologies, Services, and Protocols, Lecture
Notes in Computer Science, Berlin Heidelberg, Vol. 2345,
Springer-Verlag, 2002, pp. 28-48.
[20] A. Roy, N. Banerjee and S. K. Das, “An Efficient Multi- Objective QoS-Routing Algorithm for Wireless Mul- ticasting,” Proceeding of IEEE Vehicular Technology
Conference, San Diego,Vol. 3, 2002, pp. 1160-1164.
[21] D. Pinto and B. Baran, “Solving Multi-Objective Multicast Routing Problem with a New Ant Colony Optimization Approach,” Proceeding of 3rd International
IFIP/ACM Latin American Conference on Networking,
New York, 2005, pp. 11-19.
[22] J. Crichigno and B. Baran, “Multi-Objective Multicast Routing Algorithm for Traffic Engineering,” Proceeding
of 13th IEEE Inernational Conference on Computer
Communications and Networks (ICCCN), Chicago, 2004,
pp. 301-306.
[23] S. Marwaha, D. Srinivasan, C. K. Tham and A. Vasilakos, “Evolutionary Fuzzy Multi-Objective Routing for Wireless Mobile Ad Hoc Networks,” Proceeding of
Evolutionary Computation (CEC’04), San Diego,Vol. 2,